

Article Figures & Data
Figures
- Figure 1.
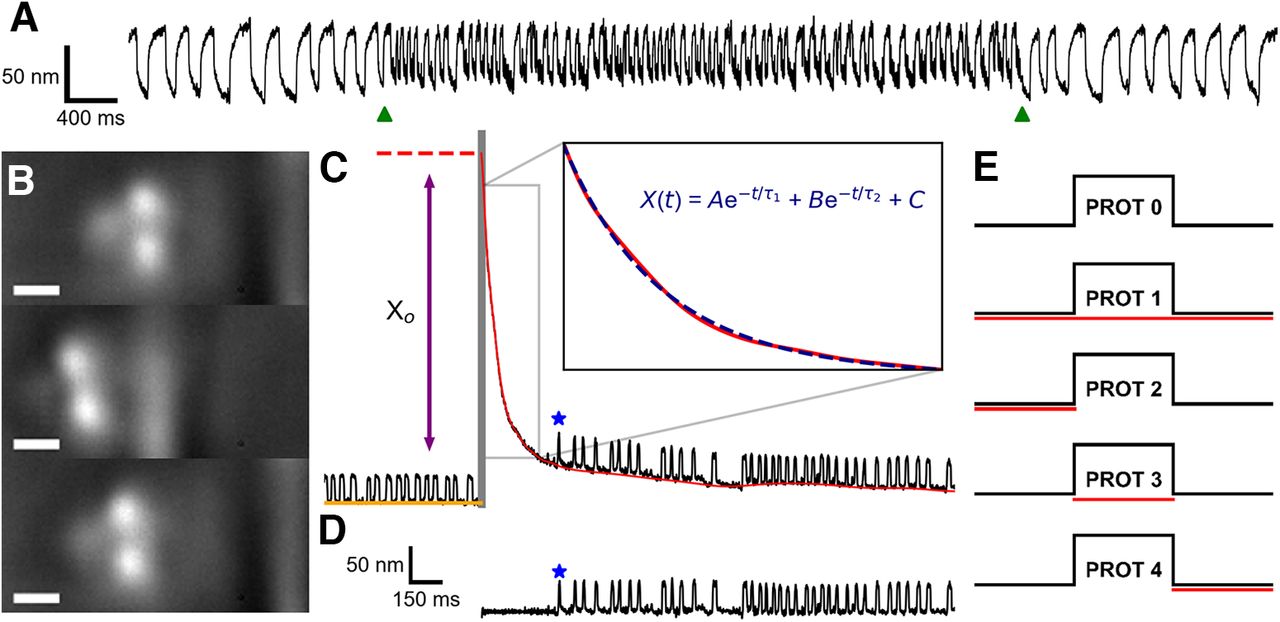
A, Spontaneous oscillations before, during, and after efferent stimulation (pulse train: 200 μA, 1 ms on, 10 ms off) are displayed for a representative hair bundle. The onset and offset of the efferent stimulus are indicated by the two green triangles located below the position trace. B, Bright field images showing the application of a large-amplitude (∼1 μm) mechanical deflection to an individual hair bundle via a stiff glass probe. Top, middle, and bottom panels, Hair bundle before, during, and immediately after the mechanical overstimulation, respectively. The width of the scale bar is 1 μm. C, Hair bundle position traces (black) are extracted from high-speed recordings of hair cells undergoing mechanical overstimulation. Hair bundles experience an induced offset before relaxing back to their initial oscillatory dynamic state. The gray vertical bar represents the interval during which the deflection is applied. The baseline (red) of a hair bundle’s relaxation trace (black) is subtracted from the original trace to obtain a flattened recovery trace (D). The blue star annotates the location of the first detected oscillation. The initial (induced) offset, Xo, is the height difference between the position of the hair bundle directly after the withdrawal of the glass probe (red dotted line) and the baseline of the prestimulus spontaneous oscillations (orange line). The baselines are fitted to a function (blue dashed line) that consists of the sum of two exponentials with time constants τ1 and τ2 (where
- Figure 2.
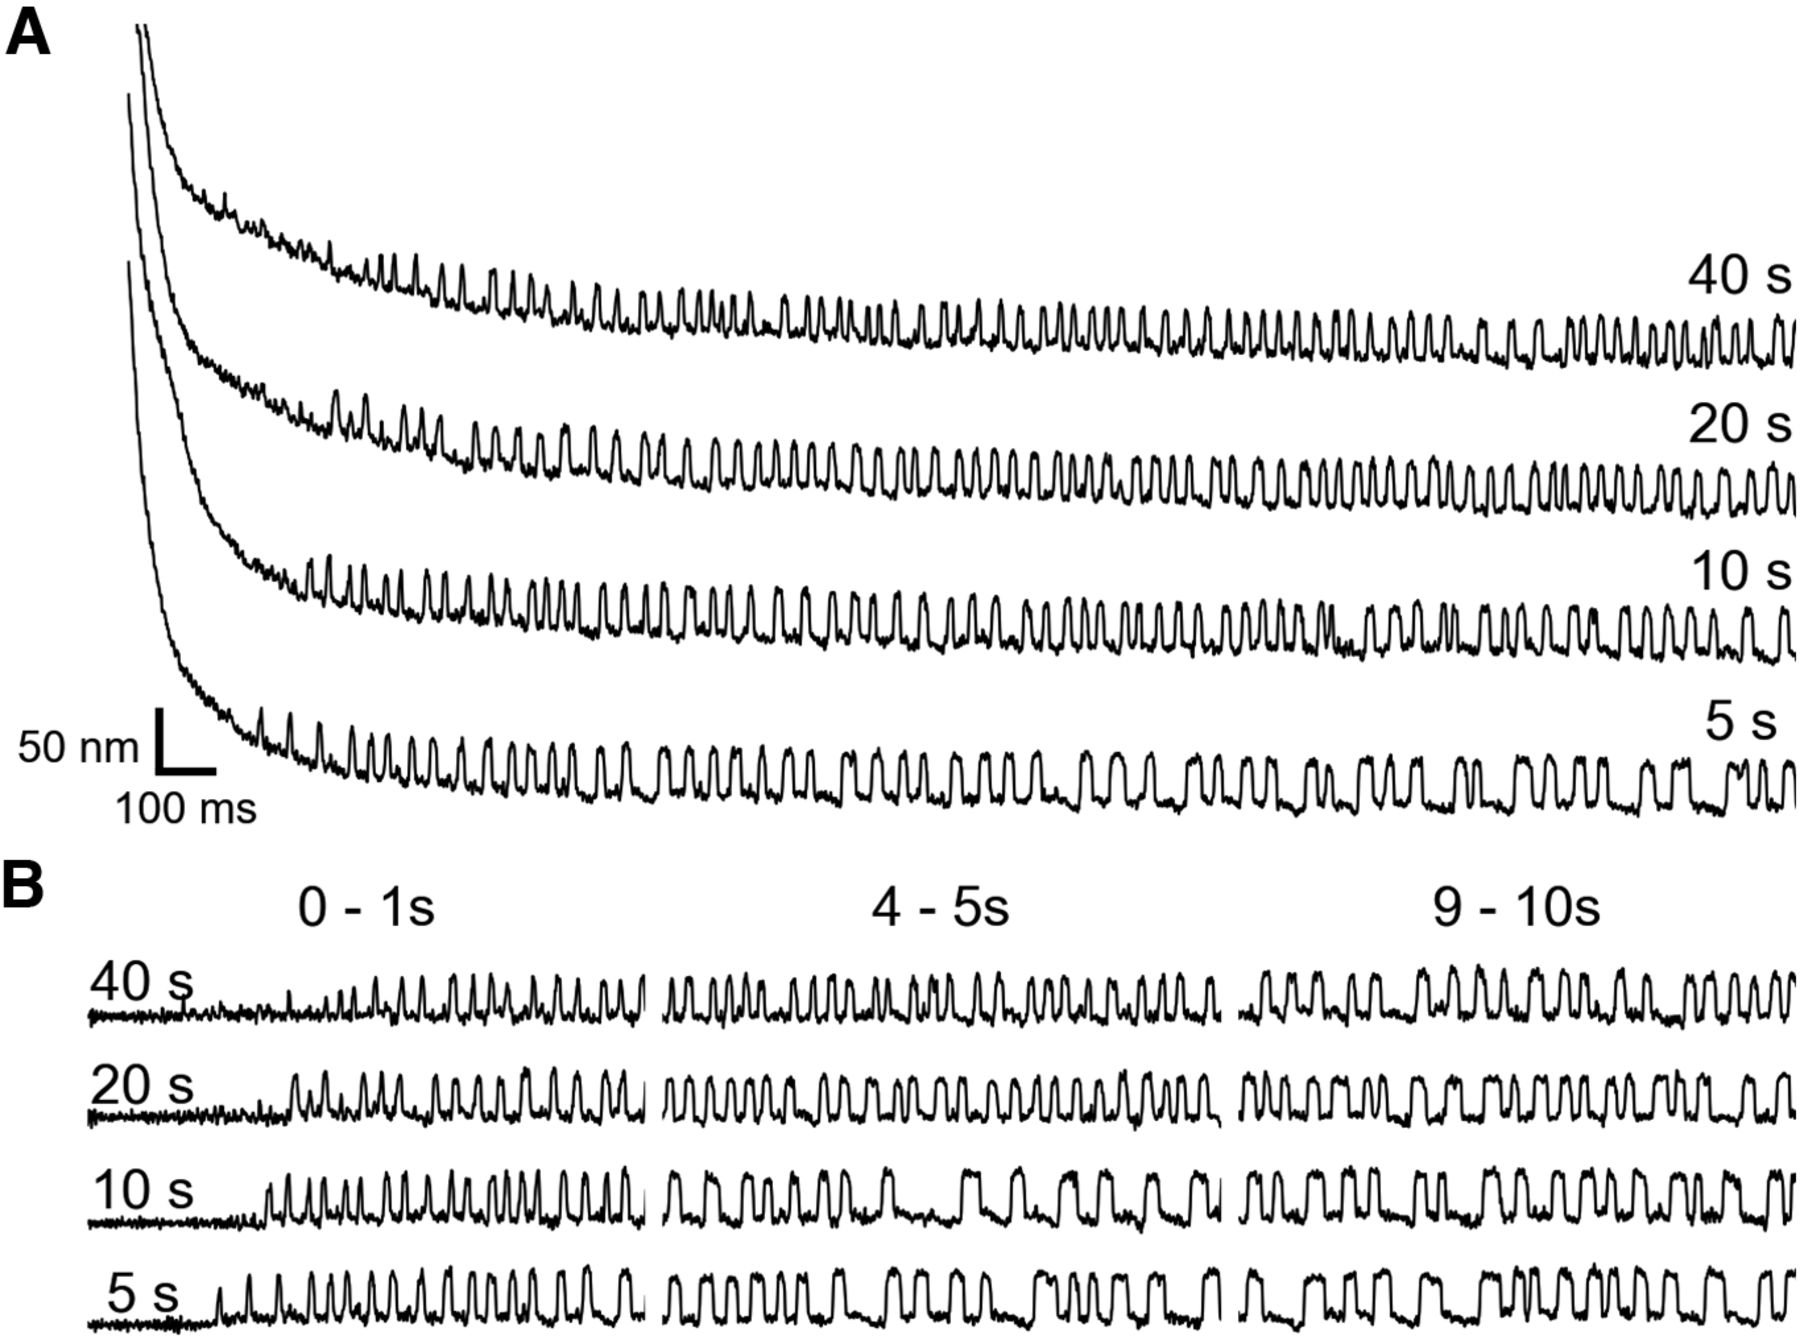
A hair bundle’s relaxation trajectory is dependent on the duration of mechanical overstimulation. A, A series of traces recorded from a single hair cell is shown. Each trace depicts hair bundle recovery following mechanical overstimulation of duration (in seconds) indicated on the right. The hair bundle remains in a quiescent state longer with increasing stimulus duration. The recording order was from bottom to top. B, A series of flattened recovery traces, extracted from the recordings displayed in A, is shown. Three, chronologically subsequent segments are displayed in the first (0–1 s), second (4–5 s), and third (9–10 s) panels. Longer ODs lead to slower recovery of the original oscillation profile. Scale bars in A are applicable for B.
- Figure 3.
Varying the duration of hair bundle deflection affects the induced shifts in the oscillation parameters. Time-series trendlines of instantaneous frequencies, amplitudes, and inferred MET channel open probabilities are plotted for the hair cell in Figure 2 (A, D, G) and another cell from a different sacculus (B, E, H). The four ODs (5, 10, 20, 40 s) are plotted in red, gold, blue, and violet, respectively. The black dashed lines indicate the corresponding values of the cell’s original dynamic state. A hair bundle re-enters the oscillatory regime displaying different characteristics from its initial state. The oscillation parameters reflect this difference before gradually transitioning back to their characteristic values. Frequency, amplitude, and open probability trendlines of the same OD were averaged together to obtain the mean trendlines in C, F, I, respectively. As the OD increases, the initial frequency increases, while the amplitude and open probability decrease. This increased detuning from the original state correlates with a slower recovery from longer mechanical overstimulation. The averaged trendlines reflect data from 13 bundles (6 sacculi). Error bands represent the SDs of data points in a 1 s moving window.
- Figure 4.
Stimulation of efferent neurons provokes an immediate crossover from the quiescent state back to the oscillatory regime. Position traces of four example hair cells recovering from mechanical overstimulation (20 s OD) with concurrent efferent actuation (A) illustrate hair bundles in an oscillatory state despite the large positional offsets. Analogous recordings obtained without concurrent efferent actuation (C) show an initial quiescent interval. B, D, Flattening the traces in A and C, respectively, confirms that a high-amplitude mechanical deflection does not halt oscillatory motion when the efferents are simultaneously activated. Each of the four bundles originated from a distinct sacculus, shown in different colors and offset for clarity. All traces corresponding to the same hair cell are displayed in the same color.
- Figure 5.
Different intervals of efferent stimulation distinctly affect a hair bundle’s oscillation profile as it recovers from mechanical overstimulation. A, A series of traces are shown of recordings from a hair cell undergoing a combination of mechanical overstimulation and efferent actuation. Each trace depicts hair bundle motion following 20 s of large-amplitude mechanical deflection combined with the efference paradigm indicated on the right. The efferents are not actuated in protocol 0, and thus protocol 0 is treated as the control condition against which comparisons are made. In protocol 1, the efferent neurons are activated before, during, and after the mechanical overstimulation for a total of 60 s. Protocol 2, protocol 3, and protocol 4 present efferent modulation exclusively before, during, or after the mechanical overstimulation, respectively. The recording order is from bottom to top. A portion of the observed hair bundles exhibit oscillatory motion immediately on probe release. B, A series of flattened recovery traces corresponding to the traces in A is shown. Three, chronologically subsequent segments are displayed in the first (0–1 s), second (4–5 s), and third (9–10 s) panels. When efference is present during the hair bundle’s recovery (protocol 1 and protocol 4), the bundle’s oscillation profile is significantly altered. Scale bars in A are also applicable for B.
- Figure 6.
Efferent modulation exerts an effect on the quiescent interval observed before recovery of active oscillations. A, A distribution of quiescent times (Tq) across the five efference paradigms, obtained from recordings of 18 bundles across five sacculi, is shown. Bundles whose spontaneous oscillations exhibited “spiking” behavior generally had longer quiescent times and are specifically marked with gray squares. Data points from the same hair bundle are connected together. Efference paradigms that feature efferent activation during the postoverstimulation period (protocol 1 and protocol 4) displayed wider ranges of quiescent times, with seven bundles having their first oscillation occurring within 50 ms. The recordings were separated into three groups: hair bundles that display an immediate return to oscillation (B), those that display regular oscillations and are not immediately affected by efference (C), and bundles that exhibit spike-like motion (D). Box plots illustrate the distribution of quiescent times observed in each group.
- Figure 7.
Among the five efference paradigms, a clear difference can be observed between protocols with or without efferent activation during the hair bundle’s recovery. Time-series trendlines of instantaneous frequencies, amplitudes, and inferred MET channel open probabilities are plotted for the hair cell in Figure 5 (A, D, G) and another cell from a different sacculus (B, E, H). All trendlines were normalized by the specific bundle’s steady state value. The five efference paradigms (protocols 0, 1, 2, 3, 4) are plotted in red, gold, green, blue, and violet, respectively. Under protocol 1 and protocol 4, hair bundles return to the oscillatory regime with a higher frequency, lower amplitude, and smaller open probability than those in the three other protocols. Frequency, amplitude, and open probability trendlines with the same efference protocol were averaged together to obtain the mean normalized trendlines in C, F, I, respectively. The protocol 1 and protocol 4 mean open probability trendlines are initially shifted downwards with respect to the protocol 0 trendline (I), but proceed to gradually increase over time, in contrast to the relatively flat frequency (C) and amplitude (F) trendlines. The averaged trendlines reflect data from 18 bundles (5 sacculi). Error bands represent the SDs of data points in a 1 s moving window.
- Figure 8.
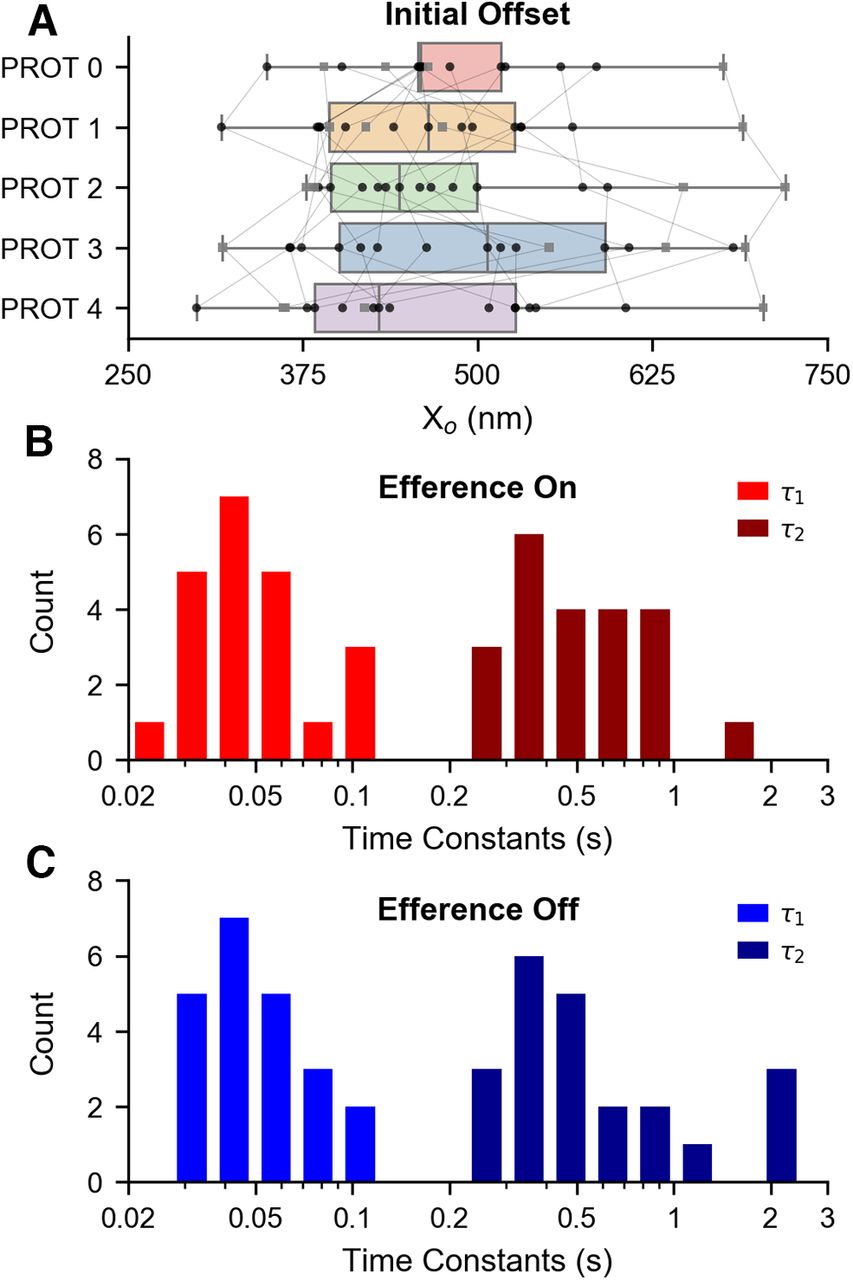
Actuation of the efferent neurons does not significantly affect the slow-component of a hair bundle’s recovery from mechanical overstimulation. A, Box plots illustrate the distribution of initial offsets (Xo) across the five efference paradigms. Bundles whose spontaneous oscillations exhibited “spiking” behavior are specifically marked with gray squares. Data points from the same hair bundle are connected together. There were no statistically significant differences in the mean initial offsets of the four protocols compared with the protocol 0 control. Thus, efferent modulation does not influence a hair bundle’s induced initial offset. Data points in A were obtained from recordings of 18 bundles across five sacculi. An extracted baseline was fitted to the sum of two exponentials, which yielded two time constants, τ1 and τ2 (


Tables
〈Tq〉 Δ w.r.t. PROT 0 One-tailed
paired t testt statistic p value Immediate oscillators PROT 0 0.49 ± 0.32 s — — — PROT 1 0.02 ± 0.01 s −0.47 ± 0.32 s t(4) = −3.31 p = 0.02* PROT 2 0.72 ± 0.59 s 0.23 ± 0.34 s t(4) = 1.53 p = 0.10 PROT 3 1.03 ± 0.88 s 0.54 ± 0.57 s t(4) = 2.09 p = 0.05 PROT 4 0.01 ± 0.01 s −0.48 ± 0.32 s t(4) = −3.35 p = 0.01* Unaffected regular PROT 0 0.38 ± 0.14 s — — — PROT 1 0.47 ± 0.21 s 0.10 ± 0.15 s t(8) = 1.81 p = 0.06 PROT 2 0.47 ± 0.38 s 0.09 ± 0.44 s t(8) = 0.62 p = 0.28 PROT 3 0.54 ± 0.22 s 0.17 ± 0.27 s t(8) = 1.77 p = 0.06 PROT 4 0.39 ± 0.25 s 0.01 ± 0.20 s t(8) = 0.16 p = 0.44 Spiking PROT 0 1.82 ± 0.96 s — — — PROT 1 1.86 ± 1.16 s 0.04 ± 0.22 s t(3) = 0.41 p = 0.35 PROT 2 3.87 ± 2.18 s 2.05 ± 1.65 s t(3) = 2.48 p = 0.05 PROT 3 3.87 ± 3.10 s 2.05 ± 2.16 s t(3) = 1.91 p = 0.08 PROT 4 2.35 ± 1.74 s 0.53 ± 0.87 s t(3) = 1.23 p = 0.15 Each subset of hair bundle response to simultaneous efferent actuation and mechanical overstimulation was separately analyzed (Fig. 6B–D), and the quiescent time (Tq) averages of each efference protocol are listed in the
〈Xo〉 Δ w.r.t. PROT 0 One-tailed
paired t testt statistic p value Immediate oscillators PROT 0 495.16 ± 39.30 nm — — — PROT 1 493.41 ± 59.89 nm −1.75 ± 46.53 nm t(4) = −0.08 p = 0.47 PROT 2 476.20 ± 62.06 nm −18.96 ± 27.12 nm t(4) = −1.56 p = 0.10 PROT 3 496.99 ± 111.24 nm 1.83 ± 83.30 nm t(4) = 0.05 p = 0.48 PROT 4 486.40 ± 93.85 nm −8.76 ± 80.25 nm t(4) = −0.24 p = 0.41 Unaffected regular PROT 0 461.59 ± 65.51 nm — — — PROT 1 432.71 ± 69.80 nm −28.88 ± 68.36 nm t(8) = −1.19 p = 0.14 PROT 2 448.08 ± 61.84 nm −13.51 ± 61.35 nm t(8) = −0.62 p = 0.28 PROT 3 470.51 ± 87.07 nm 8.92 ± 89.07 nm t(8) = 0.28 p = 0.39 PROT 4 446.46 ± 71.17 nm −15.13 ± 42.97 nm t(8) = −1.00 p = 0.18 Spiking PROT 0 491.16 ± 109.77 nm — — — PROT 1 494.64 ± 116.28 nm 3.47 ± 30.75 nm t(3) = 0.23 p = 0.42 PROT 2 531.89 ± 153.83 nm 40.73 ± 108.94 nm t(3) = 0.75 p = 0.25 PROT 3 548.70 ± 142.36 nm 57.54 ± 99.79 nm t(3) = 1.15 p = 0.17 PROT 4 461.80 ± 141.97 nm −29.36 ± 47.56 nm t(3) = −1.23 p = 0.15 The average initial offsets after mechanical overstimulation were comparable for all of the efference stimulus paradigms (Fig. 8A). The hair bundles were subdivided and further analyzed. The mean initial offsets of the three subcategories are shown in the
In this issue


