

Article Figures & Data
Figures
- Figure 1.
Isolating the LP neuron. A, Schematic of the STNS (top) and the simplified pyloric network with electrodes to indicate which neurons were recorded from (bottom). Modulatory projection neurons are located in the commissural ganglia (CoG) and esophageal ganglion (OG) and project via the stn to the neurons in the STG. Neurons of the pyloric network are located in the STG. The network consists of a pacemaker group (one AB and two PD neurons), and several follower neurons, of which only the LP neuron provides direct chemical feedback to the pacemaker group. Chemical inhibitory synapses and their transmitters (glutamate or acetylcholine) are shown as circles, electrical coupling is depicted with resistor symbols. B–D, Extracellular recordings of the lvn and pdn, which carry axons of both LP (largest unit on lvn) and PD neurons (mid-sized units on lvn), or only of PD neurons, respectively, and intracellular recordings of LP and the two copies of PD. B, When the preparation is intact (all intrinsic neuromodulators present), the LP neuron receives strong periodic inhibition from the pacemaker group. C, After decentralization (removal of intrinsic neuromodulators by transecting the stn), the pyloric rhythm deteriorates but synaptic connections are still functional as illustrated by LP inhibition during PD bursts, and IPSPs in PD for each LP spike. D, After the addition of 10−5 m PTX, glutamatergic synapses between the pacemaker group and LP are blocked. The cholinergic synapse from PD to LP is still functional. When PDs are hyperpolarized (traces clipped), this synapse is silenced. Recordings in all three panels are from the same experiment and, with exception of the inset in B, on the same voltage scale.
- Figure 2.
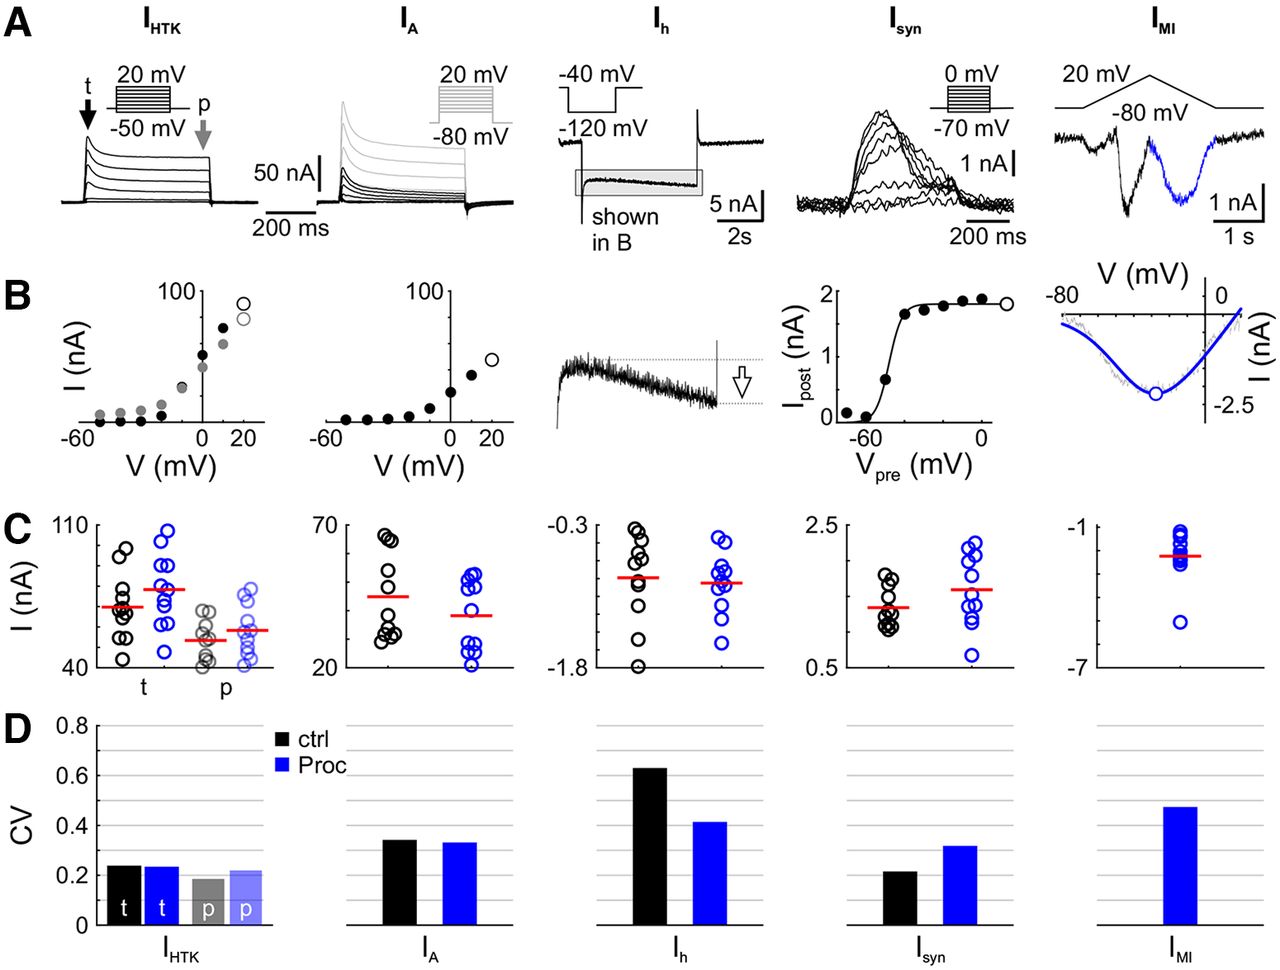
Variability of modulated components is not different from nonmodulated components across individuals. A, Example voltage-clamp recordings for nonmodulated and modulated currents. Current traces for IHTK [transient (t) portion indicated by black arrow, persistent (p) by gray arrow], IA (with total potassium currents IK as gray overlay; IA is the difference current between all potassium currents IK and IHTK); Ih; the synaptic current Isyn from PD to LP; and the neuromodulator-activated, voltage-gated current IMI are shown with the corresponding voltage-clamp protocol as the inset. B, From these voltage traces, the features indicated with white markers were extracted: the maximum transient current for both potassium currents and additional the persistent current for IHTK, the amplitude of the current at the end of the hyperpolarizing voltage step for Ih; the scaling factor for the sigmoid fit for Isyn; and the maximum inward current of the current fit for IMI. C, The distribution of these parameters across experiments are shown. Each dot represents one experiment, and red lines mark the mean. Black is for control (decentralized), blue is for Proc. Transient IHTK is shown in bold colors, persistent in transparent colors. Since IMI is calculated as a difference current (Proc – ctrl), there are no data in control. D, Coefficients of variation (SD/mean) are in the same range for the nonmodulated currents (IHTK, IA, Ih) and modulated currents (Isyn, IMI).
- Figure 3.
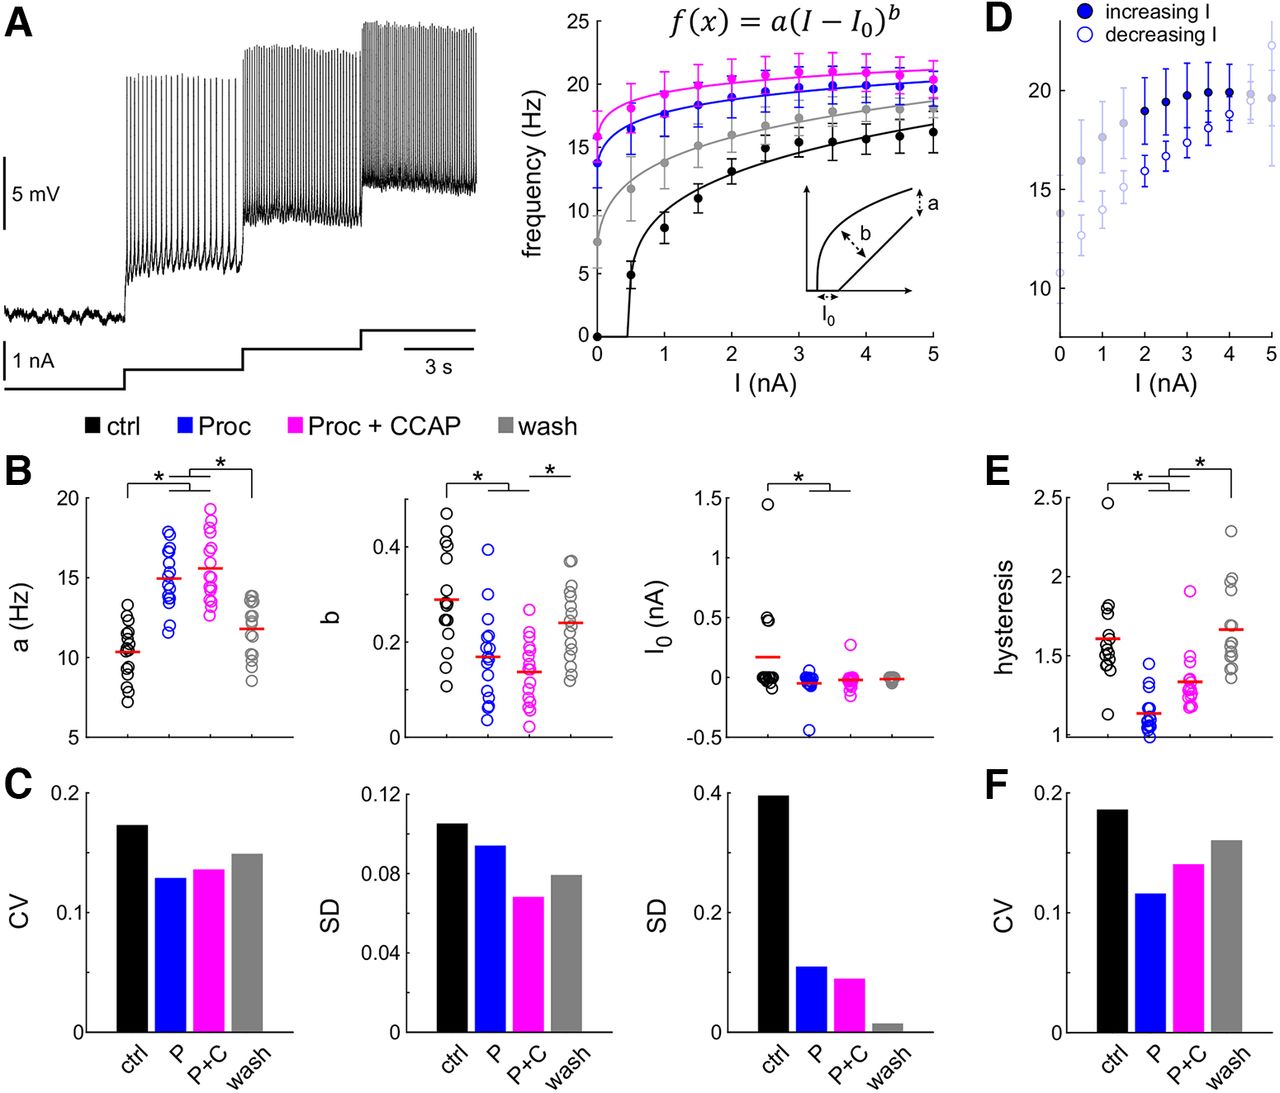
Neuromodulation changes excitability and reduces interindividual variability. A, Example of f – I relationships in four modulatory conditions (black: control; blue: Proc; magenta: Proc + CCAP; gray: wash). Left panel: Intracellular recording at four levels of increasing current injection in control condition. Right panel: Instantaneous spike frequencies at each current level in different neuromodulatory states, shown as the average with SD, were fitted with a power function. The left inset shows how the fit parameters influence the appearance of the curve. B, Distribution of fit parameters. Each dot represents the value from one experiment, and red lines indicate means. Application of one (blue, Proc) or two (magenta, Proc + CCAP) neuromodulators significantly changed parameters (asterisks). C, Application of one or two neuromodulators reduced the variability of the fit parameters compared with control (black). D, f – I curves showed hysteresis depending on in creasing (filled circles) or decreasing (open circles) levels of current injection. Only frequencies between 2 and 4 nA current injection (bold symbols) were used to calculate hysteresis as the ratio between increasing and decreasing current levels. E, Distribution of hysteresis across experiments. Application of one or two neuromodulators significantly changed hysteresis (asterisks). F, Application of one or two neuromodulators reduced the variability of hysteresis compared with control (black). Removing the outlier in control (i.e., the maximum value), for both hysteresis and I0, did not change the statistical significances. Control data for this figure are shown in Extended Data Figure 3-1. Raw data for B and E are provided in Extended Data Figure 3-2.
- Figure 4.
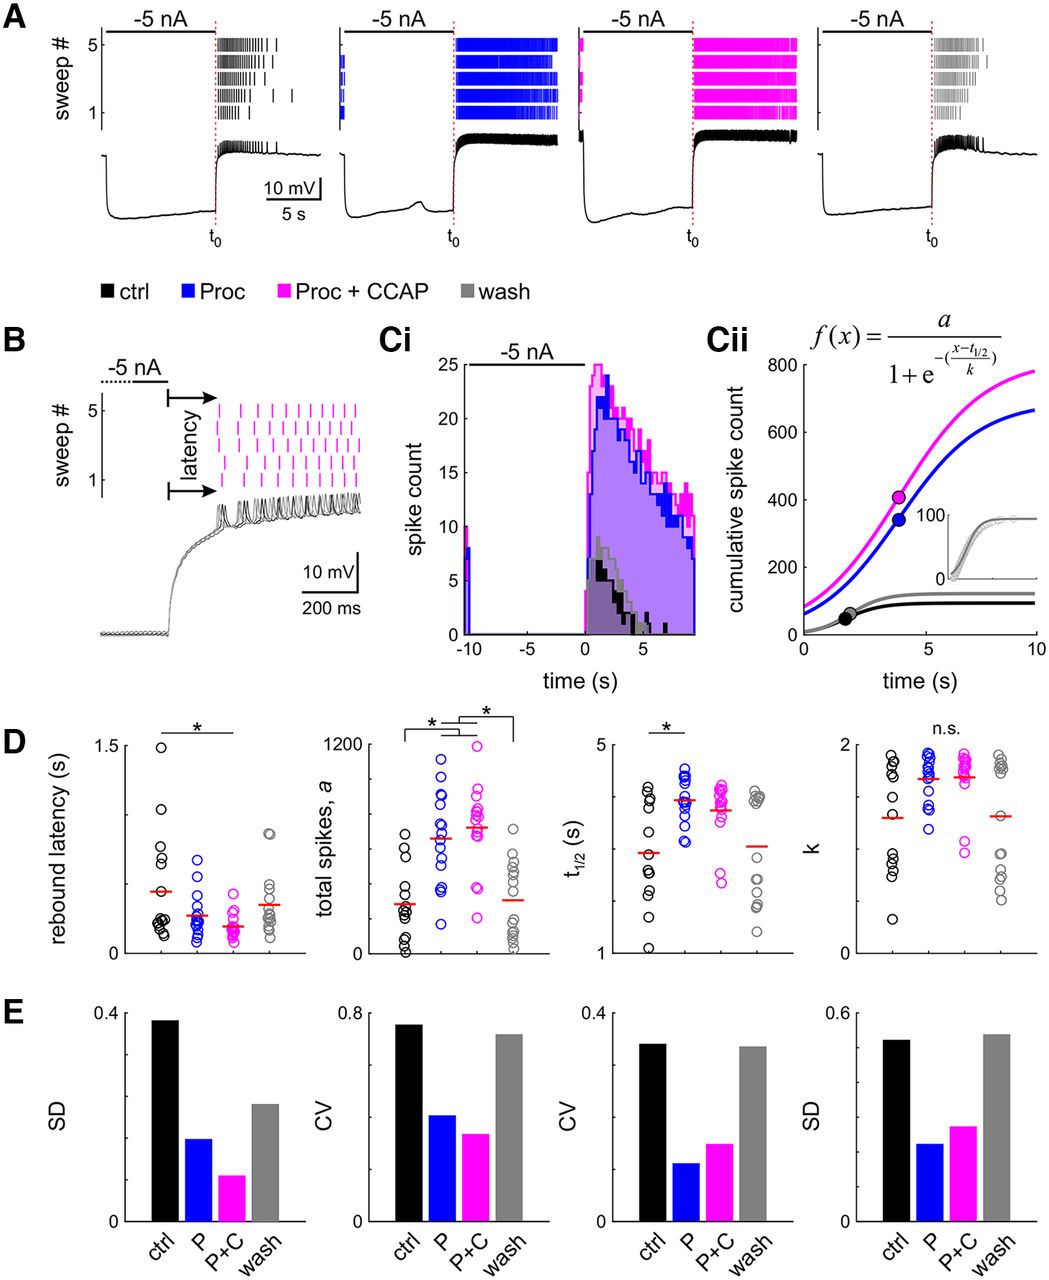
Neuromodulation changes general rebound properties and reduces interindividual variability. A, Spike raster and intracellular recording of the last of the five sweeps of one example experiment in four modulatory conditions (black: control; blue: Proc; magenta: Proc + CCAP; gray: wash). B, Latency was measured as the time from the end of the hyperpolarizing current injection to the first spike, averaged across all five sweeps. Sweeps of the intracellular recording are shaded in gray, from dark to light for sweeps 1–5. C, Spike histogram (Ci, 200 ms bin size) and sigmoid fit to the cumulative spike histogram (Cii). Dots indicate sigmoid midpoint. A–C are from the same experiment. D, Parameter distribution for latency and fit parameters; t1/2 is relative to the end of the current injection (A, t0). Dots represent individual experiments; the red line indicates the mean. Application of neuromodulators significantly (asterisks) changes most parameters (n.s.: ANOVA not significant). E, Variability of all parameters is reduced in the presence of neuromodulators. Control data for this figure are shown in Extended Data Figure 4-1. Raw data for D are provided in Extended Data Figure 4-2.
- Figure 5.
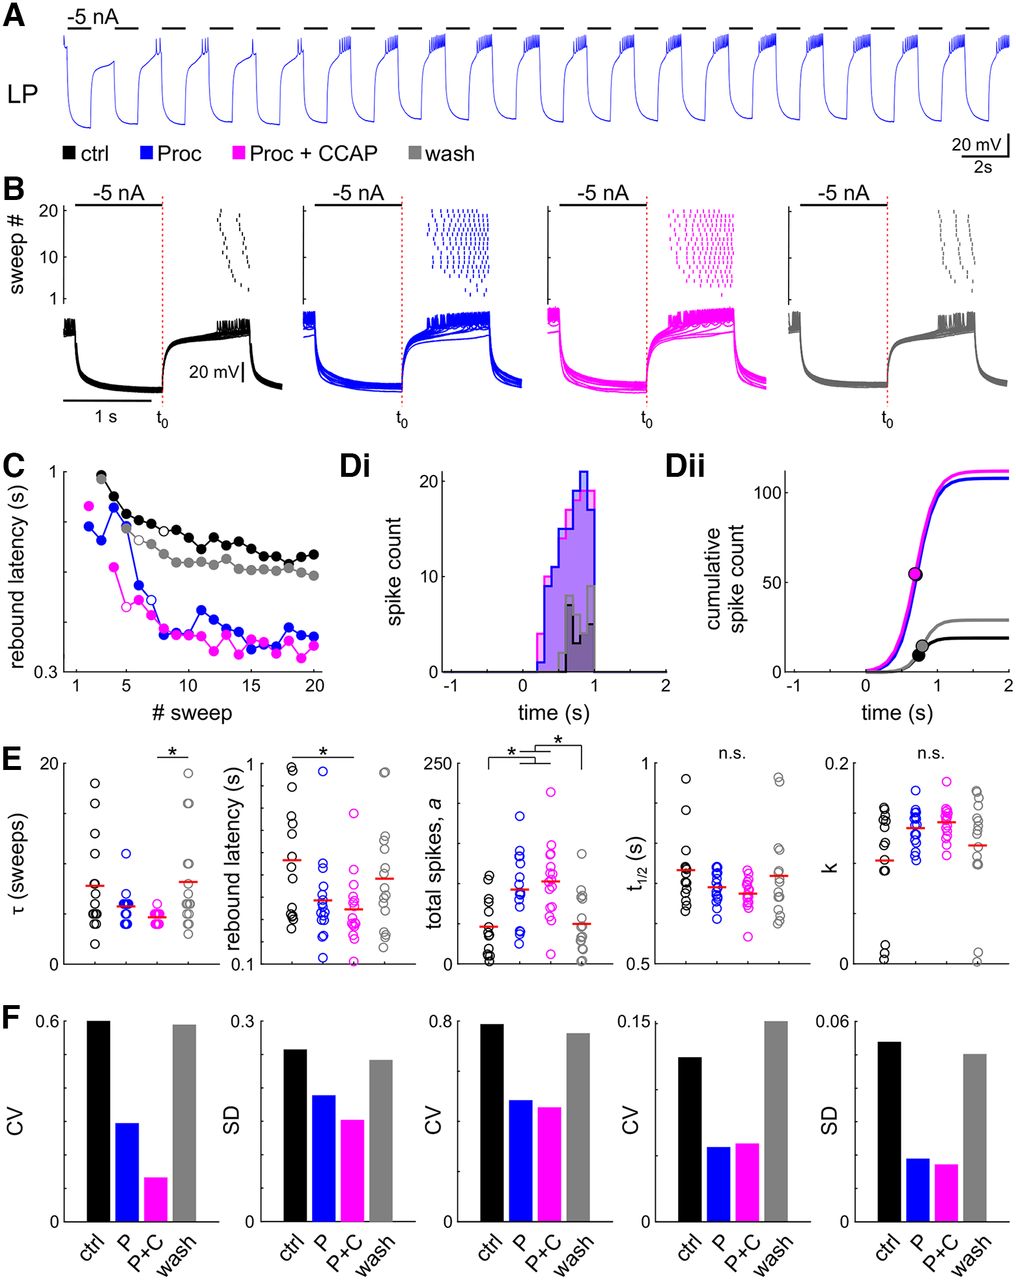
Neuromodulation changes steady-state rebound properties and reduces interindividual variability. A, Example intracellular recording of the LP neuron with 20 cycles of periodic inhibition. B, Spike raster and intracellular recording of all 20 sweeps of the same experiment in all four modulatory conditions (black: control; blue: Proc; magenta: Proc + CCAP; gray: wash). C, During the first sweeps the latency to the first spike successively decreased; therefore, we only included the last 10 sweeps (steady state) in the further analysis. The open circles indicate the sweep at which the latency was reduced to 63% of its total range. D, Spike histogram (Di, 100 ms bin size) and sigmoid fit to the cumulative spike histogram (Dii). Dots indicate sigmoid midpoint. A–D are from the same experiment. E, Parameter distribution for latency and fit parameters; t1/2 is relative to the end of current injection (B, t0). Dots represent individual experiments; the red line indicates the mean. Application of neuromodulators significantly changes parameters. F, Variability of all parameters is reduced in the presence of neuromodulators. Control data for this figure are shown in Extended Data Figure 5-1. Raw data for E are provided in Extended Data Figure 5-2.
- Figure 6.
Increasing
- Figure 7.
Increasing gMI in a family of LP models reduces the variability of f–I parameters. A, Schematic of the right shift of
- Figure 8.
Increasing excitability in a family of LIF models partially reduces the variability of f–I parameters. A, f–I curves for a family of 500 LIF models at three different Δ


Tables
m∞ τm h∞ τh Soma/Neurite IA m2h 2 50 ICa m2h Ih m IK(Ca) mh 25 IMI m 5 Axon INa m3h 1 2.5 IK m4 S(x) denotes the logistic sigmoid function 1/(1 + exp(–x)). Time constants are in milliseconds.
Parameter Value Cm 0.1 μF Iapp [−50:100] nA gleak Uniform distribution [0.05, 0.2) μS Eleak −60 mV gMI-L 0, 0.2, 0.36 μS EMI 10 mV vth −40 mV vreset −80 mV N Parameter Normality Variance Test statistic df res p ctrl Proc Proc + CCAP Wash 16 a pass pass F = 28.703 3 60 <0.001 10.346 14.947 15.583 11.790 16 b pass pass F = 9.805 3 60 <0.001 0.289 0.167 0.137 0.240 16 I0 fail H =11.289 3 0.01 0.000 −0.020 −0.026 −0.013 16 hysteresis fail H = 40.453 3 <0.001 1.554 1.092 0.128 1.581 “N” is the number of animals, results from tests for normality and equal variance is given as pass/fail, the test statistics are F for ANOVA and H for ANOVA on ranks, and “res” is the residuals. Significant p-values (p ≤ 0.05) are printed in bold. Values for ctrl, Proc, Proc + CCAP, and wash are means for ANOVA, and medians for ANOVA on ranks.
N Parameter Normality Variance Test statistic df res p ctrl Proc Proc + CCAP Wash 16 Log latency Pass Pass F = 3.675 3 60 0.017 −1.097 −1.444 −1.725 −1.208 16 a Pass Pass F = 14.937 3 58 <0.001 283.857 659.188 722.063 306.063 16 t1/2 Pass Fail H = 10.337 3 0.016 2.741 3.901 3.899 3.349 16 k Fail H = 6.709 3 0.082 1.415 1.730 1.780 1.522 “N” is the number of animals, results from tests for normality and equal variance is given as pass/fail, the test statistics are F for ANOVA and H for ANOVA on ranks, and “res” is the residuals. Significant p-values (p ≤ 0.05) are printed in bold. Values for ctrl, Proc, Proc + CCAP, and wash are means for ANOVA, and medians for ANOVA on ranks. Latency was bounded by experimental design between 0 and 10; therefore, we logarithmically transformed the data to a normal distribution and did the statistics on the log-transformed data.
N Parameter Normality Variance Test statistic df res p ctrl Proc Proc + CCAP Wash 16 τ Fail H = 10.310 3 0.016 6 6 5 6 16 arctan (latency*π) Pass Pass F = 3.124 3 59 0.033 0.996 0.831 0.786 0.919 16 a Pass Pass F = 7.623 3 58 <0.001 46.286 92.563 102.688 49.813 16 t1/2 Fail H = 3.791 3 0.285 0.714 0.690 0.678 0.691 16 k Fail H = 5.115 3 0.164 0.119 0.138 0.144 0.131 “N” is the number of animals, results from tests for normality and equal variance are given as pass/fail, the test statistics are F for ANOVA and H for ANOVA on ranks, and “res” is the residuals. Significant p-values (p ≤ 0.05) are printed in bold. Values for ctrl, Proc, Proc + CCAP, and wash are means for ANOVA, and medians for ANOVA on ranks. Latency was bounded between 0 and 1 by experimental design. Therefore, we transformed the data to a normal distribution by multiplying by π and calculating the arctangent.
Figure 3-1
f–I relationships with sham applications of neuromodulators. One example experiment. A, Increasing current application (indicated by arrows). B, Decreasing current application (indicated by arrows). Download Figure 3-1, TIF file.
Figure 3-2
Raw data shown in Figure 3, B and E. Download Figure 3-2, XLS file.
Figure 4-1
Rebound with sham applications of neuromodulators. One example experiment. A, Spike raster and corresponding intracellular recordings for all five sweeps. B, Spike histogram and sigmoid fit to the cumulative spike histogram. Dots indicate sigmoid midpoint. Download Figure 4-1, TIF file.
Figure 4-2
Raw data shown in Figure 4D. Download Figure 4-2, XLS file.
Figure 5-1
Periodic rebound with sham applications of neuromodulators. One example experiment. A, Spike raster and corresponding intracellular recordings for all 20 sweeps. B, Spike histogram and sigmoid fit to the cumulative spike histogram. Dots indicate sigmoid midpoint. Download Figure 5-1, TIF file.
Figure 5-2
Raw data of the graph shown in Figure 5E. Download Figure 5-2, XLS file.
Extended Data 1
Supplementary Model code. Download Extended Data 1, ZIP file.
In this issue


