

Article Figures & Data
Figures
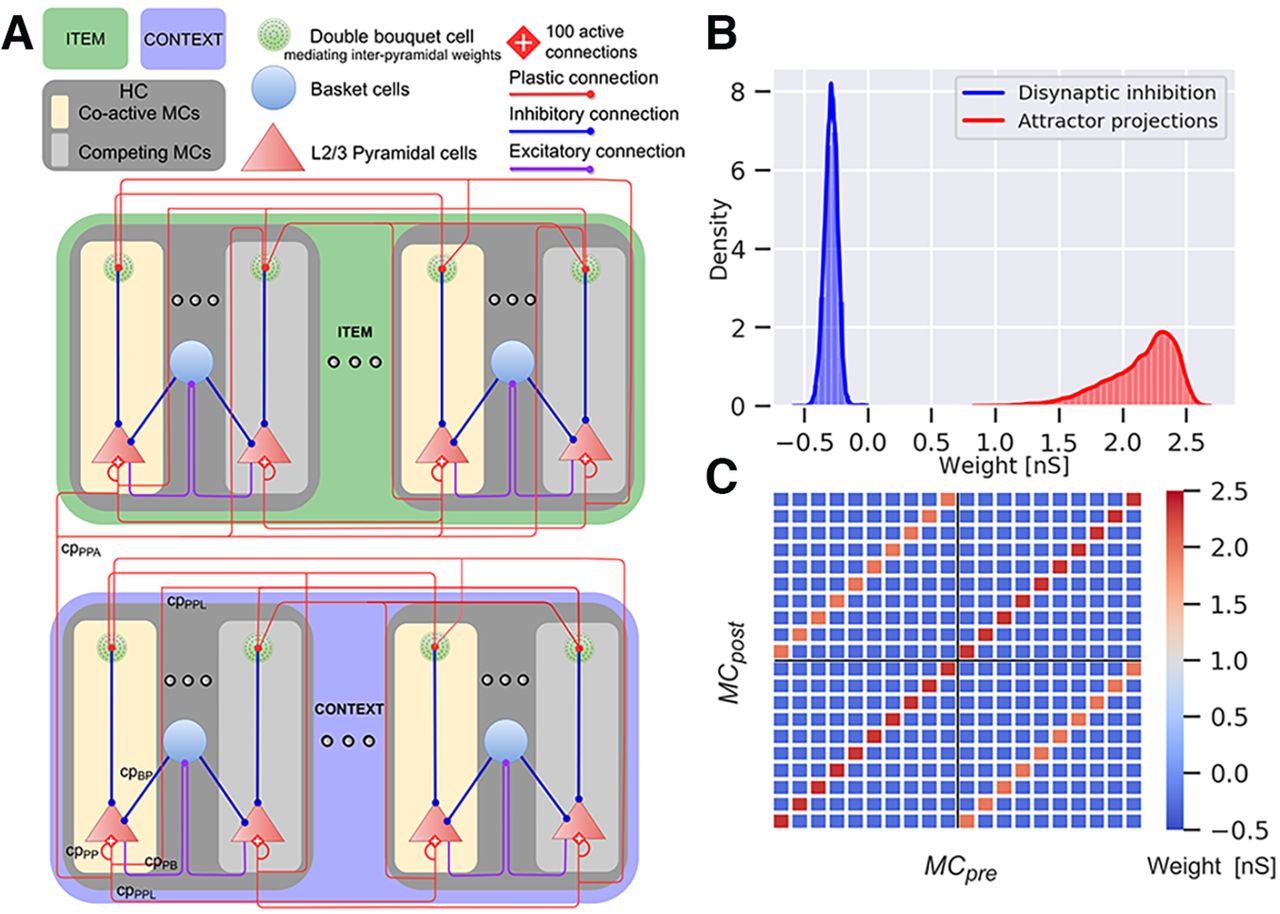
- Figure 1.
Network architecture and connectivity of the Item (green) and Context (blue) networks. A, The model represents a subsampled modular cortical layer 2/3 patch consisting of MCs nested in HCs. Both networks contain 12 HCs, each comprising 10 MCs. We preload abstract long-term memories of item and context representations into the respective network, in the form of distributed cell assemblies with weights establishing corresponding attractors. Associative plastic connections bind items with contexts. The network features lateral inhibition via basket cells (purple and blue lines) resulting in a soft winner-take-all dynamics. Competition between attractor memories arises from this local feedback inhibition together with disynaptic inhibition between HCs. B, Weight distribution of plastic synapses targeting pyramidal cells. The attractor projection distribution is positive with a mean of 2.1, and the disynaptic inhibition is negative with a mean of −0.3 (we show the fast AMPA weight components here, but the simulation also includes slower NMDA weight components). C, Weight matrix between attractors and competing MCs across two sampled HCs. The matrix displays the mean of the weight distribution between a presynaptic (MCpre) and postsynaptic MC (MCpost), within the same or different HC (black cross separates grid into blocks of HCs, only two of which are shown here). Recurrent attractor connections within the same HC are stronger (main diagonal, dark red) compared with attractor connections between HCs (off-diagonals, orange). Negative pyramidal-pyramidal weights (blue) between competing MCs amounts to disynaptic inhibition mediated by double bouquet cells.
- Figure 2.
Trial structure of the two simulated variants of the episodic memory task. Items are first associated with one or several contexts (CNX) during the encoding phase in 250-ms cue episodes, with an interstimulus interval of 500 ms. The colors of the coactivated contexts are consistent with their corresponding associated item. The recall phase occurs with a delay of 1 s and involves different trials with either brief cues (50 ms) of the (A) items or (B) contexts presented during the item-context association encoding phase.
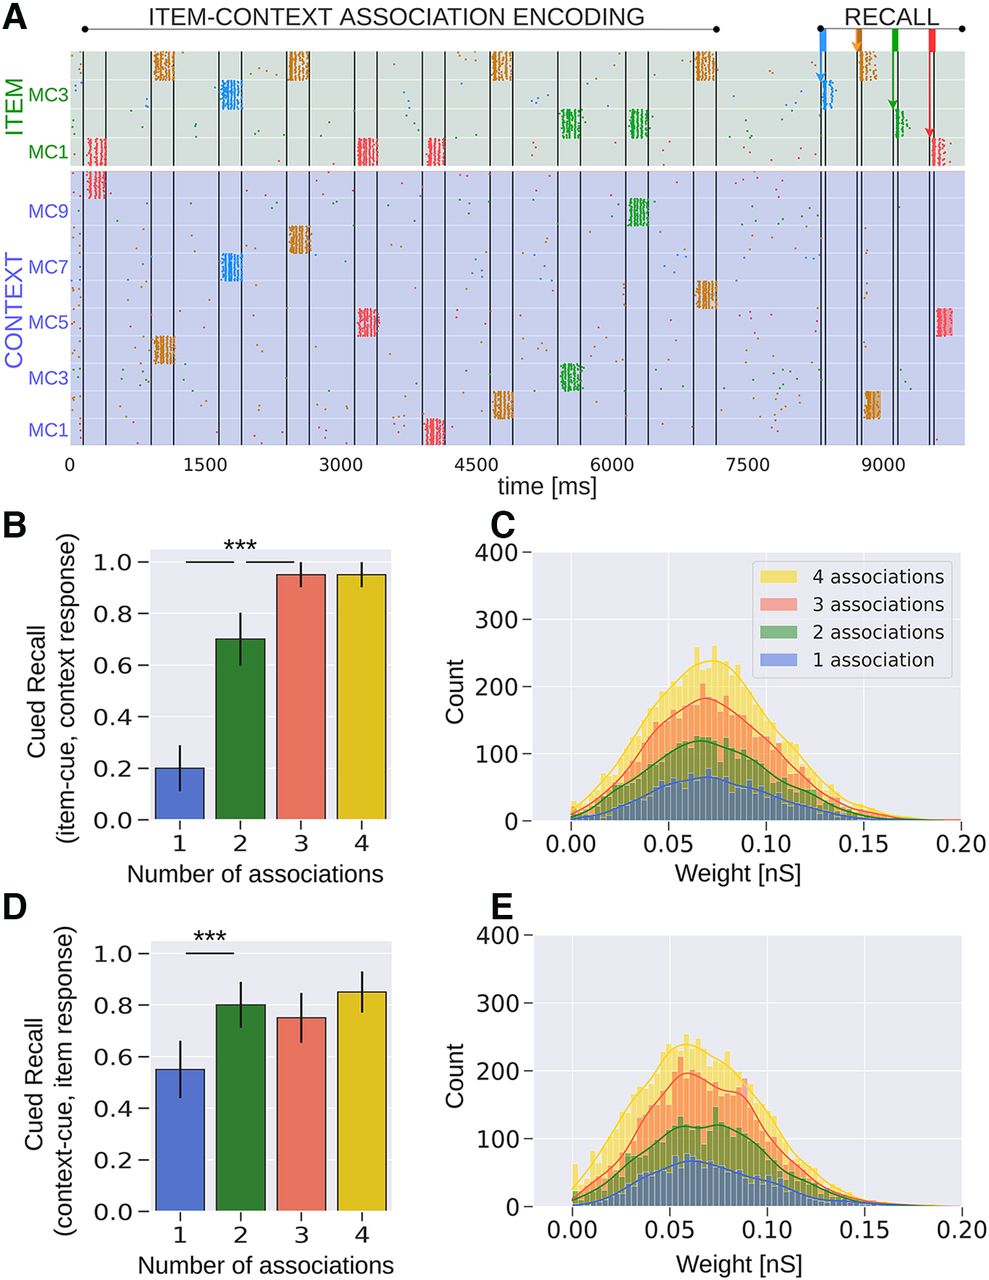
- Figure 3.
Semantization of episodic memory traces. A, Schematic of the Item (green) and Context (blue) networks. Attractor projections are long-range connections across HCs in the same network and learned associative projections are connections between networks. B, Spike raster of pyramidal neurons in HC1 of both the Item and Context networks. Each context/item memory pattern corresponds to the activation of a unique set of MCs in its network. Items and their corresponding context representations are simultaneously cued in their respective networks (compare Fig. 2A). Each item is drawn with a unique color, while contexts inherit their coactivated item’s color in the raster (i.e., the yellow pattern in the Item network is repeated over four different contexts, forming four separate associations marked with the same color). The testing phase occurs 1 s after the encoding. Brief 50-ms cues of already studied items trigger their activation. Following item activation, we detect evoked attractor activation in the Context network. C, Average cued recall performance in the Context network (20 trials). The bar diagram reveals progressive loss of episodic context information (i.e., semantization) over the number of context associations made by individual cued items (compare Fig. 2A). D, Distribution of plastic connection weights between the Item and Context networks (NMDA component shown here). Weights are noticeably weaker for items which participate in multiple associations. The distributions of synaptic weights exhibit a broader range for the items with multiple context associations, as the sample size is larger. The inset displays the distribution of EPSPs for the binding between Item and Context networks. The EPSP distributions follow the trend of the associative weights. The amplitudes (<1 mV) are lower for higher context variability. E, The distribution of intrinsic excitability currents of pyramidal cells coding for specific context representations. The intrinsic excitability features similar distributions because each context is activated exactly once, regardless of whether the associated item forms multiple associations or not. F, Average cued recall performance in the Item network (20 trials). Decontextualization over the number of associations is also observed when we briefly cue episodic contexts instead (compare Fig. 2B). G, Distribution of strength of plastic connections from the contexts to their associated items. Analogously to D, synapses weaken once an item is encoded in another context. H, Intrinsic plasticity distribution of cells in the Item network. Intrinsic excitability distributions are higher for pyramidal cells coding for repeatedly activated items; ***p < 0.001 (Mann–Whitney, N = 20 in C, F). Error bars in C, F represent SDs of Bernoulli distributions. Distributions of one, two, three, and four associations in D, G, H show significant statistical difference (p < 0.001, Mann–Whitney, N = 2000).
- Figure 4.
Network model where associative projections are implemented using standard STDP synaptic plasticity. A, Spike raster of pyramidal neurons in HC1 of both the Item and Context networks. B, Average item-cued recall performance in the Context network (20 trials). Episodic context retrieval is preserved even for high context variability (as opposed to BCPNN; compare Fig. 3C). C, Distribution of NMDA receptor mediated synaptic weights between the item and context neural assemblies following associative binding. The distributions of item-context weights have comparable means at ∼0.065 nS regardless of how many context associations a given item forms. Bins merely display a higher count for the four-association case as the total count of associative weights is more extensive compared with items with fewer associations. D, Average cued recall performance in the Item network when episodic contexts are cued (20 trials). E, Distribution of NMDA component weights between associated context and item assemblies; ***p < 0.001 (Mann–Whitney, N = 20 in B, D). Error bars in B, D represent SDs of Bernoulli distributions.
- Figure 5.
Removal of the augmentation mechanism in the network model. A, Distribution of AMPA component weights of the Item network including synaptic augmentation. The multiplicative effect of synaptic augmentation on the consolidated items features stronger combined synaptic strength for items with higher context variability. Slower NMDA receptor weights follow a similar pattern. Weight distributions of one, two, three, and four associations have statistical difference (p < 0.001, Mann–Whitney, N = 2000). B, Distribution of AMPA component weights of the Item network after removing synaptic augmentation. C, Cued recall under STDP after removing synaptic augmentation. Average item-cued recall performance in the Context network (20 trials). To compensate for the removal of augmentation, we increased the stimulation rates and the synaptic gain eliciting comparable spiking activity. Error bars represent SDs of Bernoulli distributions.
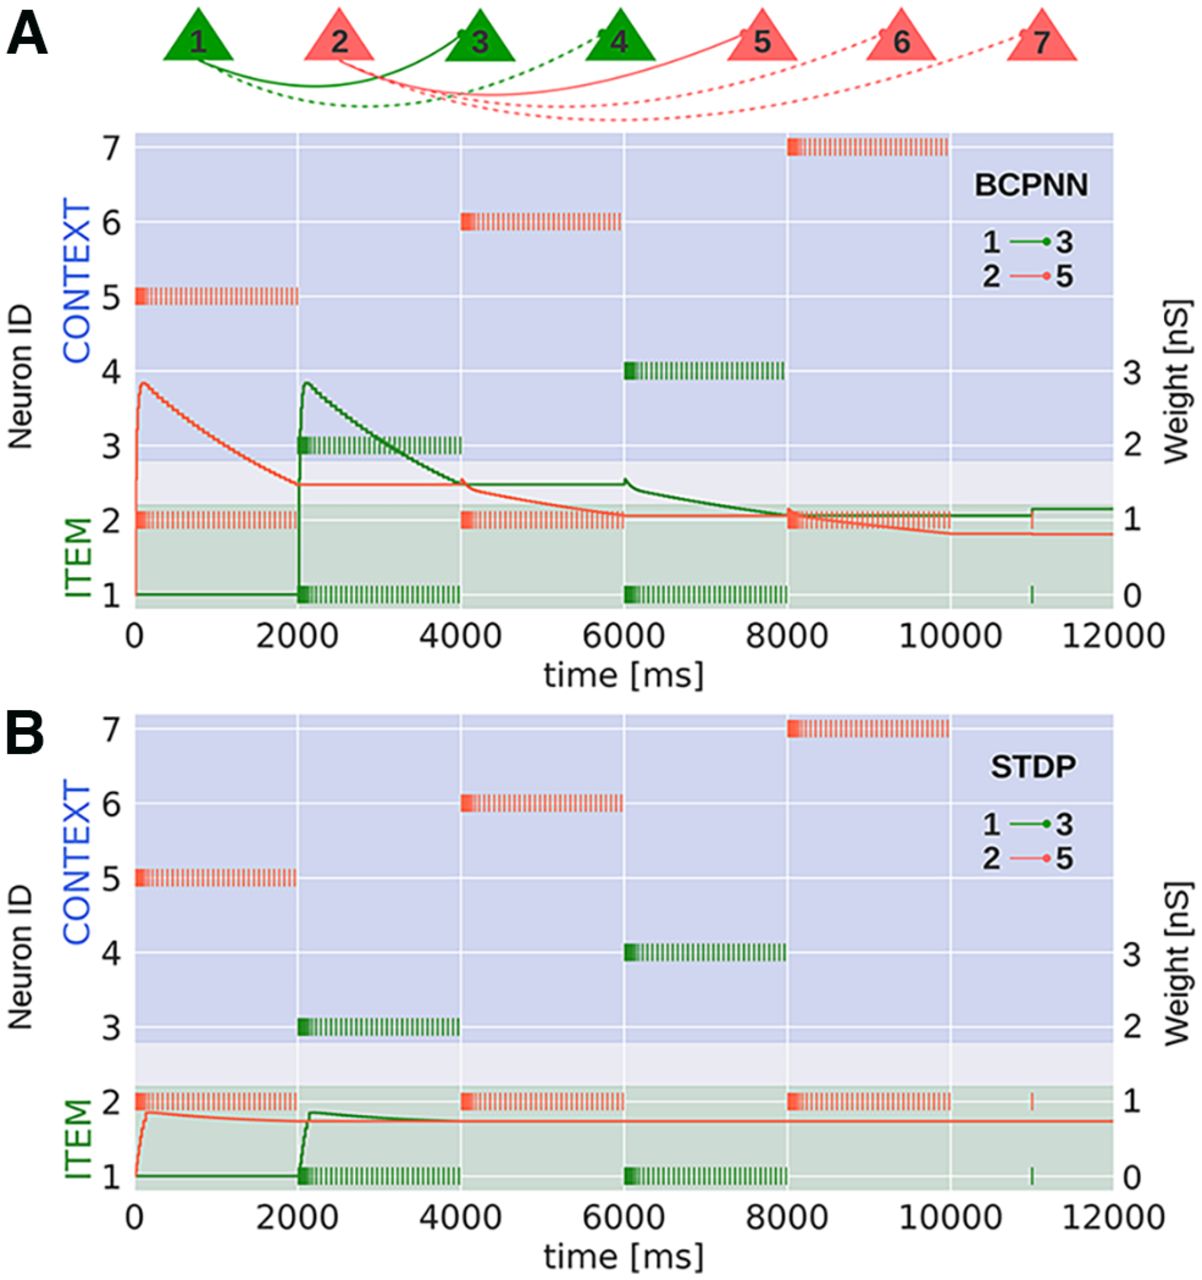
- Figure 6.
Continuous weight recordings in a microcircuit model with plastic synapses under the A, BCPNN or B, STDP learning rule. Neural and synaptic parameters correspond to those in the scaled model. In both cases, two item neurons (ID = 1,2) are trained to form two or three associations, respectively (dashed connections are simulated but their weight development is not shown here). During training, neurons are stimulated to fire at 20 Hz for 2 s. We display the developing synaptic weight between specific item-context pairs (ID = 1 and 3 in the 2-association scenario) and (ID = 2 and 5 in the 3-association scenario), and compare the converged weight values between the two-association and three-association case under both learning rules, following a final readout spike at 11 s.
- Figure 7.
Plasticity modulation of a specific item-context pair enhances recollection and counteracts semantization. A, Context recall performance. One of the pairs (context-E, item-1) presented in the episodic memory task (compare Fig. 2A) is subjected to enhanced plasticity during encoding, resulting in the boosted recall rate (3 associations, Normal vs Biased, 20 trial average). B, Individual context retrieval contribution in the overall recall (3 associations). Retrieval is similar among the three contexts since plasticity modulation is balanced (left: Normal, κ = κnormal; compare Table 1). However, when context-E is encoded with enhanced learning (with item-1), its recall increases significantly (right: Biased, κ = κboost; compare Table 1). C, Weight distributions of the NMDA weight component. Encoding item-1 with context-E under modulated plasticity yields stronger synaptic weights [3 association, α,β (light red, highly overlapping distributions) vs γ (dark red)]; ***p < 0.001 (Mann–Whitney, N = 20 in A, B, N = 2000 in C)]. Error bars in A, B represent SDs of Bernoulli distributions. Weight distributions of one, two, three-α,-β, and four associations in C show significant statistical difference (p < 0.001, Mann–Whitney, N = 2000).
- Figure 8.
Average cued recall performance in the Item network after sequentially cueing all the contexts that are associated with the item that forms four associations. A, Spike raster of pyramidal neurons in HC1 of both the Item and Context networks. The cue paradigm during test for the one-association, two-association, and three-association case remains identical to the control case (compare Fig. 2B). However, in particular for the four-association case, we sequentially cue all the four available contexts that share the same target item. B, Average cued recall performance in the Item network (20 trials). The bar diagram reveals progressive loss of item information over the number of context associations, but not for the four-association case at which all the available contexts were cued during test. Thus, providing more evidence via different sources boosts retrieval (∼95%) recovering a nearly decontextualized item (compare Fig. 3F, four associations, single cue, 25% accuracy score); ***p < 0.001 (Mann–Whitney, N = 20). Error bars represent SDs of Bernoulli distributions.


Tables
Neuron model parameter Symbol Value BCPNN parameter Symbol Value Adaptation current b 86 pA BCPNN AMPA gain 0.76 nS Adaptation decay time constant 280 ms BCPNN NMDA gain 0.07 nS Membrane capacitance Cm 280 pF BCPNN bias current gain βgain 40 pA Leak reversal potential EL −70.6 mV BCPNN lowest spiking rate fmin 0.2 Hz Leak conductance gL 14 nS BCPNN highest spiking rate fmax 25 Hz Upstroke slope factor ΔT 3 mV BCPNN lowest probability ϵ 0.0026 Spike threshold Vt −55 mV P trace time constant τp 15 s Spike reset potential Vr −60 mV Regular plasticity κnormal 1 Refractory period τref 5 ms Modulated plasticity κboost 2 Receptor parameter Symbol Value Short-term plasticity parameter Symbol Value AMPA synaptic time constant τAMPA 5 ms Utilization factor U 0.2 NMDA synaptic time constant τNMDA 100 ms Augmentation decay time constant τA 5 s GABA synaptic time constant τGABA 5 ms Depression decay time constant τD 280 ms AMPA reversal potential EAMPA 0 mV NMDA reversal potential ENMDA 0 mV GABA reversal potential EGABA −75 mV Parameter Symbol Value Weight initialization w0 0 nS AMPA maximum allowed weight 13.5 nS NMDA maximum allowed weight 3.5 nS Learning rate λ 0.01 Asymmetry parameter α 1.2 Weight dependence exponent, potentiation μ+ 1 Weight dependence exponent, depression μ– 1 Symmetric time window τ± 20 ms Layout Symbol Value Connectivity Symbol Value Stimulation Symbol Value Cortical patch size Cps 2.0 × 1.5 mm Axonal conduction speed V 0.2 m/s Background noise PYR (encoding) 650 Hz Simulated HCs (each network) nHC 12 Myelinated axonal speed Vmyel 2 m/s Background noise PYR (recall) 450 Hz Simulated MCs (each network) nMC 120 Minimal synaptic delay 1.5 ms Background noise BA 75 Hz Simulated MCs per HC 10 HC diameter dHC 0.5 mm Background conductance ± 1.5 nS Number of items nITEM 4 (from 10) Distance between networks 10 mm Stimulation duration tstim 250 ms Number of contexts nCONTEXT 10 (from 10) PYR-PYR recurrent cp cpPP 0.2 Stimulation rate rstim 500 Hz Layer 2/3 pyramidal per MC 30 PYR-PYR long-range cp cpPPL 0.25 Cue stimulation length tcue 50 ms Basket cells per MC 2 PYR-PYR associative cp cpPPA 0.02 Cue stimulation rate rcue 400 Hz MC grid size (Item + Context) 24 × 10 PYR-BA cp, BA-PYR cp cpPB, cpBP 0.7 Stimulation and cue conductance gstim +1.5 nS PYR-BA cc gPB 3 nS Interstimulus interval Tstim 500 ms BA-PYR cc gBP −7 nS Attractor detection threshold rth 10 Hz PYR, pyramidal cell; BA, basket cell; cp, connection probability; cc, connection conductance.
Extended Data 1
BCPNN_NEST_Module. Download Extended Data 1, ZIP file.
In this issue


