

Abstract
Adaptation plays an important role in sensory systems as it dynamically modifies sensitivity to allow the detection of stimulus changes. The vomeronasal system controls many social behaviors in most mammals by detecting pheromones released by conspecifics. Stimuli activate a transduction cascade in vomeronasal neurons that leads to spiking activity. Whether and how these neurons adapt to stimuli is still debated and largely unknown. Here, we measured short-term adaptation performing current-clamp whole-cell recordings by using diluted urine as a stimulus, as it contains many pheromones. We measured spike frequency adaptation in response to repeated identical stimuli of 2–10 s duration that was dependent on the time interval between stimuli. Responses to paired current steps, bypassing the signal transduction cascade, also showed spike frequency adaptation. We found that voltage-gated Na+ channels in VSNs undergo slow inactivation processes. Furthermore, recovery from slow inactivation of voltage-gated Na+ channels occurs in several seconds, a time scale similar to that measured during paired-pulse adaptation protocols, suggesting that it partially contributes to short-term spike frequency adaptation. We conclude that vomeronasal neurons do exhibit a time-dependent short-term spike frequency adaptation to repeated natural stimuli and that slow inactivation of Na+ channels contributes to this form of adaptation. These findings not only increase our knowledge about adaptation in the vomeronasal system, but also raise the question of whether slow inactivation of Na+ channels may play a role in other sensory systems.
Significance Statement
Most mammals use neurons of the vomeronasal organ for the detection of pheromones, but whether these neurons adapt to stimuli is still subject of debate. Here, we measured spike frequency adaptation to repeated identical pulses of urine. Surprisingly, we also found that adaptation also occurred when spiking activity was induced by current steps, bypassing the transduction cascade. Analysis of action potential machinery indicates that slow inactivation of Na+ channels contributes to short-term spike frequency adaptation to repeated stimuli.
Introduction
In sensory systems, the process of adaptation plays an important physiological role as it reduces the responsiveness to a stimulus, allowing the detection of additional variations in stimulus intensity. It often originates at the peripheral region of sensory systems, at the level of receptor cells, and further develops in the CNS (Torre et al., 1995; Wark et al., 2007; De Palo et al., 2012; Webster, 2012).
Chemosensory systems allow the organism to detect chemicals from the external world, and most mammals use at least two different olfactory systems: the main and the vomeronasal olfactory system. Pheromones are proteins or small molecules released from animals that affect the physiology and/or behavior of members of the same species (Wysocki et al., 1982; Tirindelli et al., 2009; Touhara and Vosshall, 2009; Brennan, 2010; Tirindelli, 2021). The vomeronasal system plays a very important role in the detection of pheromones and the regulation of several behaviors, including mating, care of pups, and aggressive and territorial behaviors (Wysocki et al., 1982; Stowers et al., 2002; Tirindelli et al., 2009; Touhara and Vosshall, 2009; Kaur et al., 2014; Mohrhardt et al., 2018; Tirindelli, 2021).
Pheromones and other natural ligands enter the vomeronasal organ (VNO) and contact receptors in vomeronasal sensory neurons (VSNs), bipolar neurons that have a dendrite ending in microvilli inside the lumen of the VNO and an axon projecting to the accessory olfactory bulb (AOB). Each VSN expresses one or a few types of G-protein-coupled receptors V1Rs, V2Rs, FPRs, and axons of VSNs expressing the same receptor project to various glomeruli in the AOB (Dulac and Axel, 1995; Herrada and Dulac, 1997; Matsunami and Buck, 1997; Liberles et al., 2009; Tirindelli et al., 2009; Francia et al., 2014; Tirindelli, 2021). Ligand binding activates a phospholipase C signaling cascade that leads to activation of transient receptor potential canonical 2 (TRPC2) channels allowing the influx of Na+ and Ca2+ and the subsequent activation of the Ca2+-activated Cl– channels TMEM16A and TMEM16B (Liman and Buck, 1994; Lucas et al., 2003; Dibattista et al., 2012; Amjad et al., 2015; Leinders-Zufall et al., 2018; Hernandez-Clavijo et al., 2021). Ligand binding also causes Ca2+ release from intracellular stores that may also directly activate Ca2+-activated Cl– channels (Kim et al., 2011). Currents induced by the transduction cascades in response to chemical stimuli generate membrane depolarization and action potentials that are sent to the AOB (Mohrhardt et al., 2018).
Although the process of adaptation in the main olfactory system has been extensively investigated both at the peripheral and central level, very little is known about adaptation in the vomeronasal system (Abbas and Vinberg, 2021; Brandão et al., 2021; Martelli and Storace, 2021). Indeed, adaptation in the vomeronasal organ has been the subject of some debate (Holy et al., 2000; Nodari et al., 2008; Spehr et al., 2009), but recent work showed additional evidence of adaptive responses of VSNs to natural stimuli (Silvotti et al., 2018; Wong et al., 2018). Repeated stimulations showed that VSNs present both short-term adaptation, in a time range of tens of seconds, and long-term adaptation, in a time range of tens of minutes (Wong et al., 2018).
In this study, we used current-clamp whole-cell recordings to investigate short-term adaptation by measuring the effect of a first stimulus on the spiking response elicited by a second identical stimulus repeated at different time intervals. We compared both responses to paired stimuli to diluted urine and to current steps, to bypass the transduction cascade. Furthermore, we analyzed the adaptation properties of voltage-gated channels independent of stimuli. We found that slow inactivation of Na+ channels in mouse VSNs contributes to spike frequency adaptation to repeated stimuli.
Materials and Methods
Animals and ethical approval
Mice were handled according to the guidelines of the Italian Animal Welfare Act (Decreto legislativo 26/2014) and European Union guidelines on animal research (2010/63) under a protocol approved by the Italian Ministry of Health. Mice had free access to water and food. Every effort was made to reduce the number of animals used. C57BL/6 mice (age range, 2–3 months) were anesthetized with CO2 and decapitated before removal of the VNO. Mice were transferred to a cage (height/width/length, 8 × 10 × 12 cm), and 100% CO2 was slowly injected into the cage until the animal stopped breathing and no longer displayed pedal reflex (near 3 min; gas flow rate, ∼20% of chamber volume/min).
Acute slices of mouse VNO
Acute slices of mouse VNO were prepared as previously described (Shimazaki et al., 2006; Dibattista et al., 2012; Wong et al., 2018; Hernandez-Clavijo et al., 2021). The VNO was removed and transferred to ice-cold artificial CSF (ACSF). The capsule and all cartilaginous tissues were removed with the help of the tip of fine forceps obtaining the two clean halves of the VNO. Each half was embedded in 3% low-grade agar (catalog #A7002, Sigma-Aldrich) prepared in ACSF, once the agar had cooled to 38°C. Upon solidification, the agar block was fixed in a glass Petri dish filled by ice-cold oxygenated ACSF solution and sliced with a vibratome (Vibratome 1000 Plus Sectioning System, Vibratome Company) at 200 μm. Slices were then left to recover for >30 min before electrophysiological experiments were initiated.
Electrophysiological recordings and solutions
Slices were viewed with an upright microscope (Zeiss Axioscope) with a water-immersion 40× objective (Olympus). The slice preparation maintained the VNO cross-sectional structure, and VSNs could be distinguished by their morphology. Patch pipettes, pulled from borosilicate capillaries (WPI) with a PC-10 puller (Narishige), had a resistance of 3–6 MΩ. Electrophysiological recordings were made using an Axopatch 200B amplifier controlled by Clampex 10 via a Digidata 1440A digitizer (Molecular Devices). Experiments were performed at room temperature (20–25°C). The recording chamber was continuously perfused by gravity flow with oxygenated (95% O2 and 5% CO2) ACSF containing the following (in mm): 120 NaCl, 20 NaHCO3, 5 KCl, 2 CaCl2, 1 MgSO4, 10 HEPES, and 10 glucose, pH 7.4. The slice was anchored to the base of the recording chamber using a home-made U-shaped silver wire, holding down the agar support without touching the slice itself.
For current-clamp recordings, the intracellular solution filling the patch pipette contained the following (in mm): 80 K-gluconate, 60 KCl, 2 Mg-ATP, 10 HEPES, and 1 EGTA, adjusted to pH 7.2 with KOH. Paired-pulse experiments were conducted at a 0 pA holding current with stimulus of variable duration (from 2 to 10 s) consisting in either diluted urine application or in 5 pA current steps. Interpulse intervals (IPIs) varied from 2 to 60 s. The time between independent sweeps was at least 2 min to avoid cumulative adaptation (Wong et al., 2018). Data were low-pass filtered at 2 kHz and sampled at 10 kHz.
Urine was collected from both sexes of BALB/c mice, filtered with a 0.2 μm filter, and frozen at −80°C for no more than 2 months. Before use, male and female urine samples were mixed in a 1:1 ratio, and the mixture was diluted to 1:50 in ACSF, pH 7.4. As mouse urine contains urea and K+, which could potentially cause neurons to fire by direct membrane depolarization, we used as a negative control artificial urine diluted to 1:50 in ACSF. Artificial urine contained the following (in mm): 100 NaCl, 40 KCl, 20 NH4OH, 4 CaCl2, 2.5 MgCl2, 15 NaH2PO4, 20 NaHSO4, and 333 urea, at pH 7.4 adjusted with NaOH (Holy et al., 2000; Wong et al., 2018; Hernandez-Clavijo et al., 2021). To test cell viability, we used a high-K+ solution (25 mm KCl) by replacing equimolar amounts of NaCl with KCl in ACSF. Urine, artificial urine, and high-K+ solutions were delivered through an 8-into-1 multibarrel perfusion pencil connected to a ValveLink8.2 pinch valve perfusion system (AutoMate Scientific). For each experiment, the response to high-K+ stimulation (Fig. 1) was used to evaluate the arrival of solution to the cell. We included in the dataset only neurons that fired in response to high-potassium solution and did not respond to artificial urine.

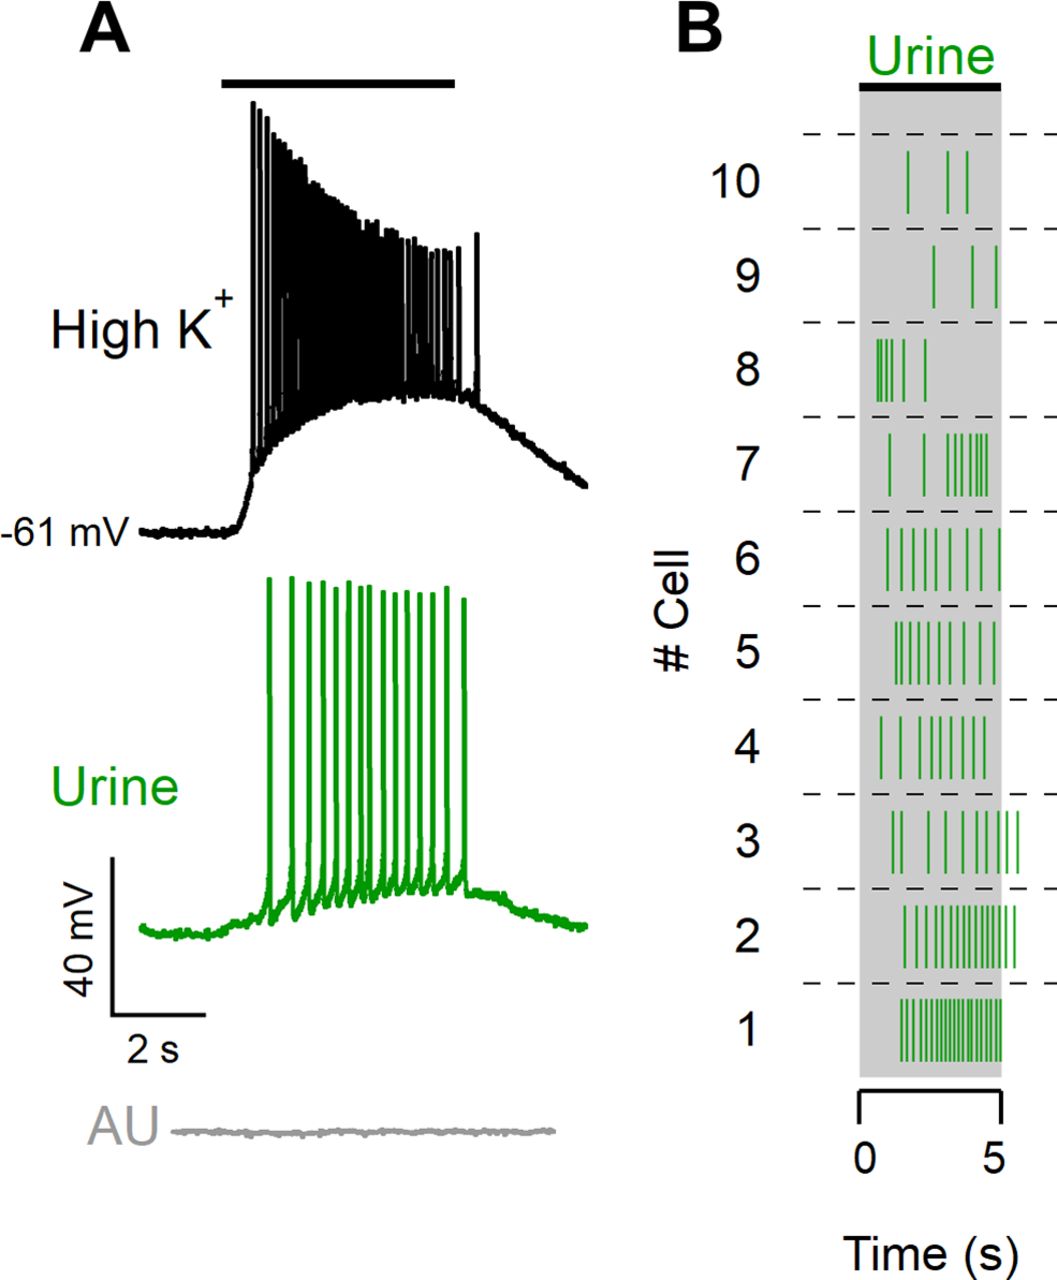
Diluted urine elicits spike activity in VSNs. A, Whole-cell current-clamp recordings from a VSN stimulated for 5 s with a high-K+ solution (25 mm KCl; black trace), diluted urine (1:50; green trace), or diluted artificial urine (1:50; gray trace). The black bar indicates the arrival of the solutions to the neuron based on the response to the high-K+ solution. B, Raster plot of urine responses of 10 different neurons stimulated for 5 s.
For voltage-clamp recordings, the intracellular solution filling the patch pipette contained the following (in mm): 135 CsCl, 5 NaCl, 10 HEPES, and 10 EGTA, adjusted to pH 7.2 with NaOH. CdCl2 (100 μm) was added to extracellular ACSF in all recordings, unless otherwise stated, to block Ca2+ channels. TTX (2 μm; LATOXAN) was used to block Na+ channels. Leakage and capacitive currents were subtracted. All compounds and chemicals were obtained from Sigma-Aldrich, unless otherwise stated.
Data analysis
IgorPro 6.7/8 software (WaveMetrics) was used for data analysis and figure preparation. Individual spikes were identified by a custom-written detection procedure and confirmed by shape inspection. Data are presented as the mean ± SD and the number of cells (n). The voltage-gated inactivation curves were fitted to the following Boltzmann equation: I/Imax = A + (1 – A)/(1+ exp((V – Vhalf)/k), where I is the peak sodium current, Imax the maximal peak sodium current, V is the membrane potential, Vhalf is the membrane potential at which I is half of Imax, k is the slope constant, and A is the asymptotic value. Statistical significance was determined using the following tests. The Shapiro–Wilk test was used to verify data normality. For normally distributed data, repeated measures ANOVA was used, followed by a paired t test with Bonferroni correction; while for data not normally distributed, statistical significance was determined using a Friedman’s test followed by a Demsar’s test. The p values associated with the Demsar’s test were calculated using the algorithm in R developed by Eisinga et al. (2017). A paired Dunnett’s test was used after ANOVA (see Fig. 8, data). A p value of <0.05 was considered statistically significant.
Results
We performed current-clamp whole-cell recordings from the soma of neurons in acute murine VNO slices. The recordings were performed from the soma of neurons located in the basal zone of the VNO; therefore, we expect that most of the recorded neurons expressed receptors of the V2R family (Herrada and Dulac, 1997; Matsunami and Buck, 1997; Ryba and Tirindelli, 1997). The average zero-current membrane potential was −65 ± 6 mV (range, −84 to −53 mV), and the average input resistance was 1.3 ± 0.5 GΩ (n = 34). We stimulated VSNs with a time-controlled flow of diluted mouse urine, which is very rich in natural ligands for vomeronasal receptors (Moss et al., 1997; Nodari et al., 2008; Tirindelli et al., 2009; Doyle et al., 2016), and recorded the evoked spiking activity (Fig. 1A, green trace). On the same neuron, we used a depolarizing high-K+ solution stimulus as a positive control to test the neuron viability and to determine the time of arrival of the solution on the neuron (Fig. 1A, black trace). Moreover, as urine contains K+, we also performed a control by applying diluted artificial urine (Fig. 1A, gray trace), a solution with salt composition similar to urine (Holy et al., 2000; Wong et al., 2018; Hernandez-Clavijo et al., 2021) and discarded neurons responding to artificial urine. In this way, we verified that spiking activity in response to urine was not because of changes in ion concentration. The raster plot in Figure 1B shows examples of responses to 5 s urine stimulation from 10 different VSNs.
VSNs show short-term spike frequency adaptation in response to repeated natural stimuli
To evaluate the time course of adaptation, we first applied a 5 s urine pulse followed by a second pulse of the same duration. As we have previously reported (Wong et al., 2018), we confirm that the number of spikes during the second pulse was smaller for short IPIs but recovered toward the value of the first pulse as the IPI increased (Fig. 2A,B). The recovery time between each paired pulse was at least 2 min. To quantify sensory adaptation and compare results from several neurons, we normalized the average firing frequency during the second pulse to the value during the first one (Fig. 2C) and found that spike frequency was significantly different at an IPI of 5 s (average frequency ratio, 0.72 ± 0.18; n = 10), whereas for longer IPIs of 10, 20, and 60 s, the frequency was not significantly different.
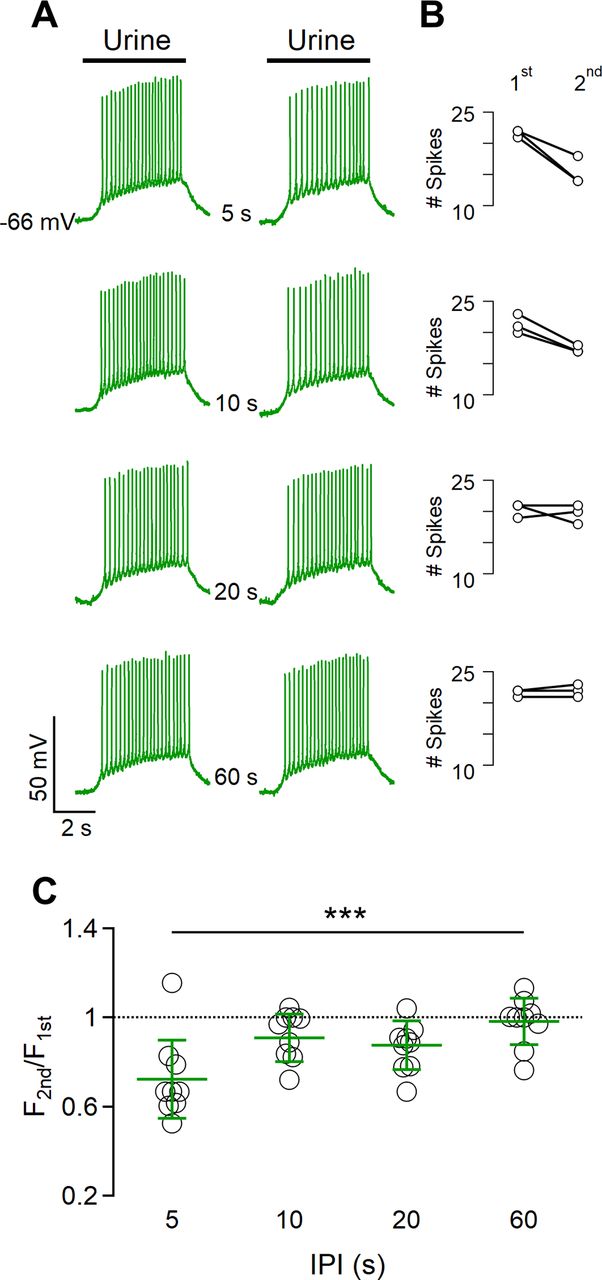
Spike frequency adaptation to repeated urine stimulations. A, Representative whole-cell current-clamp recordings from a VSN repetitively stimulated with diluted urine for 5 s with increasing intervals between pulses of 5, 10, 20, or 60 s, as indicated. Black bars at the top indicate the time of urine application. B, The number of spikes during the first and the second stimulation at the corresponding IPI is shown in the same row in A. The paired-pulse protocol was repeated three times in the same neuron. C, Scatter dot plot with the average ± SD of normalized spike frequency of the second stimulation with respect to the first stimulation for each IPI (n =10, Demsar’s test after Friedman test, p = 0.00029).
To further investigate the dependence of short-term adaptation on stimulus duration, we applied urine pulses of shorter (2 s) and longer (10 s) durations than 5 s (Fig. 3A,B). We found that repetitive urine stimuli of 2 s showed adaptation only at an IPI of 2 s (Fig. 3C). On the other hand, paired-pulse protocols with longer urine stimulations of 10 s resulted in spike frequency adaptation when IPIs of 2, 5, and 10 s were used (average frequency ratios: 0.68 ± 0.21 for 2 s; 0.79 ± 0.14 for 5 s; and 0.76 ± 0.2 for 10 s; n = 9; Fig. 3B,D).

The duration of urine stimulation affects the extent of spike frequency adaptation. A, B, Representative whole-cell current-clamp recordings obtained stimulating VSNs with diluted urine for 2 s (A) or 10 s (B), with increasing intervals between pulses of 2, 5, 10, 20, or 60 s, as indicated. Black bars indicate the time of urine application. C, D, Scatter dot plots with the average ± SD of normalized spike frequencies for each IPI for urine pulses of 2 s (C) or 10 s (D; for C: n = 9, Demsar’s test after Friedman test (p = 0.045 for IPI 2 s; for D: n = 6; paired t test with Bonferroni correction after ANOVA for repeated measurements: p = 0.018 for IPI 2 s; p = 0.008 for IPI 5 s; and p = 0.036 for IPI 10 s).
These results show that short-term adaptation in VSNs depends on the duration of urine stimulation as well as on IPI.
VSNs show short-term spike frequency adaptation to repeated current steps
To test whether short-term adaptation is because of the adaptation of components of the signal transduction cascade and/or to inactivation of voltage-gated channels involved in action potential generation, we stimulated VSNs with current steps instead of urine, thus inducing spiking activity while bypassing the activation of the signal transduction cascade.
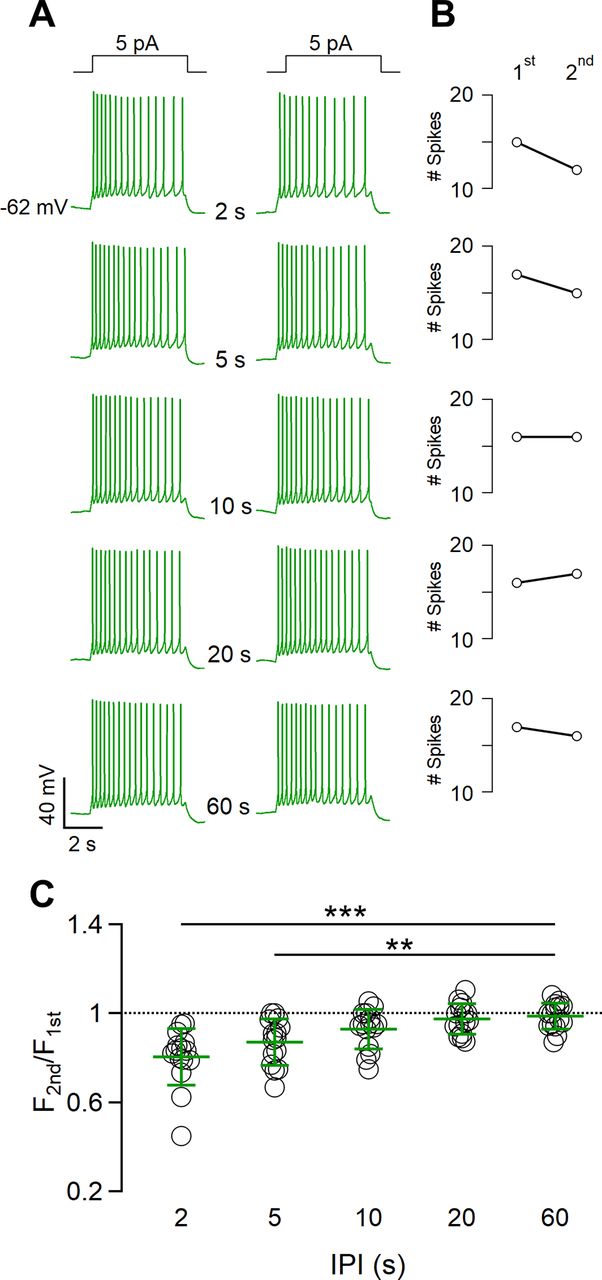
We applied depolarizing current injections of 5 pA, a value that is sufficient to generate action potentials but does not saturate spike frequency in VSNs (Liman and Corey, 1996; Shimazaki et al., 2006). We first stimulated VSNs with a current step lasting 5 s, followed by an identical stimulus at time intervals increasing from 2 to 60 s (Fig. 4A,B). Stimulation with paired current steps produced adaptation when IPIs of 2 and 5 s were used (average frequency ratios: 0.8 ± 0.03 for 2 s; 0.87 ± 0.03 for 5 s; n = 15).

VSNs show spike frequency adaptation in response to repeated current steps. A, Representative whole-cell current-clamp recordings of a VSN repetitively stimulated with a 5 pA current step for 5 s with increasing intervals between steps of 2, 5, 10, 20, or 60 s, as indicated. Steps at the top indicate the time of current injection. B, Number of spikes during the first and the second stimulation at the corresponding IPI shown in the same row in A. C, Scatter dot plot with the average ± SD of the normalized spike frequency of the second with respect to the first stimulation for each IPI (n = 15; Demsar’s test after Friedman test: p = 7.5 * 10–5 for 2 s; p = 0.006 for 5 s).
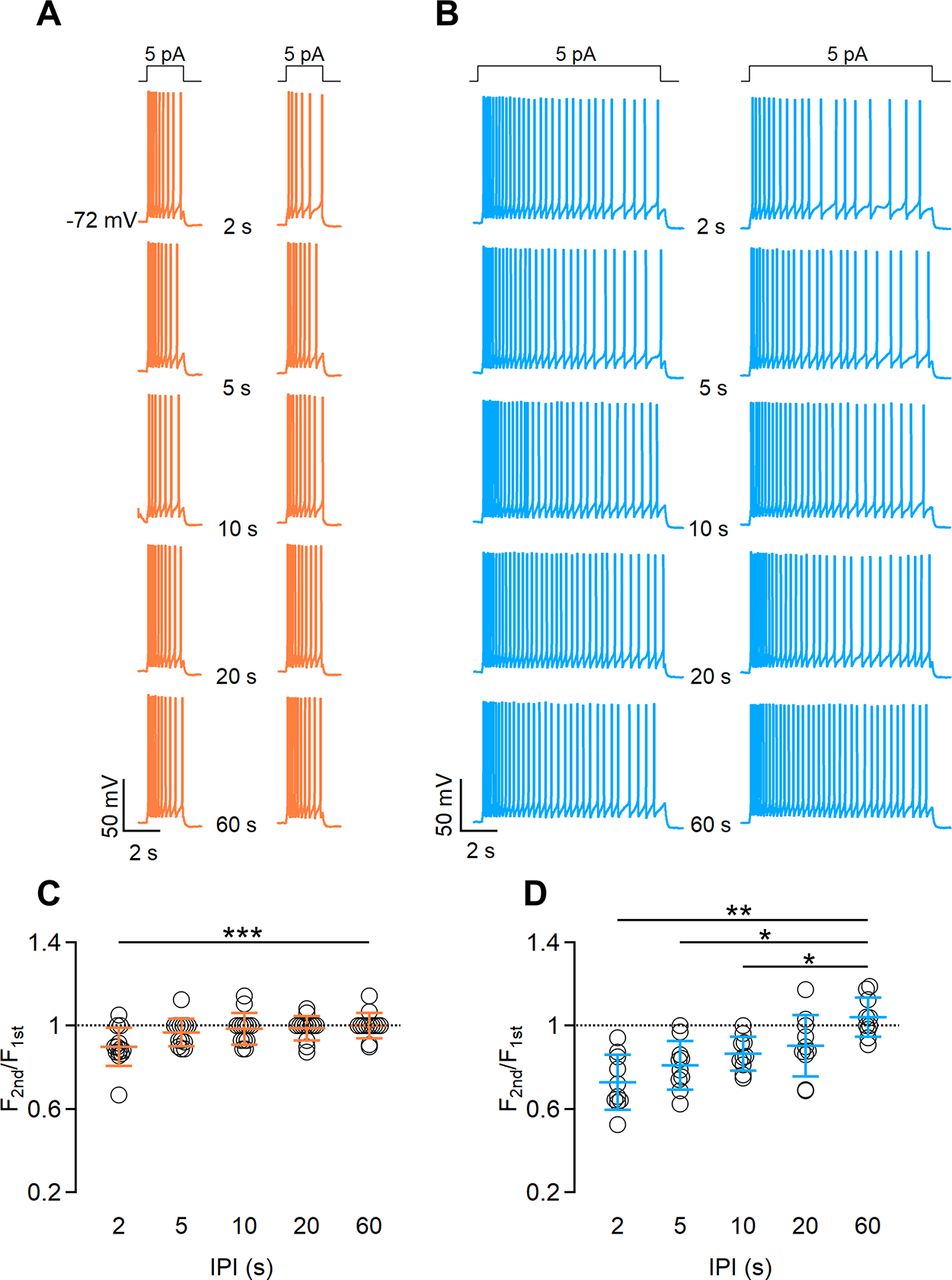
We next examined whether the duration of a current step affects short-term adaptation by repeating the same experiments obtained with urine stimuli (Fig. 3; i.e., we applied pairs of current steps of 2 or 10 s duration at various IPIs). We found that repetitive current steps of 2 s generated short-term adaptation with an IPI of 2 s (average frequency ratio, 0.89 ± 0.09; n = 13), but not when longer IPIs were used (Fig. 5A,C), while current steps of 10 s caused adaptation with IPIs of 2 and 5 s (average frequency ratios: 0.79 ± 0.13 for 2 s; 0.81 ± 0.12 for 5 s; n = 13; Fig. 5B,D).

The duration of current step stimulation affects the extent of spike frequency adaptation. A, B, Representative whole-cell current-clamp recordings obtained stimulating VSNs with a 5 pA current step for 2 s (A) or 10 s (B), with increasing intervals between steps of 2, 5, 10, 20, or 60 s, as indicated. Steps at the top indicate the time of current injection. C, D, Scatter dot plots with the average ± SD of normalized spike frequencies for each IPI for current steps of 2 s (C) or 10 s (D; for C: n = 13; Demsar’s test after Friedman test, p = 0.005 for IPI 2 s; for D: n = 10; paired t test with Bonferroni correction after ANOVA for repeated measurements: p = 0.0019 for IPI 2 s; p = 0.01 for IPI 5 s; p = 0.01 for IPI 10 s).
These data indicate that, at least partially, ion channels involved in the generation of action potentials, independent of signal transduction cascade components, might contribute to the development of short-term spike frequency adaptation in VSNs.
Phase–plane plot analysis of action potentials during repetitive stimulations
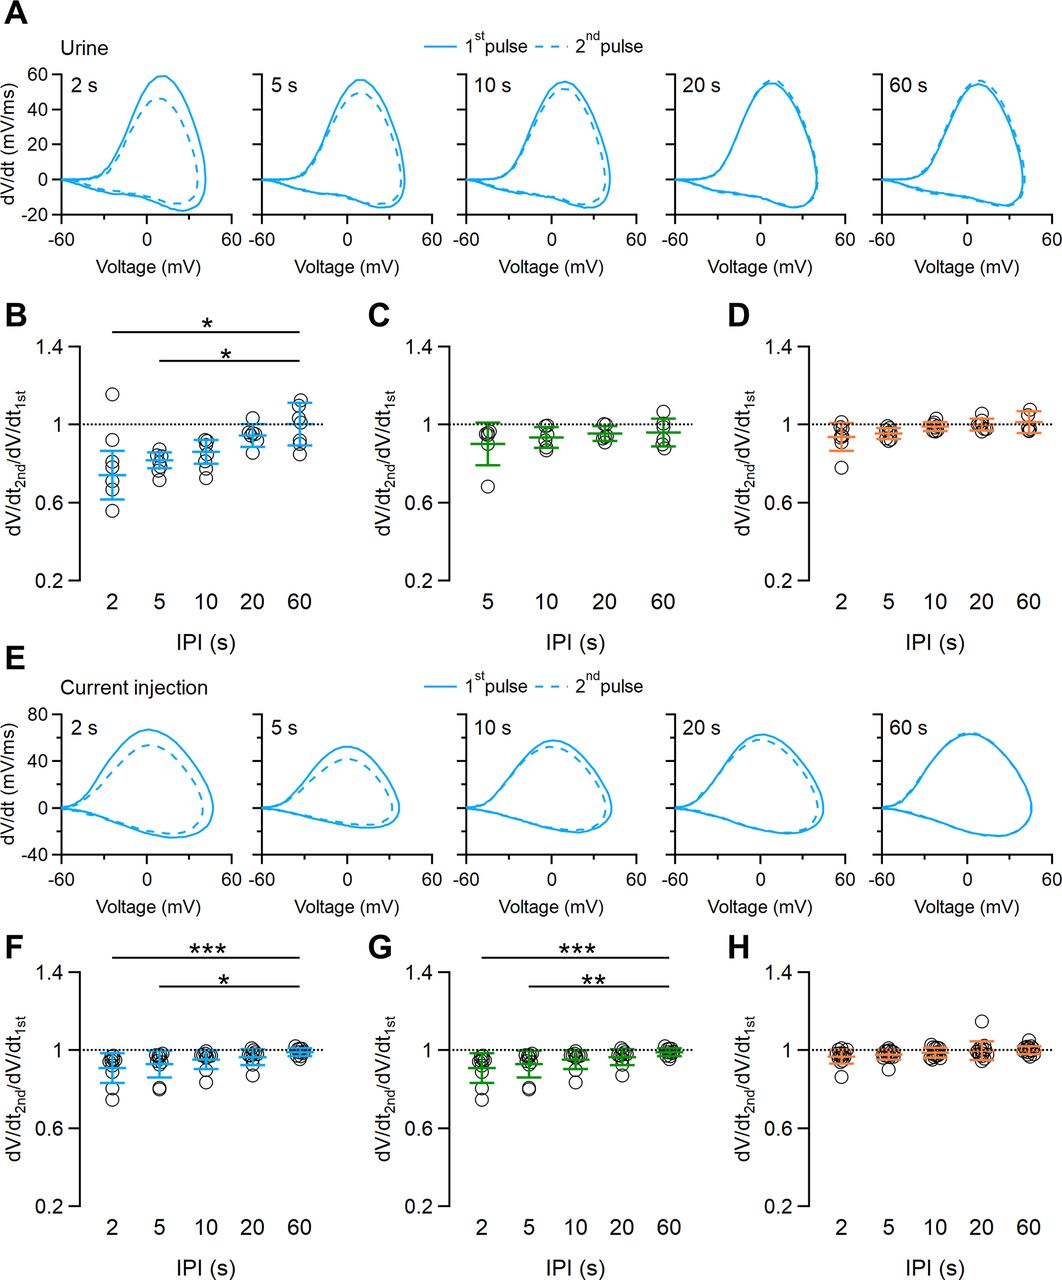
To obtain further information about ion channels involved in spike frequency adaptation, we analyzed the first action potentials during the first and second paired pulses by using phase–plane plot analysis. In this type of analysis, the changes of membrane potential with time (dV/dt) are plotted as a function of membrane potential, and each action potential is represented by a loop, with the upper and lower parts representing the depolarization and repolarization phases, respectively (Jenerick, 1963; Naundorf et al., 2006; Bean, 2007). The maximal value of dV/dt is the maximal rising slope of the depolarization phase of the action potential, which is related to the amplitude of Na+ currents and, consequently, to the availability of Na+ channels (Bean, 2007). In Figure 6A, we superimposed phase–plane plots calculated from the first action potential evoked by 10 s urine pulses at different IPIs. At 2 s IPI, the maximal value of dV/dt was clearly lower for the first action potential evocked by the second urine pulse (46 mV/ms; Fig. 6A, dashed line) compared with the one evoked by the first urine pulse (59 mV/ms; Fig. 6A, continuous line), while increasing IPIs narrowed the differences between the maximal values of dV/dt between the first action potentials of the repeated urine pulses. On average, the ratio between maximal values of dV/dt was significantly different at 2 and 5 s IPIs (0.74 ± 0.12 for 2 s; 0.81 ± 0.04 for 5 s; n = 6; Fig. 6B). The reduction of the maximal dV/dt value indicates a contribution of Na+ channels to spike frequency adaptation to urine (Fig. 6B). We did not measure any significant difference in maximal dV/dt for shorter urine paired pulses of 2 and 5 s (Fig. 6C,D).

Phase–plane plot analysis of action potentials from repeated stimulations. A, Phase–plane plots of the first action potential in response to a repeated urine stimulation of 10 s duration with increasing IPIs ranging from 2 to 60 s, as indicated. Continuous and dashed lines were calculated from the first action potential of the first and second urine pulses, respectively. B–D, Scatter dot plots with the average ± SD of the ratio between the maximal dV/dt values of the first action potentials at each IPI. Urine pulse durations of 10 s (B), 5 s (C), and 2 s (D; for B: n = 6; Demsar’s test after Friedman test: p = 0.0021 for IPI 2 s; p = 0.0041 for IPI 5 s; for C: n = 6; Friedman test, p = 0.89; for D: n = 9; Friedman test, p = 0.051). E, Phase–plane plots of the first action potential in response to a repeated 5 pA current step of 10 s duration with increasing IPIs ranging from 2 to 60 s, as indicated. Continuous and dashed lines were calculated from the first action potential of the first and second current steps, respectively. F–H, Scatter dot plots with the average ± SD of the ratio between the maximal dV/dt values of the first action potentials at each IPI. Current step durations of 10 s (F), 5 s (G), and 2 s (H; for F: n = 8; Demsar’s test after Friedman test: p = 0.00054 for IPI 2 s; p = 0.018 for IPI 5 s; for H: n = 14; Friedman test, p = 0.126).
We performed the same analysis when VSNs were stimulated with paired current steps as in Figures 4 and 5. In a way similar to that of urine stimulation, phase–plane plots for current paired pulses of 10 s show a clear difference in maximal dV/dt during a second stimulation when short IPIs (2 and 5 s) were used, and no differences were observed at longer IPIs (Fig. 6F). Current pulses of 5 s also displayed some difference in maximal dV/dt (Fig. 6G), while for current pulses of 2 s we did not measure any significant difference in maximal dV/dt (Fig. 6H).
Together, these data indicate that voltage-gated Na+ channels involved in action potential generation contribute to short-term spike frequency adaptation measured with paired urine pulses.
Inactivation properties of voltage-gated Na+ currents in VSNs
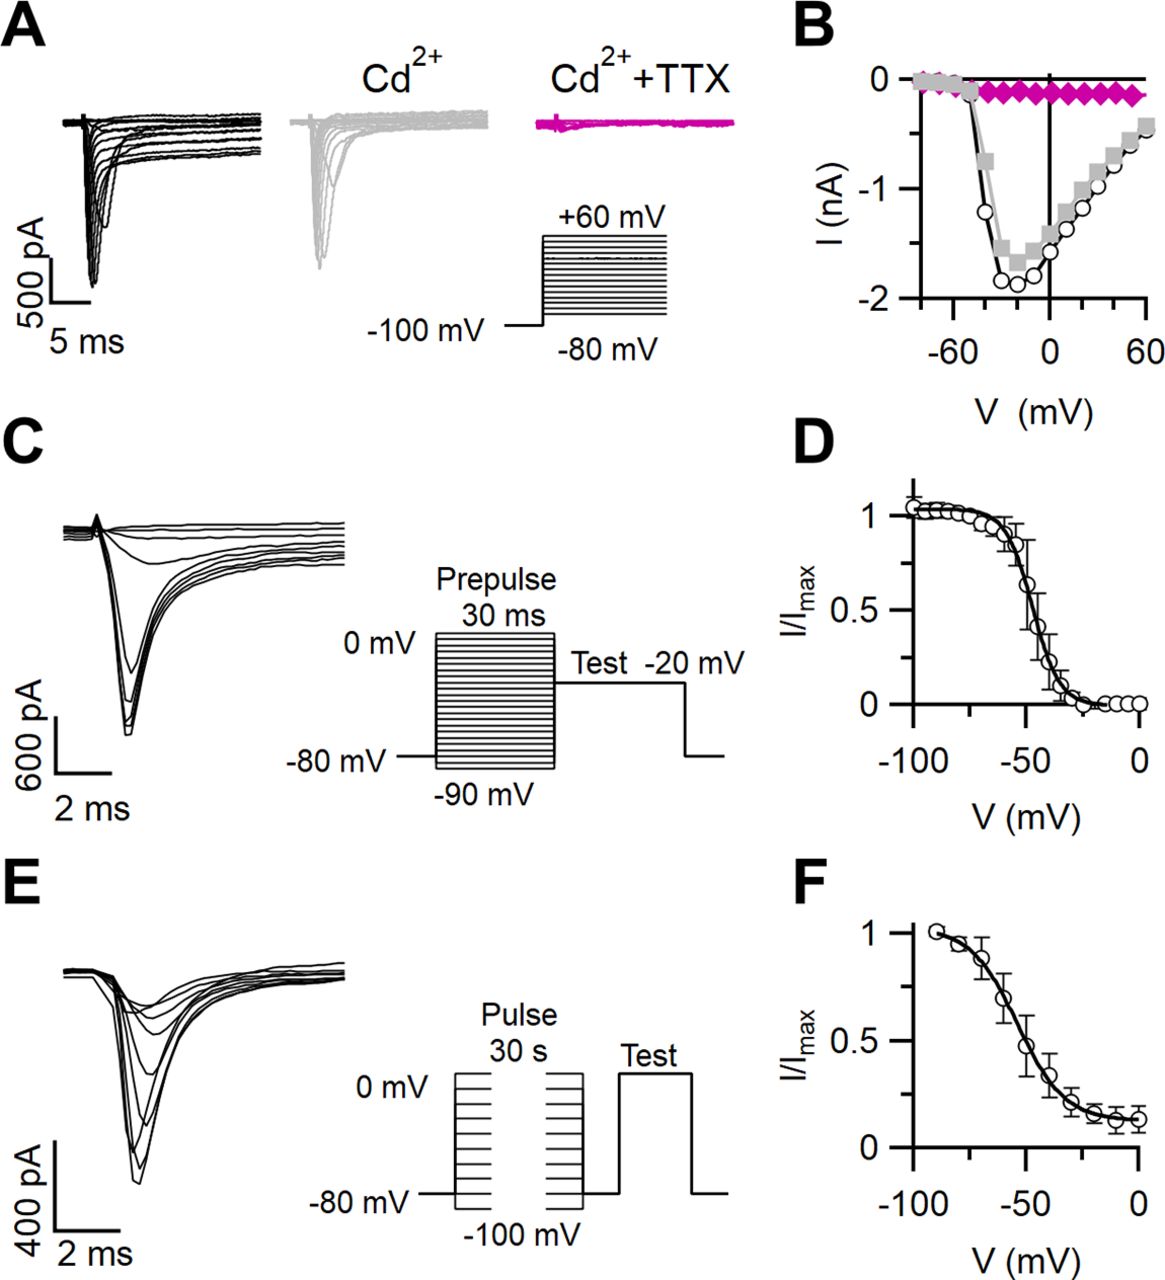
To measure the inactivation properties of Na+ channels in VSNs, we recorded inward currents from individual VSNs in the whole-cell voltage-clamp configuration using a Cs+-based intracellular solution to block outward K+ currents. Representative inward currents generated in response to a series of step depolarizations from a holding potential of −100 mV are shown in Figure 7A. As both Na+ and Ca2+ currents may contribute to inward currents in VSNs (Liman and Corey, 1996; Ukhanov et al., 2007), we added 100 μm Cd2+ to the external solution to block Ca2+ currents. The remaining inward currents were abolished by the addition of 2 μm TTX, indicating that they were mainly carried by TTX-sensitive Na+ channels (Fig. 7A,B). On average, the Na+ current was 83 ± 2% (n = 8) of the total inward current at −20 mV.

Inactivation of Na+ currents in VSNs. A, Families of whole-cell voltage-gated inward currents recorded from a VSN elicited by voltage steps from −80 to +60 mV with 10 mV increments from a holding potential of −100 mV. The patch pipette contained a Cs+-based intracellular solution. The neuron was exposed successively to bath solutions containing 100 μm Cd2+ and 100 μm Cd2+ plus 2 μm TTX, as indicated. B, Current–voltage relations for the peak inward currents from the recordings in A. C, E, Current recordings from the same VSN shown in A in response to stimulation protocols to measure inactivation in the presence of 100 μm Cd2+. A test pulse was preceded by a prepulse at the indicated voltages of 30 ms (C) or 30 s (E) duration to measure fast and slow inactivation, respectively. In C, one every two traces is shown. D, F, Normalized currents versus membrane potential from the experiments shown in C and E were fitted with a Boltzmann equation with Vhalf = −46.7 ± 1.6 mV and k = 4.9 ± 1.3 mV (n = 8) for fast inactivation (D) and Vhalf = −50.6 ± 2.4 mV and k = 8.7 ± 1.3 mV (n = 6) and asymptotic value of A = 0.18 for slow inactivation (F).
To measure the voltage dependence of steady-state fast and slow inactivation of Na+ channels, we used typical voltage protocols composed of prepulses and a test pulse to evaluate the noninactivated fraction of Na+ channels (all recordings were performed in the presence of 100 μm Cd2+ in the bath). For fast inactivation, we used prepulses of 30 ms at voltages from −90 to 0 mV, followed by a test potential of 30 ms at −20 mV (Fig. 7C). Normalized currents plotted as a function of the prepulse potential were fitted by the Boltzmann equation (Fig. 7D), and data from several neurons gave the following parameters: Vhalf = −46.7 ± 1.6 mV; and k = 4.9 ± 1.3 mV (n = 8). As Na+ channels can also enter a slow inactivated state, which might be relevant to our study of adaptation, we induced slow inactivation by applying prepulses of 30 s (Fig. 7E) at voltages from −90 to 0 mV, followed by a short (20 ms) hyperpolarizing step (to separate fast from slow inactivation) and by a test potential (30 ms) at 0 mV (Fig. 7E). The fit with a Boltzmann equation of the normalized current versus the prepulse potential (Fig. 7F) resulted in Vhalf = −50.6 ± 2.4 mV and k = 8.7 ± 1.3 mV (n = 6).
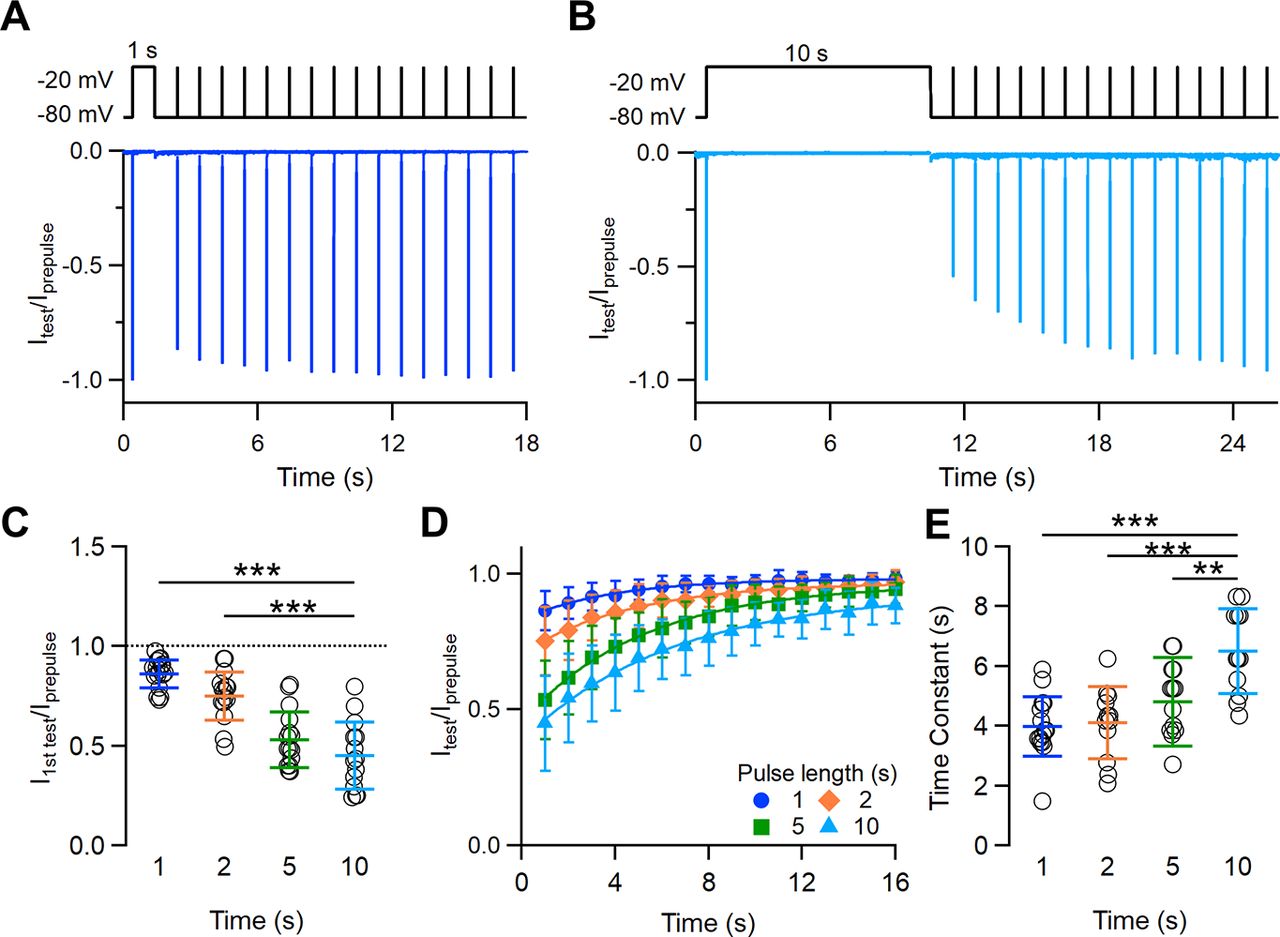
As Na+ channels may enter a state of slow inactivation on long depolarizations from which they recover only after several seconds, we measured the time course of recovery of Na+ channels in VSNs with a typical paired-pulse protocol with depolarizing prepulses varying from 1 to 10 s in duration. A depolarizing prepulse of a selected duration was given from a holding potential of −80 to −20 mV to induce inactivation, followed by a second pulse (test) with IPIs varying from 1 to 15 s (Fig. 8A,B, top line). The neuron was kept at −80 mV during each IPI. Moreover, to allow a complete recovery of the Na+ current, the time between each consecutive paired pulse was at least 1 min. The peak current measured 1 s after each prepulse (duration, 1–10 s) was smaller than that measured at the prepulse; but, as IPI increased, more channels recovered from inactivation and the peak current produced by the second pulse gradually recovered toward the initial value. Figure 8, A and B, shows the superimposition of ratios of the peak currents evoked by the second and first pulses at IPIs from 1 to 15 s for depolarizing prepulses of 1 or 10 s, respectively. The first test pulse, applied 1 s after the depolarizing prepulse, produced a Na+ current of decreasing amplitude as the prepulse duration increased (average current ratios: 0.86 ± 0.07 for 1 s; 0.75 ± 0.12 for 2 s; 0.53 ± 0.14 for 5 s; 0.45 ± 0.17 for 10 s; n = 14–17; Fig. 8A–C). The recovery of the Na+ current toward its initial amplitude was slower for longer prepulse durations; indeed, the fit of the data with an exponential function gave time constants significantly higher for longer prepulses (4.0 ± 1.0 s for 1 s; 4.1 ± 1.2 for 2 s; 4.9 ± 1.2 s for 5 s; 6.5 ± 1.4 for 10 s; n = 12–15; Fig. 8D,E).

Time course of recovery of Na+ channels from inactivation induced by depolarization steps varying from 1 to 10 s duration. A, B, Representative whole-cell voltage-clamp recordings of Na+ currents in a VSN in the presence of 100 μm Cd2+. Currents were elicited by a paired-pulse protocol consisting of a depolarization prepulse from −80 to −20 mV of 1 s (A) or 10 s (B) duration followed by a short (10 ms) test pulse at increasing recovery intervals ranging from 1 to 15 s. The holding potential was −80 mV. For each IPI, the peak current measured at the test pulse was normalized to the prepulse peak current and superimposed. C, Scatter dot plots with the average ± SD of the normalized peak currents measured at 1 s after the prepulse of the indicated duration (t test with Bonferroni correction after ANOVA for repeated measurements: p =1.7 * 10−6 for 1 s; p = 1.97 * 10−6 for 2 s; p = 0.22 for 5 s; n = 14–17). D, Recovery from inactivation as a function of IPIs at the indicated prepulse duration. E, Scatter dot plot with the average ± SD of the time constants (τ) of recovery from slow inactivation (Dunnett’s test after ANOVA: p = 9.11 * 10−6 for 1 s; p = 3.97 * 10−5 for 2 s; p = 0.0045 for 5 s; n = 12–15).
These data show that voltage-gated Na+ channels in VSNs present slow inactivation and that recovery from slow inactivation requires several seconds and depends on the duration of the inactivation step. The time scale of seconds for recovery from slow inactivation is similar to what was measured during short-term adaptation protocols, suggesting that the slow recovery of Na+ channels from inactivation partially contributes to short-term spike frequency adaptation observed in VSNs.
Discussion
In this study, we have shown that VSNs undergo spike frequency short-term adaptation when stimulated with repetitive pulses of natural stimuli in current-clamp whole-cell recordings. This type of protocol resembles the temporal arrival of stimuli to the VNO when animals are actively sampling the environment for chemical cues. Moreover, we have shown that bypassing signal transduction activation with repetitive current injections still produced spike frequency adaptation and that slow inactivation of Na+ channels is one of the relevant molecular mechanisms involved in short-term adaptation in VSNs.
Our study confirms and significantly extends a previous study that revealed adaptation of VSNs when stimulated with paired-pulse protocols. Indeed, Wong et al. (2018) used in situ Ca2+ imaging and extracellular electrophysiological recordings to measure responses to various chemical cues (diluted urine and bile acid ligands) and found evidence for short- and long-term adaptation in VSNs stimulated with repetitive pulses of natural stimuli. Here, we used current-clamp whole-cell recordings to measure responses to repeated identical pulses of diluted urine from 2 to 10 s in duration, and measured spike frequency adaptation that depended on the time interval between pulses and gradually recovered as the IPI increased into the range of 2–30 s. Moreover, we found that increasing the duration of paired stimuli produced a more effective adaptation, thus demonstrating that short-term adaptation depends on the pulse duration and the interval between stimulations.
The use of whole-cell instead of loose-patch recordings, as in the study by Wong et al. (2018), allowed us to bypass the transduction cascade to measure the contribution of voltage-gated channels to spike frequency adaptation. Unexpectedly, we found that spike frequency adaptation was still present when VSNs were stimulated by repeated current step injections, independent of signal transduction activation. Thus, we used phase–plane plot analysis to compare the action potential dynamics of the first action potentials evoked by paired-pulse stimulation both with natural stimuli and with current injections. We found a significant difference in the maximal value of dV/dt of the first action potential elicited by the second compared with the first stimulus for 10 s paired pulses. As in this type of analysis the maximal value of dV/dt is directly proportional to the availability of voltage-gated Na+ channels (Bean, 2007), these results suggested a contribution of Na+ channels to short-term adaptation.
A previous study by Spehr et al. (2009) showed that VSNs undergo spike frequency adaptation by measuring current-clamp responses to urine paired pulses of 20 s duration separated by an IPI of 30 s and that this form of adaptation was mainly caused by Ca2+-calmodulin feedback inhibition of the TRPC2 transduction channel. Moreover, the authors did not find any spike frequency adaptation when VSNs responded to paired current steps of 2 pA lasting 20 s and separated by an IPI of 30 s, thus excluding a contribution of voltage-gated channels. It is important to note that time scales are different in our experiments, and therefore the results cannot be directly compared. Indeed, we used urine pulses from 2 to 10 s, shorter than the 20 s pulses used by Spehr et al. (2009), and we found that spike frequency adaptation was not present at the time interval of 30 s. Thus, our results are not in contrast with those of Spehr et al. (2009) and do not exclude a contribution to adaptation of the Ca2+-calmodulin feedback, but rather introduce Na+ channels as new players in short-term spike frequency adaptation.
To evaluate the relative importance of sensory transduction modulation and the slow inactivation of the Na+ channel determining the VSN adaptation, it would be necessary to stimulate the VSNs with a different current amplitude to generate action potential firing similar to that induced by pheromone application. Unfortunately, the pattern of firing induced by urine is very heterogeneous (Fig. 1) precluding a precise quantification of the results.
To better understand the mechanisms of action of Na+ channels on the measured spike frequency adaptation, we analyzed their properties in VSNs. Voltage-gated Na+ channels undergo rapid activation to initiate the rising phase of action potential, followed by fast and slow inactivation processes. While fast inactivation attenuates inward Na+ conductance on the millisecond time scale, slow inactivation occurs when prolonged or high-frequency depolarizations over the span of seconds reduce the number of channels available to provide excitatory inward currents (Silva, 2014). Slow inactivation of voltage-gated Na+ channels is well known to play a role in controlling membrane excitability, firing properties, and spike frequency adaptation in the nervous system (Fleidervish et al., 1996; Toib et al., 1998). We investigated the inactivation properties of Na+ currents recorded in VSNs with paired-pulse protocols and measured a slow inactivation that required several seconds to recover and was dependent on the duration of the inactivation step. The time scale of recovery from slow inactivation was similar to that measured for short-term adaptation induced by urine and current step stimuli, indicating that the slow recovery from inactivation contributes to spike frequency adaptation to paired-pulse protocols.
A previous study investigated in detail the Na+ currents in subpopulations of VSNs specifically expressing V1Rb2 (apical zone) or V2R1b (basal zone; Ukhanov et al., 2007). Although it is difficult to generalize the results found in V1Rb2-expressing and V2R1b-expressing cells to the whole population of apical and basal VSNs, respectively, the parameter of the Boltzmann equation we found for fast inactivation is indeed in good agreement with the values reported by Ukhanov et al. (2007) for the basal neurons V2R1b. Indeed, the Vhalf of fast inactivation measured by us was −46.7 mV, more similar to −53.5 mV in V2R1b than to −65.7 mV in V1Rb2.
Several Na+ channel isoforms have been found to be expressed in VSNs either at mRNA level by RT-PCR or by immunohistochemistry, as follows: Nav1.1, Nav1.2, Nav1.3, Nav1.6, and Nav1.7. They differ in level of expression and are localized in different neuronal compartments (Fieni et al., 2003; Rupasinghe et al., 2012; Ibarra-Soria et al., 2014; Bolz et al., 2017). For example, Nav1.3 and Nav1.7 are highly expressed and mainly located on axons, while Nav1.2 and Nav1.6 were found in the soma of VSNs (Bolz et al., 2017).- Thus, a combination of these Na+ channel isoforms and their associated β-subunits is likely to contribute to the Na+ currents and the generation of action potentials in VSNs.
Slow inactivation of Na+ channels has been associated with activity-dependent modulation of neuronal excitability in several systems. For example, in neocortical pyramidal cells, Na+ channel slow inactivation is associated with cumulative adaptation of spike firing caused by prolonged and repetitive depolarizing stimuli and with a slowing of the rising phase of the action potentials (Fleidervish et al., 1996). In hippocampus CA1 pyramidal neurons, cumulative inactivation is involved in regulating back-propagating action potential amplitude and can influence dendritic excitation (Jung et al., 1997; Mickus et al., 1999). Interestingly, slow inactivation of Na+ channels has been associated with an adaptation process in the visual sensory system in the salamander, where it is involved in light temporal contrast adaptation in retinal ganglion cells (Kim and Rieke, 2003). Increasing contrast causes an increase in input current variance and consequently of the spike rate that in turn reduces Na+ channels availability through slow inactivation (Kim and Rieke, 2003).
In summary, our work confirms and extends previous evidence of short-term adaptation in VSNs when stimulated with paired pulses of natural stimuli (Spehr et al., 2009; Wong et al., 2018) and demonstrates the contribution of a new molecular player by showing that slow inactivation of Na+ channels is an important component of short-term adaptation to natural stimuli.
Acknowledgments
Acknowledgment: We thank Professor Michele Giugliano [Scuola Internazionale Superiore di Studi Avanzati (SISSA)] and Professor Andrea Nistri (SISSA) for helpful discussions. We also thank Elettra Grdina, Angel Pascual Camerota, Cristina Degrassi, Lorenzo Maschietto, and Giovanni Tamburin for mice handling.
Footnotes
The authors declare no competing financial interests.
This study was supported by Grant 2010599KBR from the Italian Ministry of Education, Universities, and Research.
This is an open-access article distributed under the terms of the Creative Commons Attribution 4.0 International license, which permits unrestricted use, distribution and reproduction in any medium provided that the original work is properly attributed.
References
In this issue


