

Article Figures & Data
Figures
- Figure 1.
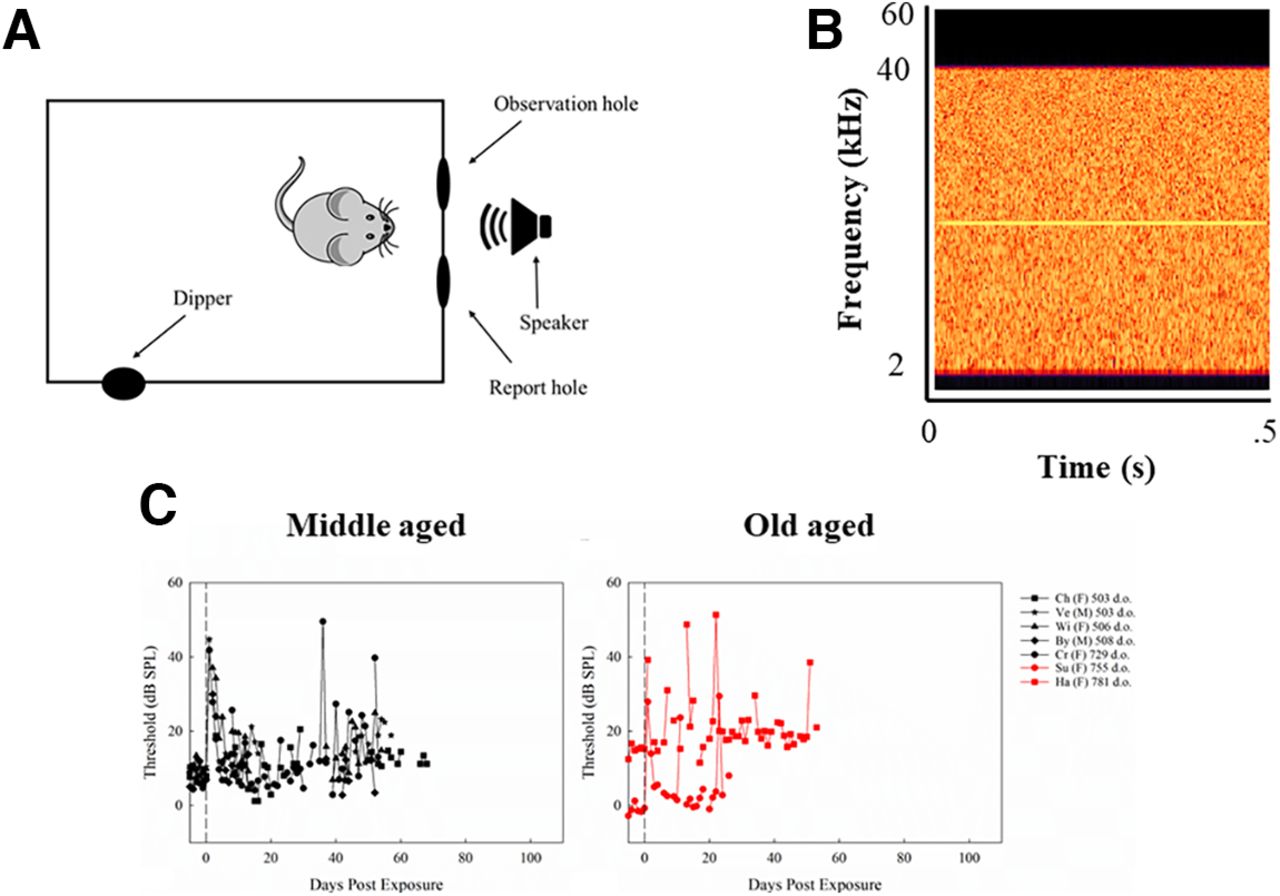
Thresholds (dB SPL) for middle-aged mice (A) and old-aged mice (B), and threshold shifts (dB) for middle-aged mice (C) and old-aged mice (D), trained to detect 14-kHz tones in quiet for all test days after exposure. Each plot contains the first two letters of the subject identifier, sex, and age at exposure in d.o. with black symbols representing middle-aged mice and red symbols representing old-aged mice. The dashed vertical line at day 0 represents noise exposure day. The dashed horizontal line in C and D represents pre-exposure thresholds at 0 dB for each mouse.
- Figure 2.
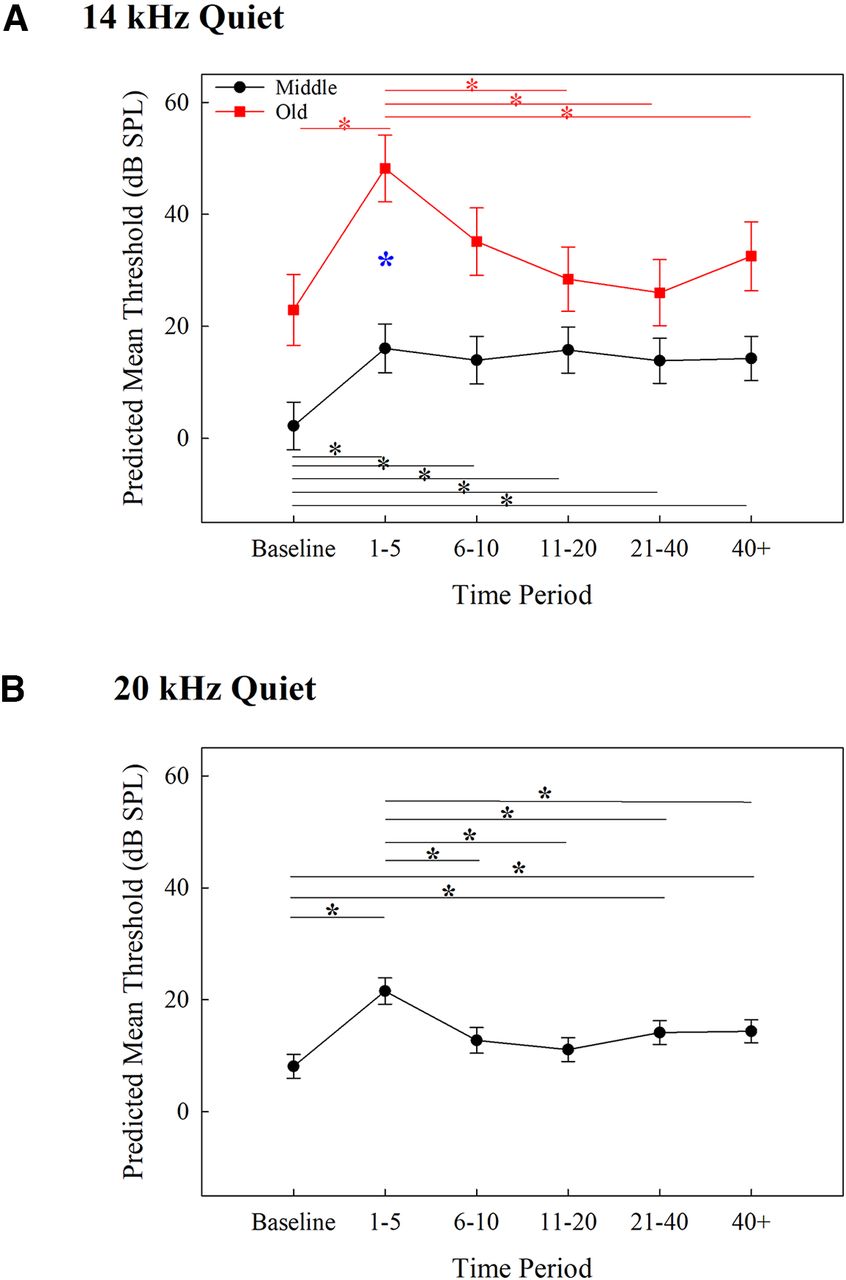
Predicted mean thresholds for tone detection in quiet from the mixed-effects model for 14 (A) and 20 (B) kHz across each time period (corrected p = 0.0014). Middle-aged mice are represented by black circles and within-group significant comparisons are designated with black lines and *. Old-aged mice are represented by red squares and within-group significant comparisons are designated with red lines and *. The blue * in A represents significant between age groups comparisons. Error bars represent SEM.
- Figure 3.
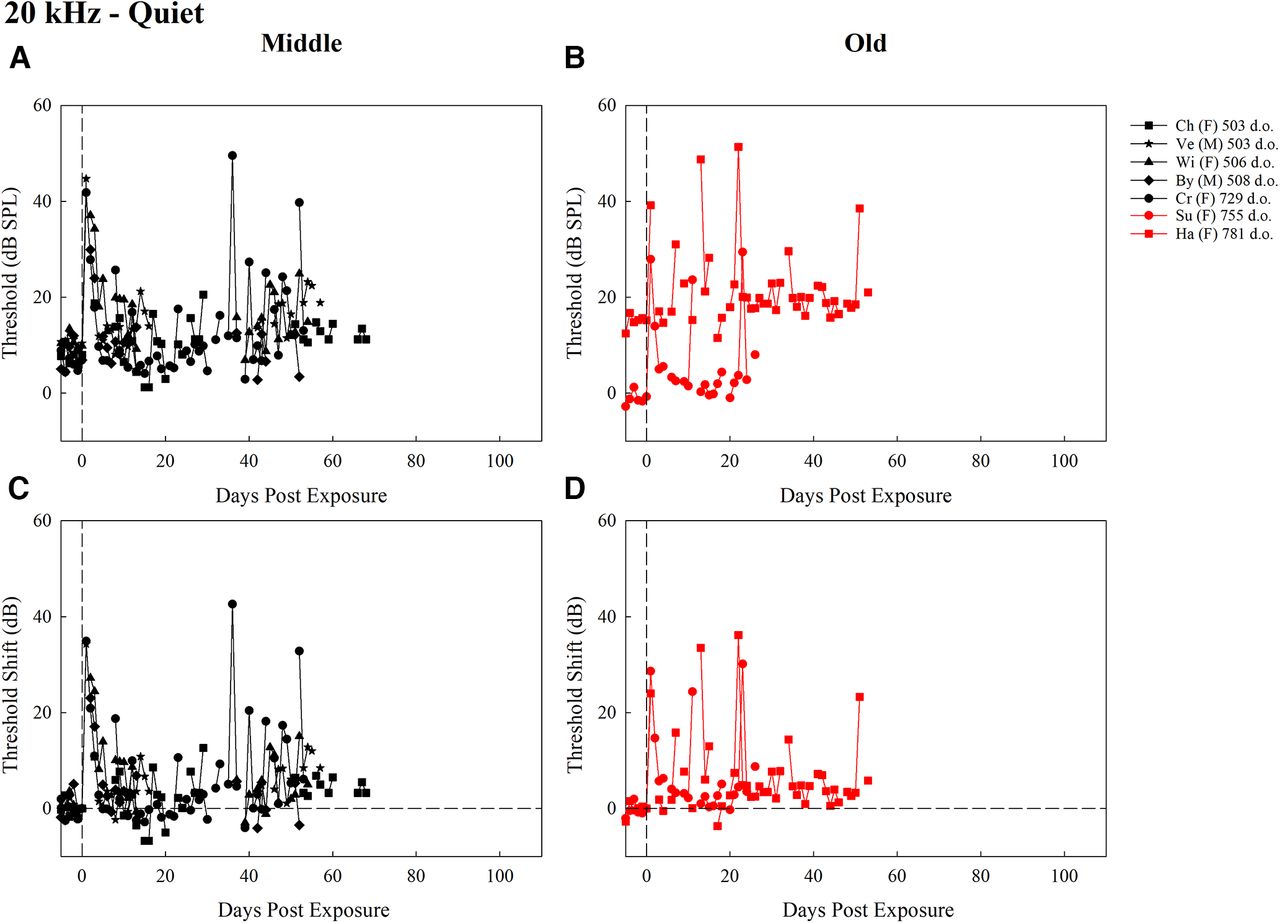
Thresholds (dB SPL) for middle-aged mice (A) and old-aged mice (B), and threshold shifts (dB) for middle-aged mice (C) and old-aged mice (D), trained to detect 20-kHz tones in quiet for all test days after exposure. Each plot contains the first two letters of the subject identifier, sex, and age at exposure in d.o. with black symbols representing middle-aged mice and red symbols representing old-aged mice. The dashed vertical line at day 0 represents noise exposure day. The dashed horizontal line in C and D represents pre-exposure thresholds at 0 dB for each mouse.
- Figure 4.
Thresholds (dB SPL) for middle-aged mice (A) and old-aged mice (B), and threshold shifts (dB) for middle-aged mice (C) and old-aged mice (D), trained to detect 14-kHz tones in a masker for all test days after exposure. Each plot contains the first two letters of the subject identifier, sex, and age at exposure in d.o. with black symbols representing middle-aged mice and red symbols representing old-aged mice. The dashed vertical line at day 0 represents noise exposure day. The dashed horizontal line in C and D represents pre-exposure thresholds at 0 dB for each mouse.
- Figure 5.
Predicted mean thresholds for tone detection in noise from the mixed-effects model for 14 (A) and 20 (B) kHz across each time period (adjusted p = 0.0014). Middle-aged mice are represented by black circles and within-group significant comparisons are designated with black lines and *. Old-aged mice are represented by red squares and within-group significant comparisons are designated with red lines and *. Error bars represent SEM.
- Figure 6.
Thresholds (dB SPL) for middle-aged mice (A) and old-aged mice (B), and threshold shifts (dB) for middle-aged mice (C) and old-aged mice (D), trained to detect 20-kHz tones in a masker for all test days after exposure. Each plot contains the first two letters of the subject identifier, sex, and age at exposure in d.o. with black symbols representing middle-aged mice and red symbols representing old-aged mice. The dashed vertical line at day 0 represents noise exposure day. The dashed horizontal line in C and D represents pre-exposure thresholds at 0 dB for each mouse.
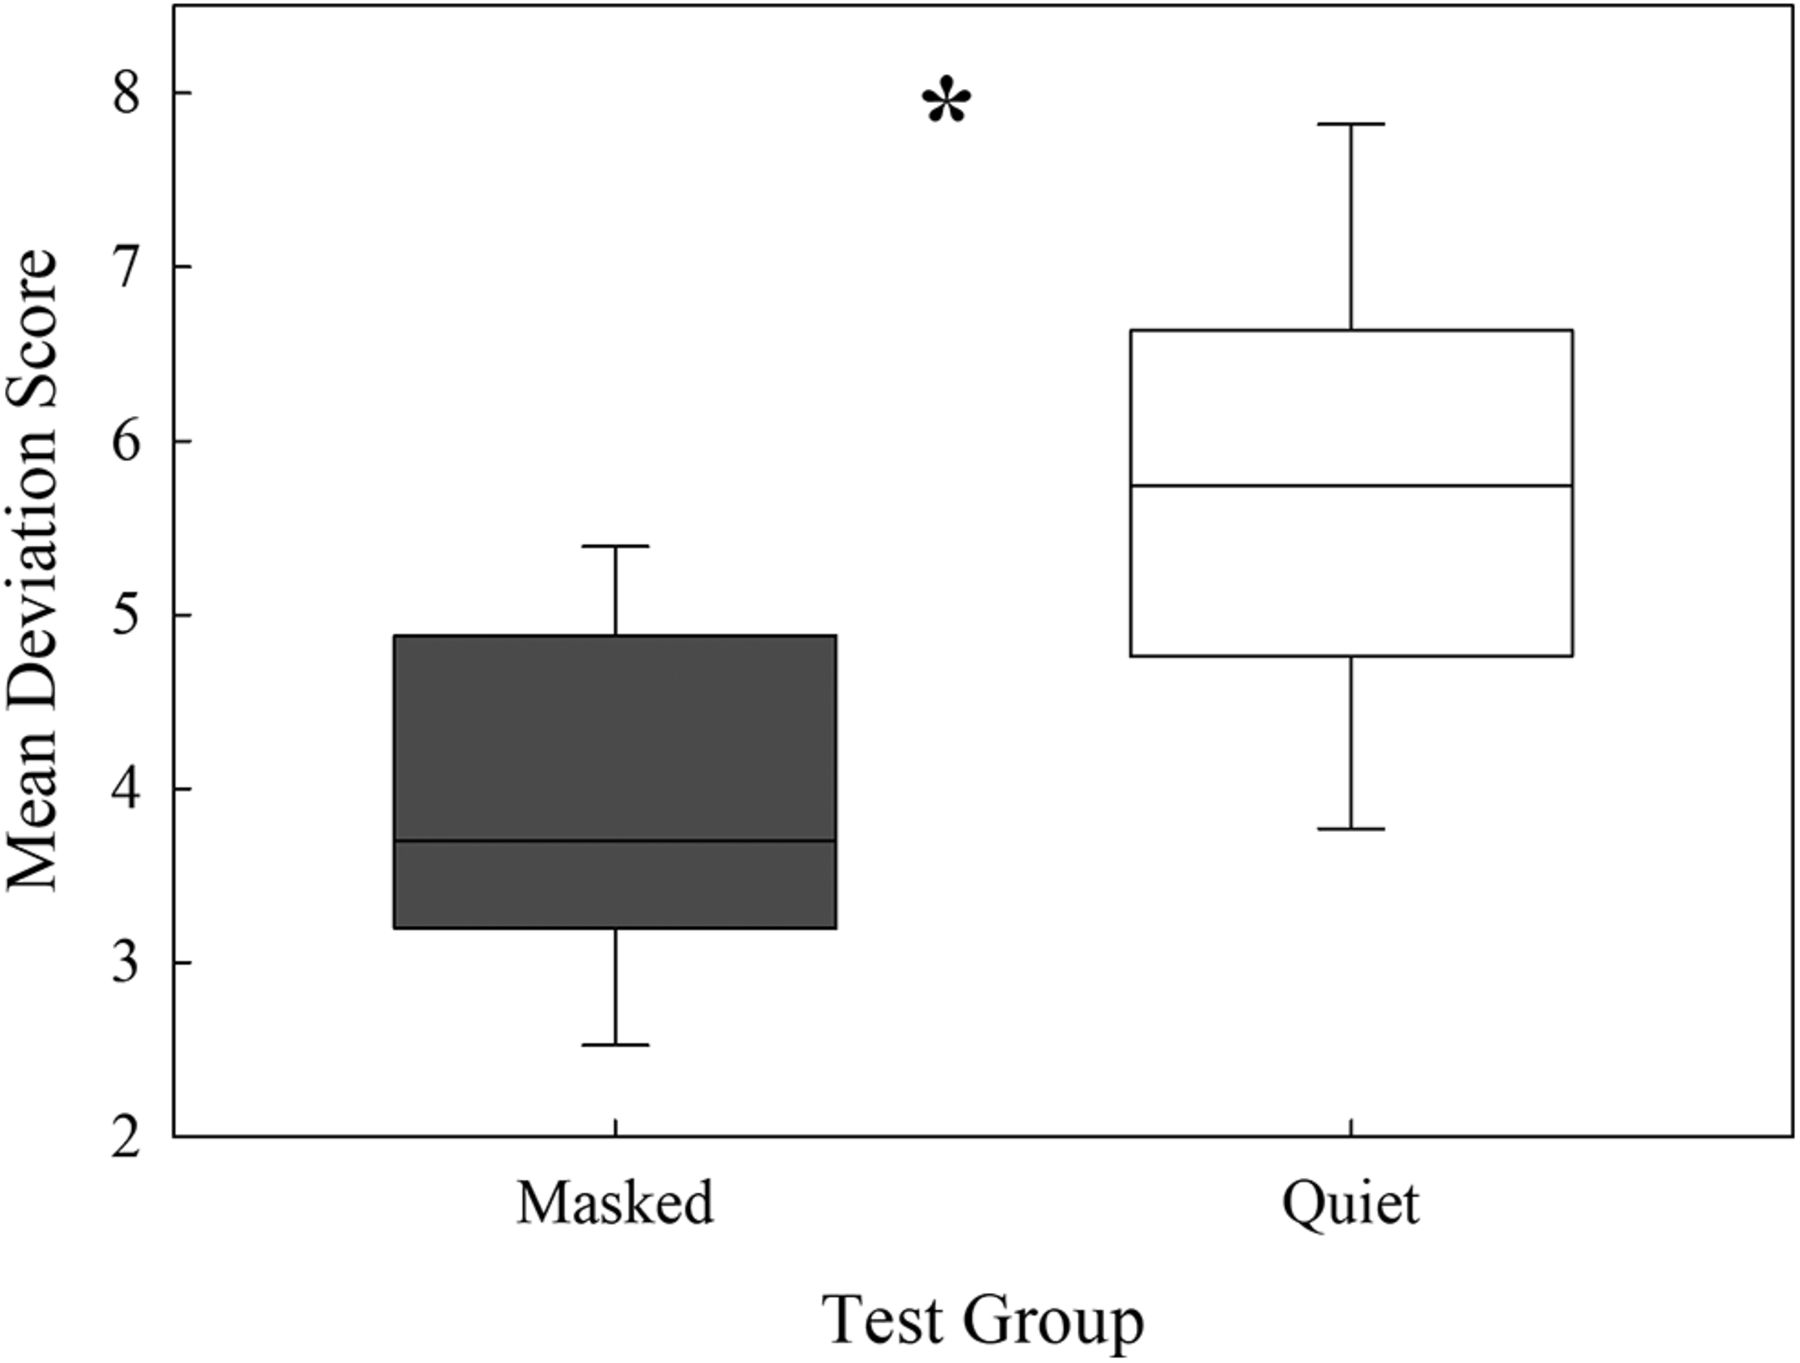
- Figure 7.
Mean deviation scores after exposure for masked and quiet listening conditions (*p < 0.05). Box height represents the 75th percentile (Q3), the horizontal line within box represents the median, the bottom of the box represents the 25th percentile (Q1) and the error bars represent represent the maximum observation that falls within the upper limit (Q3+1.5(Q3−Q1)) and the minimum observation that falls within the lower limit (Q1−1.5 (Q3−Q1)).
- Figure 8.
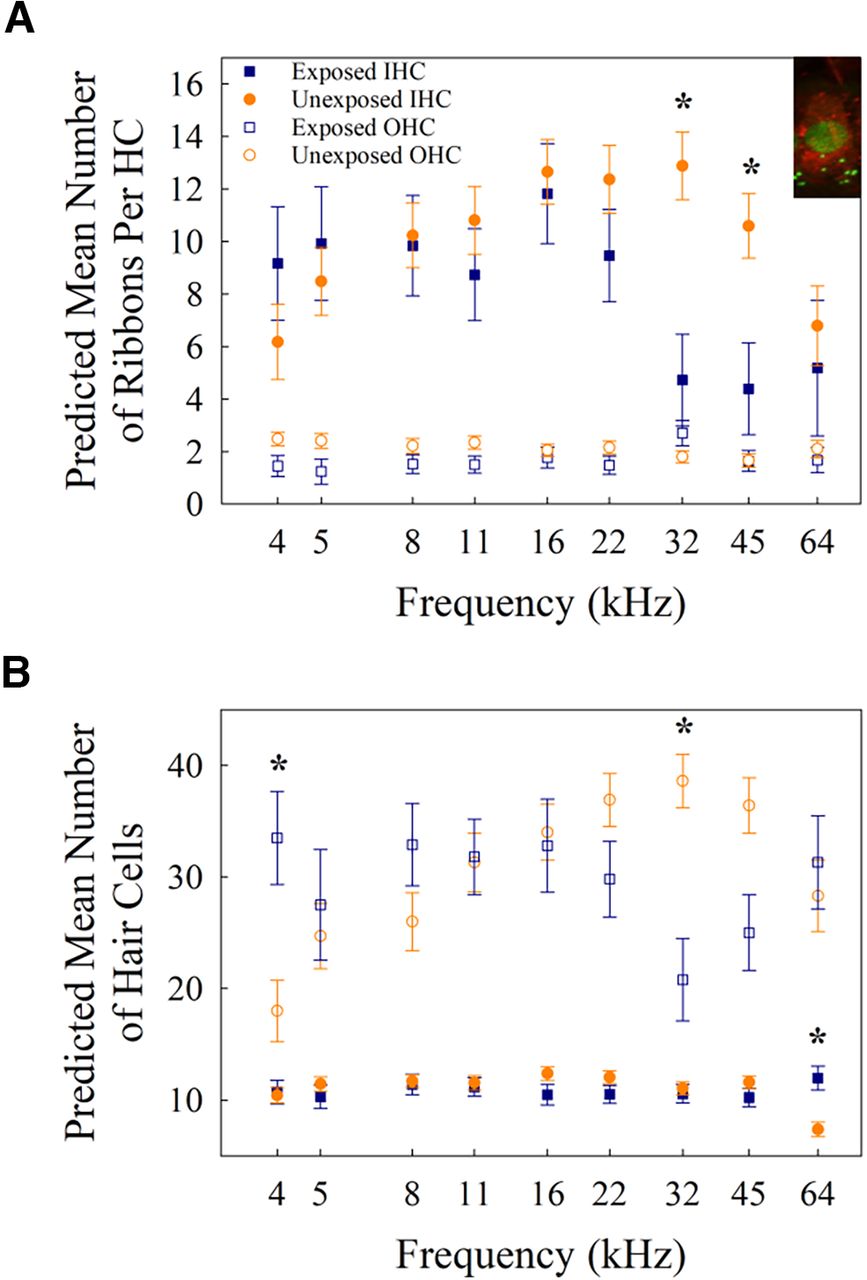
A, Predicted mean number of ribbons per hair HC across frequencies for unexposed (orange) and exposed (blue) mice. Error bars are standard error and *p < 0.0056. The top right corner includes sample cochlear immunohistochemistry with Myosin 6 (red) to visualize the hair cell and CTBP2 (green) to visualize ribbons. B, Predicted mean number of hair cells per 100 μm at each frequency for IHCs (closed symbols) and OHCs (open symbols) in unexposed (orange) and exposed mice (blue). Error bars are standard error and *p < 0.0056.


Tables
- Table 1
Statistical table for all behavioral modeling including F values, degrees of freedom (numerator, denominator), p values, and effect sizes (ηp2) for quiet (left) and masked (right) conditions separately for 14 kHz (top) and 20 kHz (bottom)
Quiet Masked F df p ηp2 F df p ηp2 14 kHz Age group 10.42 1, 9.40 0.0098 0.079004 1.36 1, 6.06 0.287 0.0106 Time period 16.61 5, 517.76 3.16e-15 0.629355 21.85 5, 395.85 < 2.2e-16 0.8506 Age group:time period 7.70 5, 517.76 5.39e-07 0.291641 3.56 5, 395.85 0.004 0.1387 20 kHz Age group 0.0492 1, 6.01 0.8319 0.0005 Time period 11.75 5, 234.48 3.80e-10 10.01 5, 373.08 5.26e-9 0.5059 Age group:time period 9.77 5, 373.08 8.69e-09 0.4936 Significant values are bolded.
- Table 2
Statistical table for all day-to-day variability measurements, including an ANOVA analysis examining the interaction between masker status and stimulus, a post hoc Tukey’s test, and linear regressions examining whether the age of the mouse (in d.o.) could predict changes in day-to-day variability
Test type Comparisons/independent variables Test statistic SS df p value Effect size ANOVA After <- stimulus × masker status F value ηp2 Stimulus 0.843 1.176 1 0.3685 0.0220009 Masker status 15.353 21.42 1 0.00074 0.400876 Stimulus × masker status 0.103 0.143 1 0.7515 0.002676 Residuals 30.694 22 Difference score Cohen’s d Tukey’s HSD Quiet vs masked after noise exposure 1.821 0.00074 1.591433 F value R2 Linear regression Quiet before noise exposure 1.07 (2, 12) 0.3213 0.0819 Noise before noise exposure 1.3096 (2, 10) 0.2791 0.1158 Quiet after noise exposure 2.5804 (2, 12) 0.1342 0.177 Noise after noise exposure 1.2205 (2, 10) 0.2951 0.1088 14 kHz in quiet after 0.2825 (2, 5) 0.6178 0.0535 14 kHz in noise after 1.9356 (2, 4) 0.2365 0.3261 20 kHz in quiet after 5.076 (2, 5) 0.074 0.5038 20 kHz in noise after 0.2996 (2, 4) 0.6132 0.0697 Significant values are bolded throughout and relevant effect sizes are presented.
- Table 3
Statistical table for all anatomic tests including F values, degrees of freedom (numerator, denominator), p values, and effect sizes (ηp2) for number of IHCs (top), number of OHCs (second down), number of puncta per IHC (third down), and number of puncta per OHC (bottom)
Test Variables F df p ηp2 Frequency 1.1512 8, 116 0.334901 0.264604 Number of IHCs Exposure group 0.4954 1, 116 0.482941 0.014234 Frequency:Exposure group 3.1375 8, 116 0.003005 0.721163 Frequency 1.9385 8, 92.652 0.0633 0.200283 Number of OHCs Exposure group 0.1575 1, 15.553 0.6969 0.002036 Frequency:Exposure group 7.7205 8, 92.652 7.00E-08 0.797681 Frequency 3.8095 8, 101.521 0.000599 0.489336 Number of puncta per IHC Exposure group 2.4514 1, 15.805 0.137217 0.039362 Frequency:Exposure group 3.6692 8, 101.521 0.000854 0.471303 Frequency 0.6406 8, 81.208 0.74136 0.187705 Number of puncta per OHC Exposure group 3.6937 1, 14.988 0.07384 0.135288 Frequency:Exposure group 2.3105 8, 81.208 0.02759 0.677006 Significant values are bolded.
In this issue


