
Main menu

  • HOME
  • CONTENT
    • Early Release
    • Featured
    • Current Issue
    • Issue Archive
    • Blog
    • Collections
    • Podcast
  • TOPICS
    • Cognition and Behavior
    • Development
    • Disorders of the Nervous System
    • History, Teaching and Public Awareness
    • Integrative Systems
    • Neuronal Excitability
    • Novel Tools and Methods
    • Sensory and Motor Systems
  • ALERTS
  • FOR AUTHORS
  • ABOUT
    • Overview
    • Editorial Board
    • For the Media
    • Privacy Policy
    • Contact Us
    • Feedback
  • SUBMIT

User menu

Search

  • Advanced search
eNeuro

eNeuro

Advanced Search


  • HOME
  • CONTENT
    • Early Release
    • Featured
    • Current Issue
    • Issue Archive
    • Blog
    • Collections
    • Podcast
  • TOPICS
    • Cognition and Behavior
    • Development
    • Disorders of the Nervous System
    • History, Teaching and Public Awareness
    • Integrative Systems
    • Neuronal Excitability
    • Novel Tools and Methods
    • Sensory and Motor Systems
  • ALERTS
  • FOR AUTHORS
  • ABOUT
    • Overview
    • Editorial Board
    • For the Media
    • Privacy Policy
    • Contact Us
    • Feedback
  • SUBMIT
PreviousNext
Research ArticleResearch Article: New Research, Cognition and Behavior

MEG Activity in Visual and Auditory Cortices Represents Acoustic Speech-Related Information during Silent Lip Reading

Felix Bröhl, Anne Keitel and Christoph Kayser
eNeuro 21 June 2022, 9 (3) ENEURO.0209-22.2022; DOI: https://doi.org/10.1523/ENEURO.0209-22.2022
Felix Bröhl
1Department for Cognitive Neuroscience, Faculty of Biology, Bielefeld University, Bielefeld 33615, Germany
  • Find this author on Google Scholar
  • Find this author on PubMed
  • Search for this author on this site
Anne Keitel
2Psychology, University of Dundee, Dundee DD1 4HN, United Kingdom
  • Find this author on Google Scholar
  • Find this author on PubMed
  • Search for this author on this site
  • ORCID record for Anne Keitel
Christoph Kayser
1Department for Cognitive Neuroscience, Faculty of Biology, Bielefeld University, Bielefeld 33615, Germany
  • Find this author on Google Scholar
  • Find this author on PubMed
  • Search for this author on this site
  • ORCID record for Christoph Kayser
  • Article
  • Figures & Data
  • Info & Metrics
  • eLetters
  • PDF
Loading

Article Figures & Data

Figures

  • Tables
  • Figure 1.
    • Download figure
    • Open in new tab
    • Download powerpoint
    Figure 1.

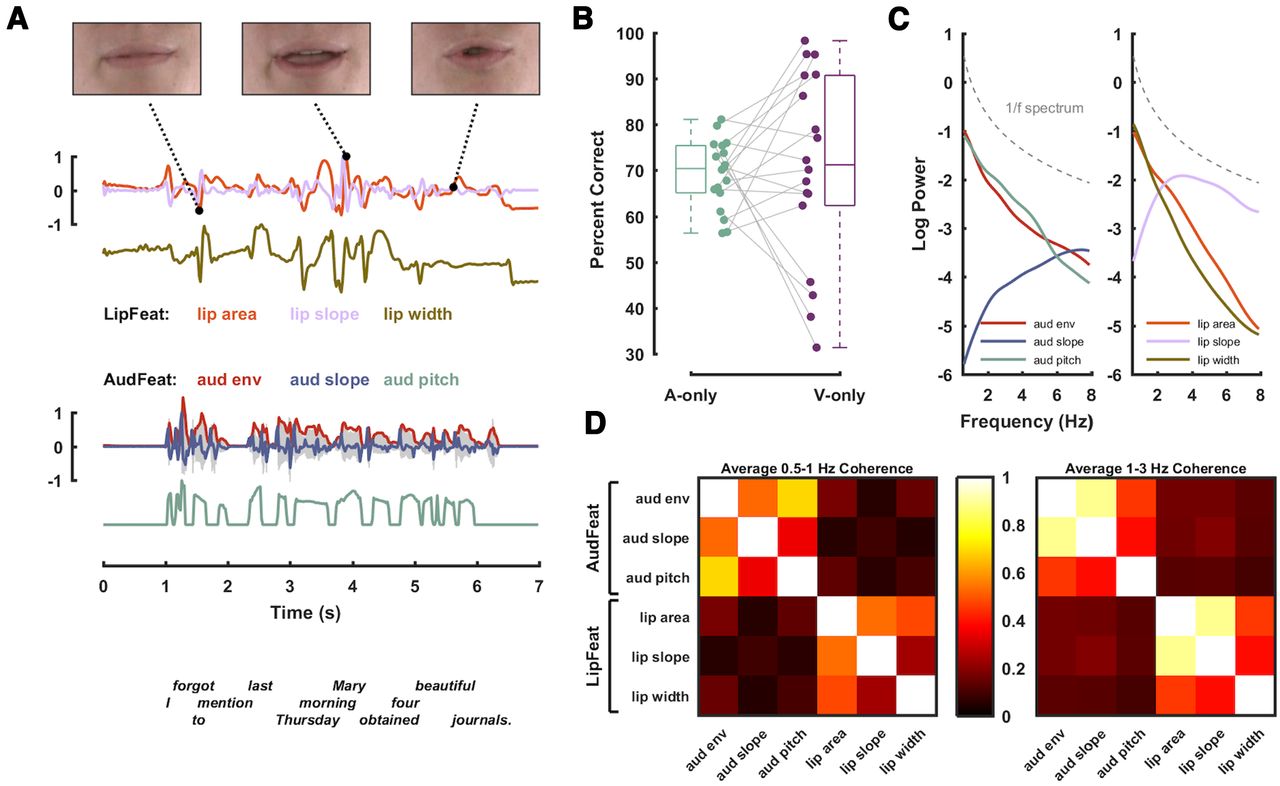
    Stimulus material and experimental methodology. Acoustic and visual features were extracted from audiovisual speech material and were used to quantify their cerebral tracking during audio-only and visual-only presentations. A, The stimulus material consisted of 180 audiovisual recordings of a trained actor speaking individual English sentences. For visualization, here only the mouth is shown, but participants were presented with the entire face. From the video recordings, we extracted three features describing the dynamics of the lip aperture: the area of lip opening (lip area), its slope (lip slope), and the width of lip opening (lip width); collectively termed LipFeat. From the audio waveform, we extracted three acoustic features: the broadband envelope (aud env), its slope (aud slope), and a measure of dominant pitch (aud pitch), collectively termed AudFeat. B, Trial-averaged percent correctly (PC) reported target words in auditory (A-only) and visual-only (V-only) conditions, with dots representing individual participants. C, Logarithmic power spectra for individual stimulus features. For reference, a 1/f spectrum is shown as a dashed gray line. D, Coherence between pairs of features averaged within two predefined frequency bands (0.5–1 Hz left; 1–3 Hz right; for details, see Materials and Methods).

  • Figure 2.
    • Download figure
    • Open in new tab
    • Download powerpoint
    Figure 2.

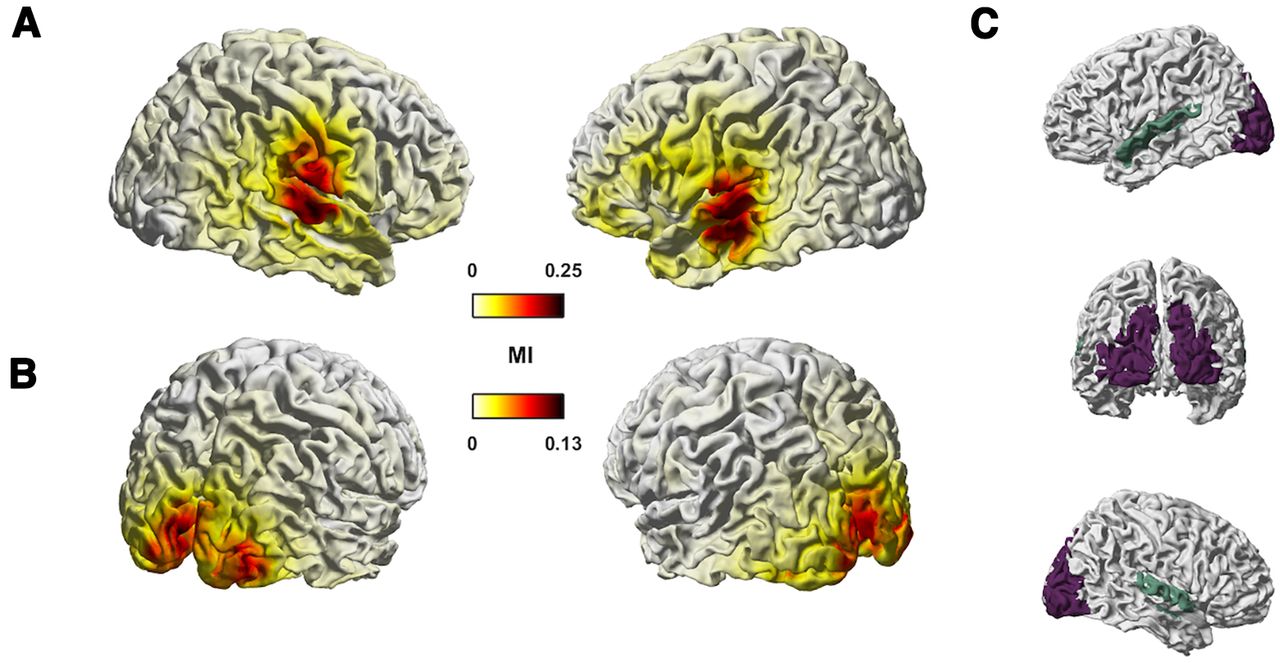
    Tracking of auditory and visual features in MEG source space. The figure shows group-level median MI values for auditory (AudFeat; A) and lip features (LipFeat; B) in the frequency range from 0.5 to 8 Hz (n = 18 participants). C, Colored shading indicates ROIs: temporal region in mint includes Brodmann area 41/42, caudal area 22 (A22c), rostral area 22 (A22r), and TE1.0 and TE1.2; occipital region in purple includes middle occipital gyrus (mOccG), occipital polar gyrus (OPC), inferior occipital gyrus (iOccG), and medial superior occipital gyrus (msOccG). Unit for MI is in bits.
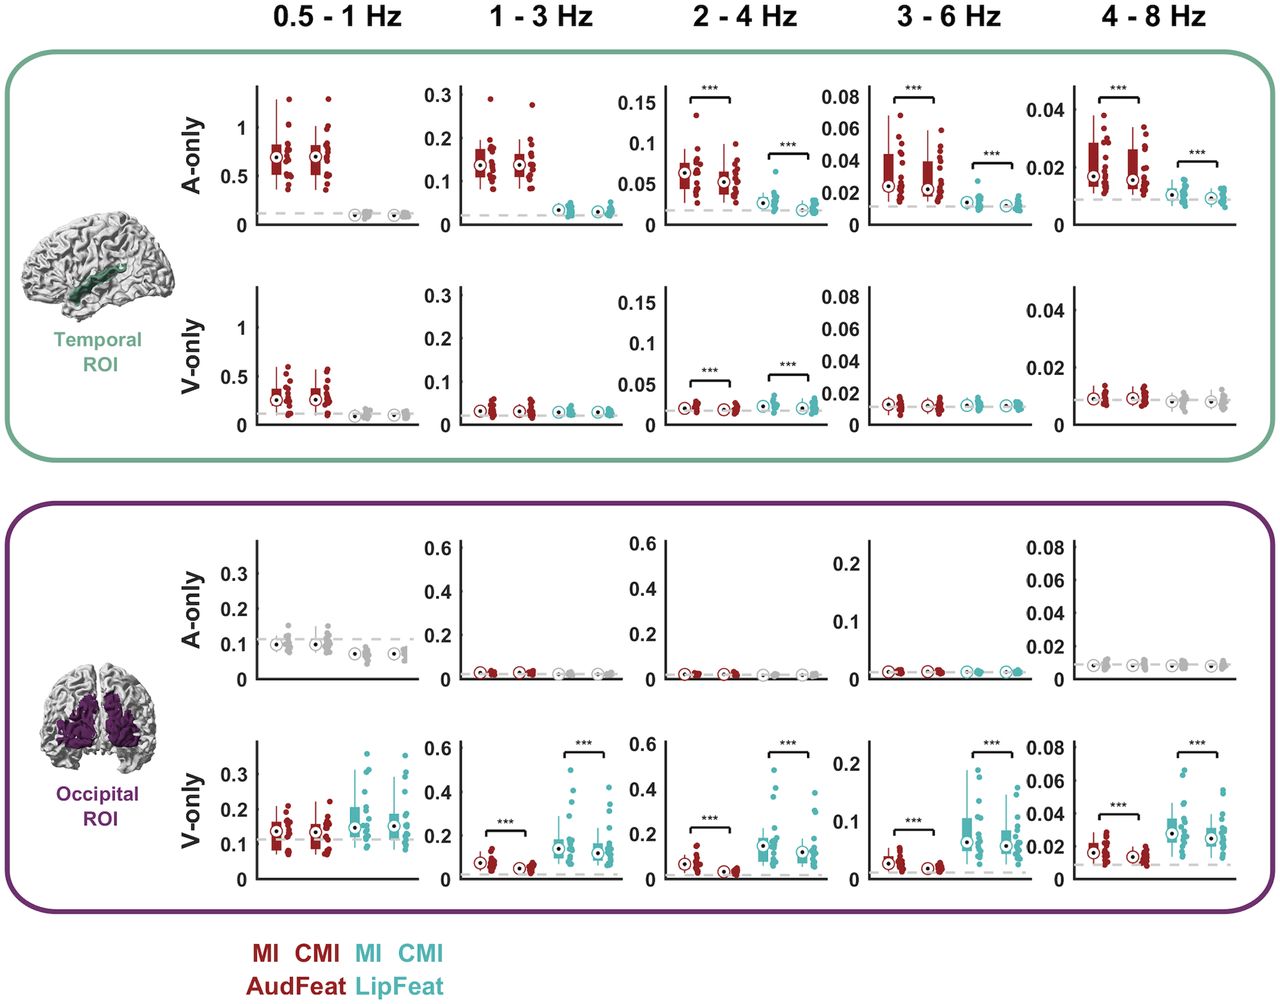
  • Figure 3.
    • Download figure
    • Open in new tab
    • Download powerpoint
    Figure 3.

    Feature tracking across ROIs and conditions. For both conditions (A-only and V-only) and ROIs (temporal and occipital) the figure illustrates the strength of feature tracking for presented and physically not-present features (MI values) and the strength of tracking after partialling out the respective other feature group (CMI values). Each panel depicts (from left to right) the MI for AudFeat, the CMI for AudFeat partialling out LipFeat, the MI for LipFeat, and the CMI for LipFeat partialling out AudFeat. Dots represent individual participants (n = 18). Bars indicate the median, 25th and 75th percentiles. The gray dashed line indicates the 99th percentile of the frequency-specific randomized maximum distribution correcting for all other dimensions. Conditions below a group-level significance threshold of 0.01 are greyed out. Brackets with asterisks indicate significant differences between MI and CMI values, based on a Wilcoxon signed-rank test (*p < 0.01, **p < 0.005, ***p < 0.001). Units for MI and CMI are in bits.
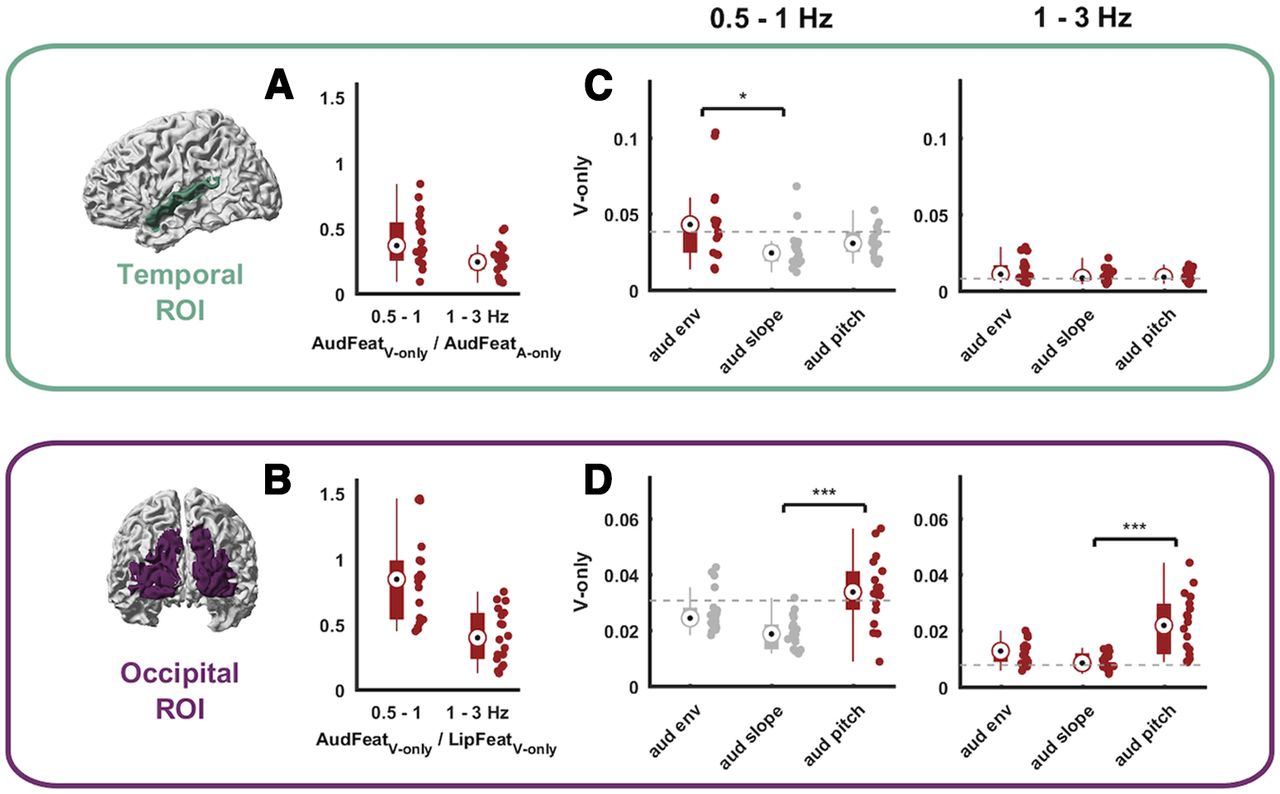
  • Figure 4.
    • Download figure
    • Open in new tab
    • Download powerpoint
    Figure 4.

    Modality dominance and tracking of individual auditory features during lip reading. A, B, Comparison of the tracking of unheard AudFeat over the tracking of the modality-preferred sensory input in each ROI (i.e., AudFeat during A-only trials in the temporal ROI; LipFeat during V-only trials in the occipital ROI). C, D, Tracking of individual auditory features during V-only trials conditioned on all other auditory and lip features in temporal (C) and occipital (D) ROIs. Brackets with asterisks indicate levels of significance from one-way Kruskal–Wallis rank test with post hoc Tukey–Kramer testing (*p < 0.01, **p < 0.005, ***p < 0.001). Dots represent individual data points. Bars indicate the median, 25th and 75th percentiles. The gray dashed line indicates the 99th percentile of the frequency-specific randomized maximum distribution correction for all other features. Units in A, B are a ratio; in C and D, units are in bits.
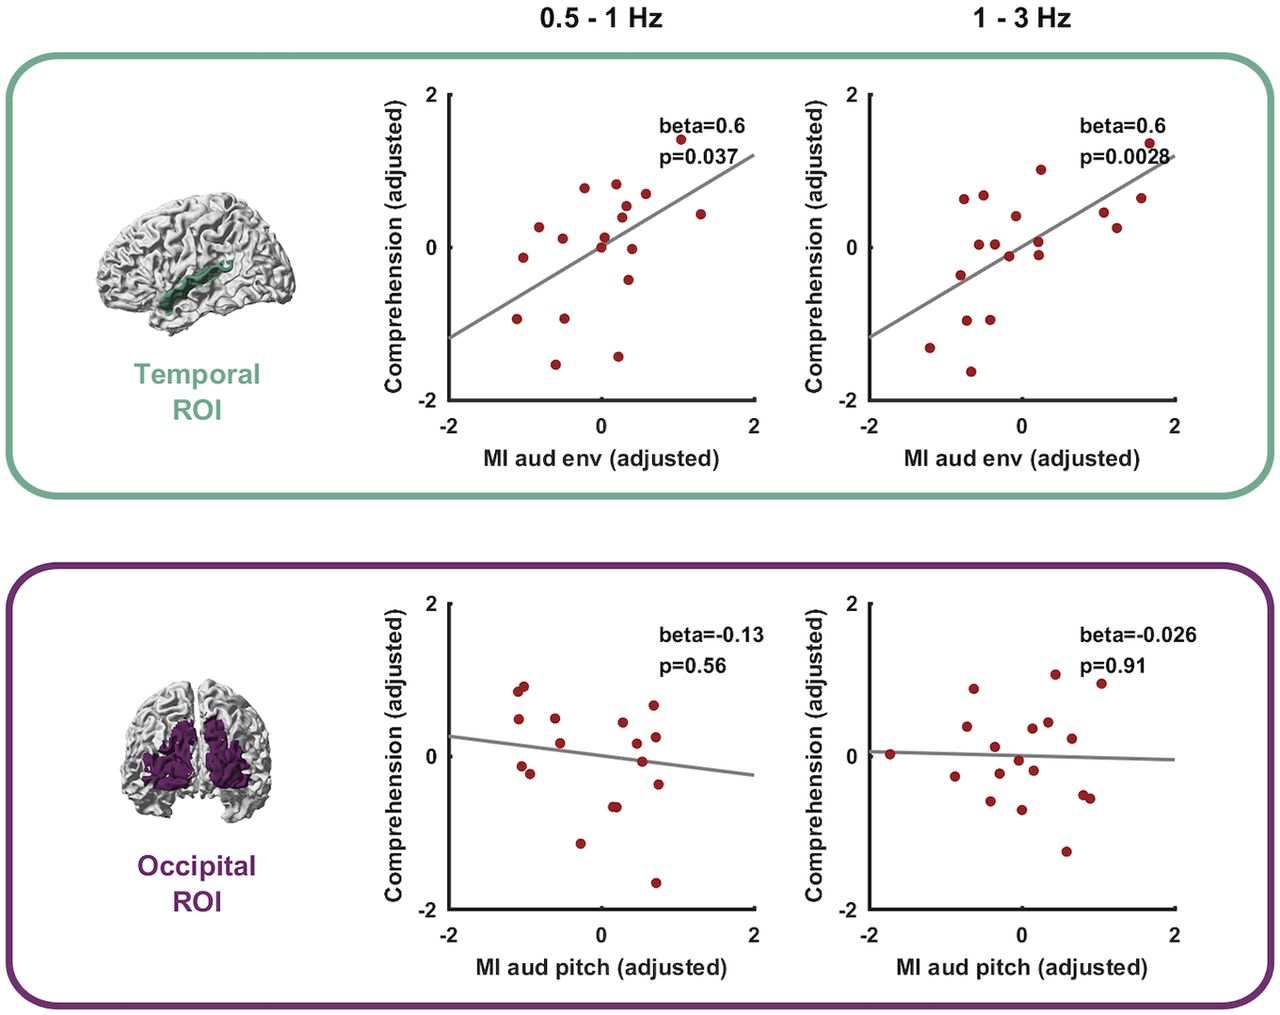
  • Figure 5.
    • Download figure
    • Open in new tab
    • Download powerpoint
    Figure 5.

    Association between lip-reading performance and tracking of auditory features. Across participants the tracking of aud env during V-only trials in the temporal ROI but not the tracking of aud pitch in the occipital ROI was significantly associated with word recognition performance (PC). Graphs show partial residual plots, dots represent individual data points and the line indicates the linear fit to the target variable from the full regression model.

Tables

  • Figures
    • View popup
    Table 1

    Feature tracking in individual anatomic areas within temporal and occipital ROIs

    0.5–1 Hz1–3 Hz
    ROIAnatomical areaAudCMIChisq; pvalLipCMIChisq; pvalAudCMIChisq; pvalLipCMIChisq; pval
    A-only trials TemporalA41/420.9727.02; 4.7e-050.0962.47; 0.590.1929.62; 2.7e-050.0325.14; 0.32
    TE1.0/1.20.560.0990.110.028
    A22c0.860.0980.180.033
    A22r0.50.0930.0950.029
     OccipitalmOccG0.13.50; 0.470.0730.66; 0.880.0252.71; 0.580.021.97; 0.66
    OPC0.090.0690.0250.02
    iOccG0.110.0680.0270.021
    msOccG0.110.0740.0290.021
    V-only trials TemporalA41/420.334.59; 0.360.15.14; 0.320.0345.24; 0.320.0271.00; 0.85
    TE1.0/1.20.250.0880.0310.028
    A22c0.340.10.0350.027
    A22r0.220.0850.0280.029
     OccipitalmOccG0.133.90; 0.440.1712.30; 0.0260.0458.20; 0.130.1514.57; 0.012
    OPC0.140.190.060.2
    iOccG0.140.20.0480.17
    msOccG0.110.110.0390.082
    • The table lists CMI values of either set of features (AudCMI, LipCMI) and a statistical comparison between the individual atlas-defined areas of the temporal and occipital ROIs [Kruskal–Wallis tests, reporting chi-squares (Chisq) and p-values (pval)]. Bold numbers indicate statistically significant results. P-values are FDR-corrected within this table.

    • View popup
    Table 2

    Feature tracking in each hemisphere

    0.5–1 Hz1–3 Hz
    ROIHemisphereAudCMIz; pvalLipCMIz; pvalAudCMIz; pvalLipCMIz; pval
    A-only trials TemporalLeft0.81.20; 0.590.094−0.33; 0.740.13−0.81; 0.590.028−1.11; 0.59
    Right0.640.0990.150.031
     OccipitalLeft0.1−0.37; 0.740.07−0.33; 0.740.0270.81; 0.590.0210.63; 0.65
    Right0.10.0720.0250.02
    V-only trials TemporalLeft0.310.89; 0.590.0980.76; 0.590.0350.85; 0.590.025−1.85; 0.26
    Right0.260.0910.030.03
     OccipitalLeft0.11−2.24; 0.20.14−2.98; 0.0460.043−1.68; 0.30.13−2.07; 0.21
    Right0.150.20.0540.18
    • The table lists CMI values of either set of features (AudCMI, LipCMI) and a statistical comparison between hemispheres of each ROI [Wilcoxon signed-rank tests, reporting z values (z) and p-values (pval)]. P-values are FDR-corrected within this table.

Back to top

In this issue

eneuro: 9 (3)
eNeuro
Vol. 9, Issue 3
May/June 16
  • Table of Contents
  • Index by author
  • Ed Board (PDF)
Email

Thank you for sharing this eNeuro article.

NOTE: We request your email address only to inform the recipient that it was you who recommended this article, and that it is not junk mail. We do not retain these email addresses.

Enter multiple addresses on separate lines or separate them with commas.
MEG Activity in Visual and Auditory Cortices Represents Acoustic Speech-Related Information during Silent Lip Reading
(Your Name) has forwarded a page to you from eNeuro
(Your Name) thought you would be interested in this article in eNeuro.
CAPTCHA
This question is for testing whether or not you are a human visitor and to prevent automated spam submissions.
Print
View Full Page PDF
Citation Tools
MEG Activity in Visual and Auditory Cortices Represents Acoustic Speech-Related Information during Silent Lip Reading
Felix Bröhl, Anne Keitel, Christoph Kayser
eNeuro 21 June 2022, 9 (3) ENEURO.0209-22.2022; DOI: 10.1523/ENEURO.0209-22.2022

Citation Manager Formats

  • BibTeX
  • Bookends
  • EasyBib
  • EndNote (tagged)
  • EndNote 8 (xml)
  • Medlars
  • Mendeley
  • Papers
  • RefWorks Tagged
  • Ref Manager
  • RIS
  • Zotero
Respond to this article
Share
MEG Activity in Visual and Auditory Cortices Represents Acoustic Speech-Related Information during Silent Lip Reading
Felix Bröhl, Anne Keitel, Christoph Kayser
eNeuro 21 June 2022, 9 (3) ENEURO.0209-22.2022; DOI: 10.1523/ENEURO.0209-22.2022
del.icio.us logo Digg logo Reddit logo Twitter logo Facebook logo Google logo Mendeley logo
  • Tweet Widget
  • Facebook Like
  • Google Plus One

Jump to section

  • Article
    • Abstract
    • Significance Statement
    • Introduction
    • Materials and Methods
    • Results
    • Discussion
    • Footnotes
    • References
    • Synthesis
  • Figures & Data
  • Info & Metrics
  • eLetters
  • PDF

Keywords

  • audiovisual
  • language
  • lip reading
  • MEG
  • speech entrainment
  • speech tracking

Responses to this article

Respond to this article

Jump to comment:

No eLetters have been published for this article.

Related Articles

Cited By...

More in this TOC Section

Research Article: New Research

  • Similarities and Distinctions between Cortical Neural Substrates That Underlie Generation of Malevolent Creative Ideas
  • The Antiarrhythmic Drug Flecainide Enhances Aversion to HCl in Mice
  • Chemogenetic Perturbation of the Posterior But Not Anterior Cerebellum Reduces Voluntary Ethanol Consumption
Show more Research Article: New Research

Cognition and Behavior

  • Dopamine receptor type 2-expressing medium spiny neurons in the ventral lateral striatum have a non-REM sleep-induce function
  • How sucrose preference is gained and lost: An in-depth analysis of drinking behavior during the sucrose preference test in mice
  • Food restriction level and reinforcement schedule differentially influence behavior during acquisition and devaluation procedures in mice
Show more Cognition and Behavior

Subjects

  • Cognition and Behavior

  • Home
  • Alerts
  • Visit Society for Neuroscience on Facebook
  • Follow Society for Neuroscience on Twitter
  • Follow Society for Neuroscience on LinkedIn
  • Visit Society for Neuroscience on Youtube
  • Follow our RSS feeds

Content

  • Early Release
  • Current Issue
  • Latest Articles
  • Issue Archive
  • Blog
  • Browse by Topic

Information

  • For Authors
  • For the Media

About

  • About the Journal
  • Editorial Board
  • Privacy Policy
  • Contact
  • Feedback
(eNeuro logo)
(SfN logo)

Copyright © 2023 by the Society for Neuroscience.
eNeuro eISSN: 2373-2822

The ideas and opinions expressed in eNeuro do not necessarily reflect those of SfN or the eNeuro Editorial Board. Publication of an advertisement or other product mention in eNeuro should not be construed as an endorsement of the manufacturer’s claims. SfN does not assume any responsibility for any injury and/or damage to persons or property arising from or related to any use of any material contained in eNeuro.