

Article Figures & Data
Figures
- Figure 1.
DATDR-PAG neurons are composed of at least two subpopulations. A, Representative fluorescent images of each marker in the DR-PAG region. Top left, DAT signal was visualized with anti-RFP antibody in DAT-Cre::Ai14 mice (yellow). Top right, TH signal was visualized with anti-TH antibody (magenta). Bottom left, VIP signal was visualized with anti-VIP antibody (cyan). Bottom right, Three signals were overlaid. TH and VIP signals were rarely overlapped. B, Pie charts showing the composition of each marker in the DR-PAG region. The percentages are calculated from four DAT-Cre::Ai14 mice.
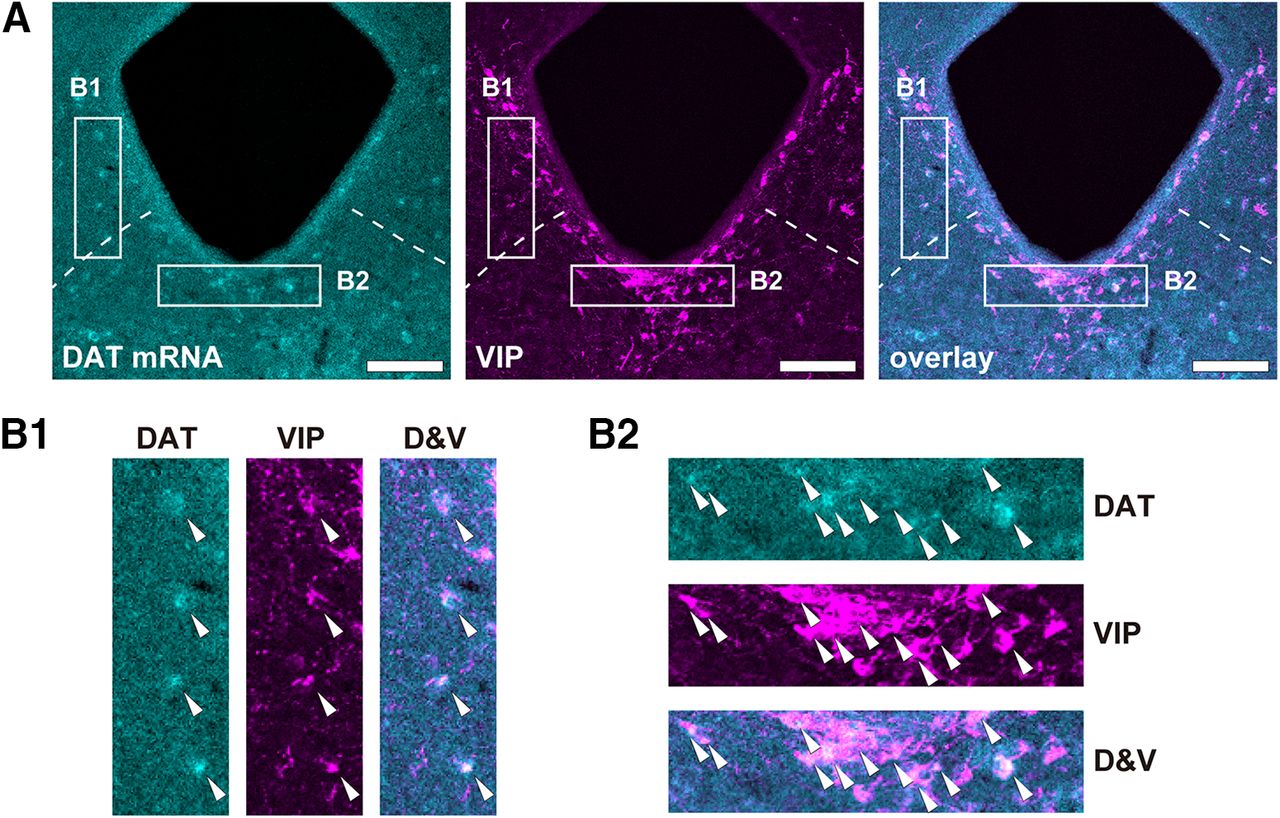
- Figure 2.
VIPDR-PAG neurons are DAT-mRNA-positive. A, Left, DAT signal was visualized with DAT in situ hybridization (cyan). Middle, VIP signal was visualized with anti-VIP antibody (magenta). Left, Two signals were overlaid. B, B1 and B2 show high-magnification images corresponding to rectangle areas B1 and B2 in panel A. White arrow heads indicate DAT and VIP double positive cell bodies. D&V represent overlaying images of DAT and VIP signals. DAT and VIP signals were colocalized in a number of neurons.
- Figure 3.
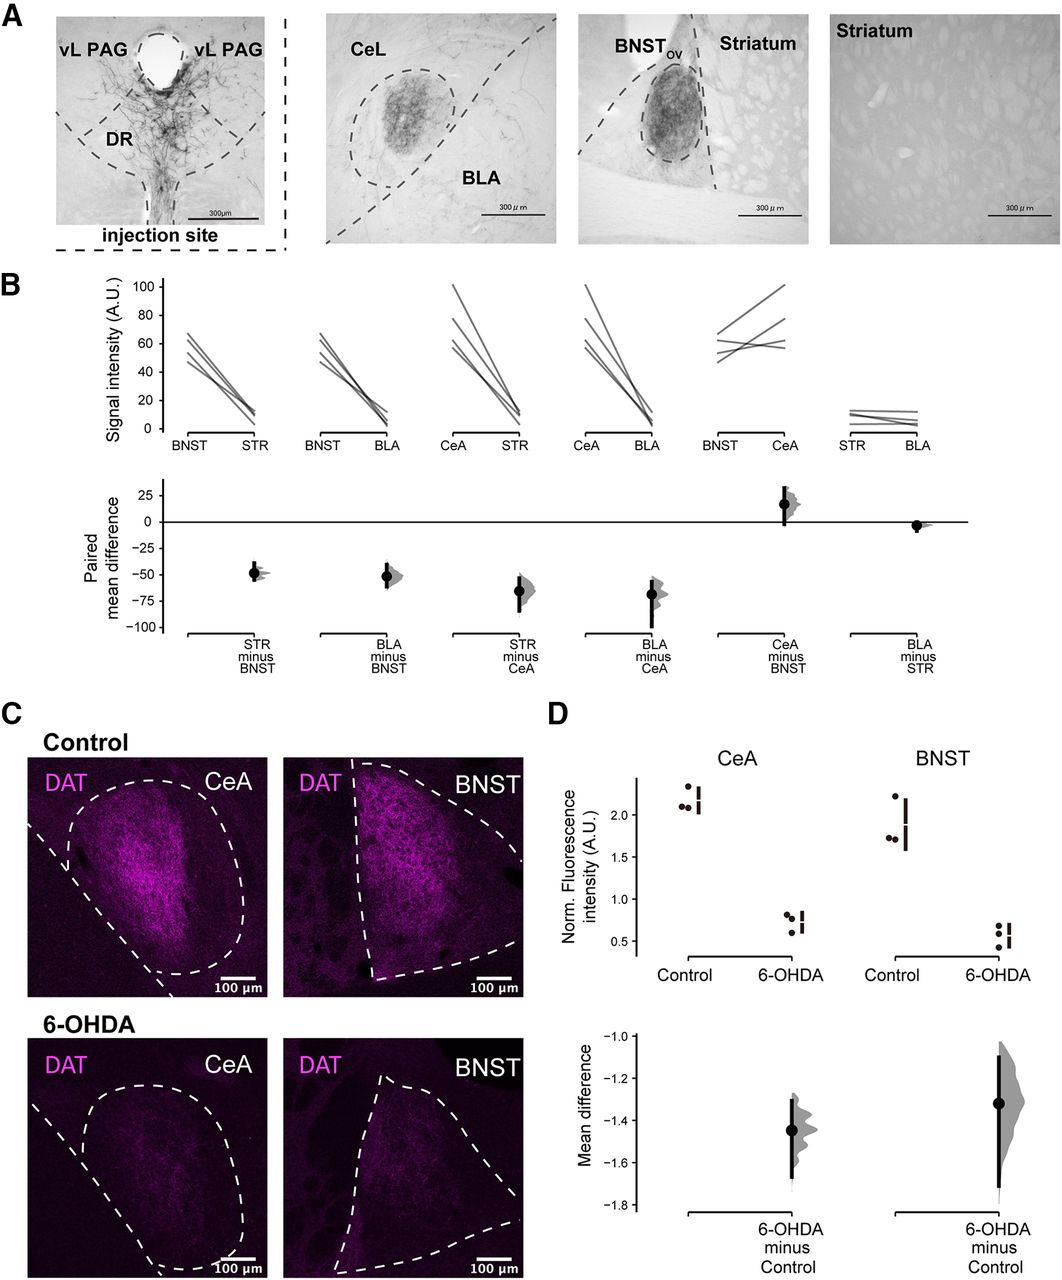
DATDR-PAG neurons innervate exclusively onto the CeL and BNSTOV, and a vast majority of DAT fibers in these regions originated from the DR-PAG. A, Representative images of AAV5-EF1α-DIO-hChR2-EYFP injection onto the DR-PAG region of a DAT-Cre mouse. EYFP signal was visualized with anti-GFP antibody following DAB staining. Top left, Injection site of the AAV onto a DAT-Cre mouse. Many DAT+ neurons were observed in this region. Top middle left, Fiber terminals were restricted in the CeL. Top middle right, Fiber terminals were restricted in the BNSTOV. Top right, No fiber was observed in the striatum. B, Paired mean differences for six comparisons are shown in the Cumming estimation plot. Signal intensities from four DAT-Cre mice are plotted on the upper axes; each paired set of observations is connected by a line. On the lower axes, each paired mean difference is plotted as a bootstrap sampling distribution. Mean differences are depicted as dots; 95% CIs are indicated by the ends of the vertical error bars. The fiber signal intensities in the BNSTOV and CeL were significantly higher than those in other regions. C, Comparison of fiber fluorescence intensities in the CeL and BNSTOV between control and 6-OHDA-injected mice. Control, In the CeL and BNSTOV, dense DAT+ fibers were observed. 6-OHDA, In contrast, DAT+ fibers were barely observed. D, Mean differences for two comparisons are shown in the Cumming estimation plot. Signal intensities from three DAT-Cre::Ai14 mice are plotted on the upper axes; each mean difference is plotted on the lower axes as a bootstrap sampling distribution. Mean differences are depicted as dots; 95% CIs are indicated by the ends of the vertical error bars. There were statistically significant differences between control and 6-OHDA-injected mice.
- Figure 4.
Summaries of the FG injection sites. A, Representative images of the FG injections into the CeA and BNST. The green signal indicates the FG signal visualized with an anti-FG antibody. The blue background signal shows fluorescent Nissl staining with PI. B, FG-injected areas are shown in the atlas for the CeA and BNST. Bold red indicates the areas commonly covered in the majority of subjects. Dim red indicates the area covered by injection at least in one animal. Atlas figures were modified from Franklin and Paxinos (2007). The distances from the bregma are indicated at the top right of each atlas.
- Figure 5.
FG retrograde tracing revealed that DAT+/TH+ neurons similarly innervate the CeA and BNST. A, Representative fluorescent images of each marker in the DR-PAG region. Top left, FG signal was visualized with anti-FG antibody in DAT-cre::Ai14 mice (cyan). Top middle, DAT signal was visualized with anti-RFP antibody (yellow). Top right, TH signal was visualized with anti-TH antibody (magenta). Bottom left, Three signals were overlaid. Bottom left, The pie chart indicates the composition of FG+ neurons (CeA injection) in the DR-PAG region. B, Representative fluorescent images of each marker in the DR-PAG region. Top left, FG signal was visualized with anti-FG antibody in DAT-cre::Ai14 mice (cyan). Top middle, DAT signal was visualized with anti-RFP antibody (yellow). Top right, TH signal was visualized with anti-TH antibody (magenta). Bottom left, Three signals were overlaid. Bottom left, The pie chart indicates the composition of FG+ neurons (BNST injection) in the DR-PAG region.
- Figure 6.
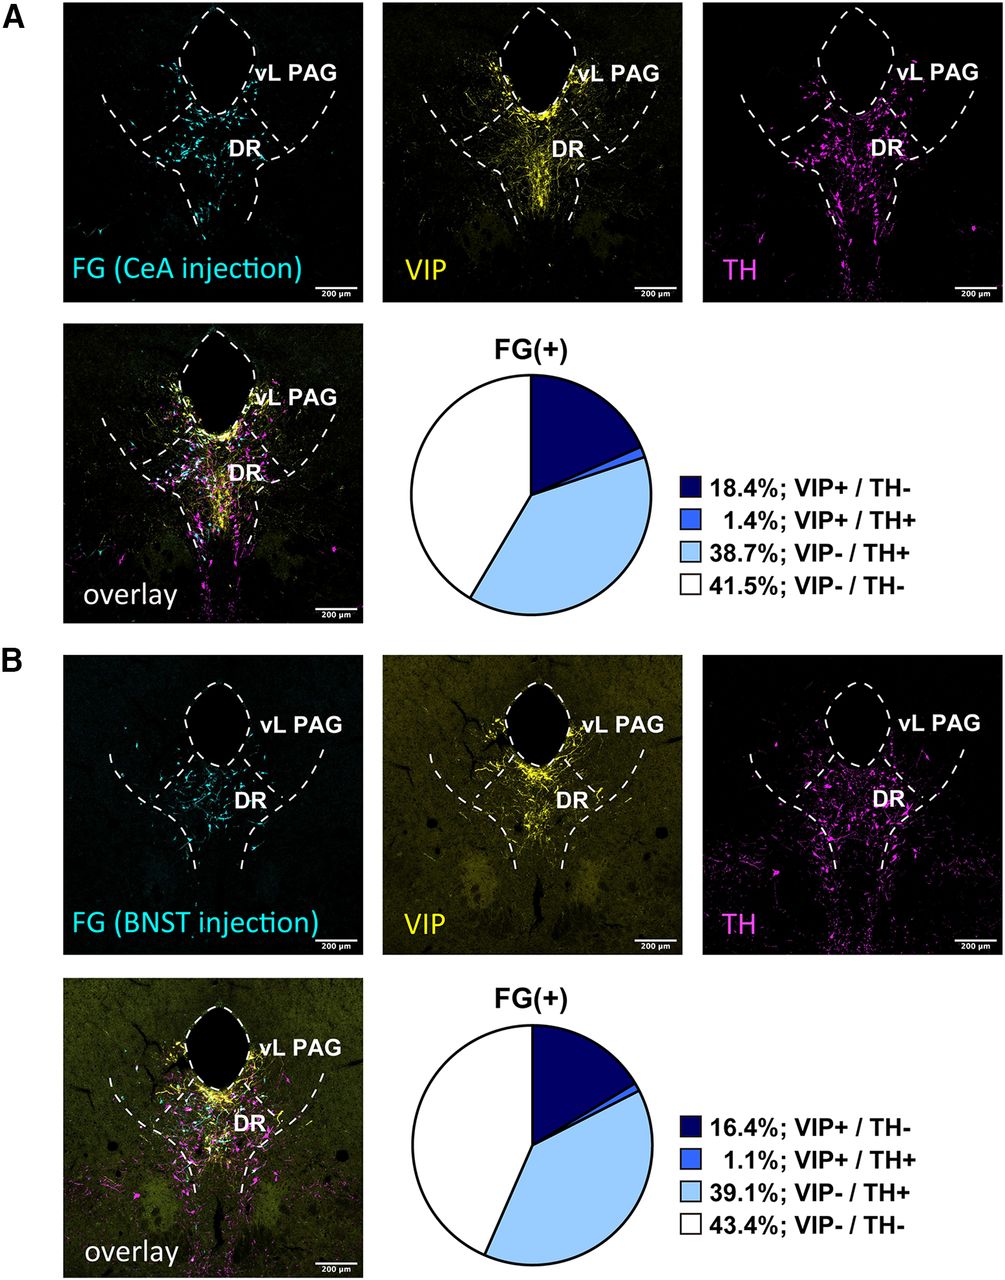
FG retrograde tracing revealed that the DAT+/VIP+ neurons similarly innervate the CeA and BNST. A, Representative fluorescent images of each marker in the DR-PAG region. Top left, FG signal was visualized with anti-FG antibody in DAT-cre::Ai14 mice (cyan). Top middle, VIP signal was visualized with anti-VIP antibody (yellow). Top right, DAT signal was visualized with anti-DAT antibody (magenta). Bottom left, Three signals were overlaid. Bottom right, The pie chart indicates the composition of the FG+ neurons (CeA injection) in the DR-PAG region. B, Representative fluorescent images of each marker in the DR-PAG region. Top left, FG signal was visualized with anti-FG antibody in DAT-cre::Ai14 mice (cyan). Top middle, VIP signal was visualized with anti-VIP antibody (yellow). Top right, DAT signal was visualized with anti-DAT antibody (magenta). Bottom left, Three signals were overlaid. Bottom right, The pie chart indicates the composition of the FG+ neurons (BNST injection) in the DR-PAG region.
- Figure 7.
FG retrograde tracing revealed that the TH+ or VIP+ neurons similarly innervate the CeA and BNST. A, Representative fluorescent images of each marker in the DR-PAG region. Top left, FG signal was visualized with anti-FG antibody (cyan). Top middle, VIP signal was visualized with anti-VIP antibody (yellow). Top right, TH signal was visualized with anti-TH antibody (magenta). Bottom left, Three signals were overlaid. Bottom right, The pie chart indicates the composition of the FG+ neurons (CeA injection) in the DR-PAG region. B, Representative fluorescent images of each marker in the DR-PAG region. Top left, FG signal was visualized with anti-FG antibody in DAT-cre::Ai14 mice (cyan). Top middle, VIP signal was visualized with anti-VIP antibody (yellow). Top right, TH signal was visualized with anti-TH antibody (magenta). Bottom left, Three signals were overlaid. Bottom right, The pie chart indicates the composition of the FG+ neurons (BNST injection) in the DR-PAG region.
- Figure 8.
FG retrograde tracing revealed that the VIP+/VGlut2+ neurons similarly innervate the CeA and BNST. A, Representative fluorescent images of each marker in the DR-PAG region. Top left, FG signal was visualized with anti-FG antibody in VGlut2-cre::Ai14 mice (cyan). Top middle, VIP signal was visualized with anti-VIP antibody (yellow). Top right, VGlut-2 signal was visualized with anti-RFP antibody (magenta). Bottom left, Three signals were overlaid. Bottom right, The pie chart indicates the composition of FG+/VIP+ neurons (CeA injection) in the DR-PAG region. B, Representative fluorescent images of each marker in the DR-PAG region. Top left, FG signal was visualized with anti-FG antibody in VGlut2-Cre::Ai14 mice (cyan). Top middle, VIP signal was visualized with anti-VIP antibody (yellow). Top right, VGlut2 signal was visualized with anti-RFP antibody (magenta). Bottom left, Three signals were overlaid. Bottom right, The pie chart indicates the composition of FG+/VIP+ neurons (BNST injection) in the DR-PAG region.
- Figure 9.
The extent of DAT protein expression is lower in the DATDR-PAG neurons. DR-PAG, Left, Staining of DAT neurons in a DAT-cre::Ai14 mouse. Many cell bodies and fibers are confirmed. Middle, With DAT in situ hybridization, dim cell bodies were confirmed in the DR-PAG region. Right, Immunostaining of DAT barely stained cell bodies in the DR-PAG region. VTA-SNc, In all three methods, strong DAT signals were confirmed. Each black scale bar indicates 300 μm.


Tables
- Table 1
Combinations of antibodies in each figure showing fluorescence images are shown in the table
Figures Combinations Figure 1 TH: mouse anti-TH-antibody + anti-mouse-IgG-antibody with Alexa Fluor 488
DAT (tdTomato): rat anti-RFP-antibody + anti-rat-IgG-antibody with Alexa Fluor 594
VIP: guinea pig anti-VIP-antibody + anti-guinea pig-IgG-antibody with Cy5Figure 2 DAT: in situ hybridization (Fast Red TR)
VIP: guinea pig anti-VIP-antibody + anti-guinea pig-IgG-antibody with Cy5Figure 5 FG: rabbit anti-FG-antibody + TSA with Alexa Fluor 488
DAT (tdTomato): rat anti-RFP-antibody + anti-rat-IgG-antibody with Alexa Fluor 594
TH: mouse anti-TH-antibody + anti-mouse-IgG-antibody with Alexa Fluor 647Figure 6 FG: rabbit anti-FG-antibody + TSA with Alexa Fluor 488
DAT (tdTomato): rat anti-RFP-antibody + anti-rat-IgG-antibody with Alexa Fluor 594
VIP: guinea pig anti-VIP-antibody + anti-guinea pig-IgG-antibody with Cy5Figure 7 FG: rabbit anti-FG-antibody + TSA with Alexa Fluor 488
TH: mouse anti-TH-antibody + anti-mouse-IgG-antibody with Alexa Fluor 594
VIP: guinea pig anti-VIP-antibody + anti-guinea pig-IgG-antibody with Cy5Figure 8 FG: rabbit anti-FG-antibody + TSA with Alexa Fluor 488
VGlut2 (tdTomato): rat anti-RFP-antibody + anti-rat-IgG-antibody with Alexa Fluor 594
VIP: guinea pig anti-VIP-antibody + anti-guinea pig-IgG-antibody with Cy5 Data structure Type of test Power a Normal distribution Permuted t test followed by Holm’s correction [95.0%CI −54.8, −38.8] b Normal distribution Permuted t test followed by Holm’s correction [95%CI −61.0, −40.3] c Normal distribution Permuted t test followed by Holm’s correction [95.0%CI −84.1, −53.2] d Normal distribution Permuted t test followed by Holm’s correction [95.0%CI −99.0, −56.5] e Normal distribution Permuted t test followed by Holm’s correction [95.0%CI −1.86, 32.4] f Normal distribution Permuted t test followed by Holm’s correction [95.0%CI −8.39, −0.933] g Normal distribution Permuted t test [95.0%CI −1.67, −1.31] h Normal distribution Permuted t test [95.0%CI −1.71, −1.1]
In this issue


