

Article Figures & Data
Figures
- Figure 1.
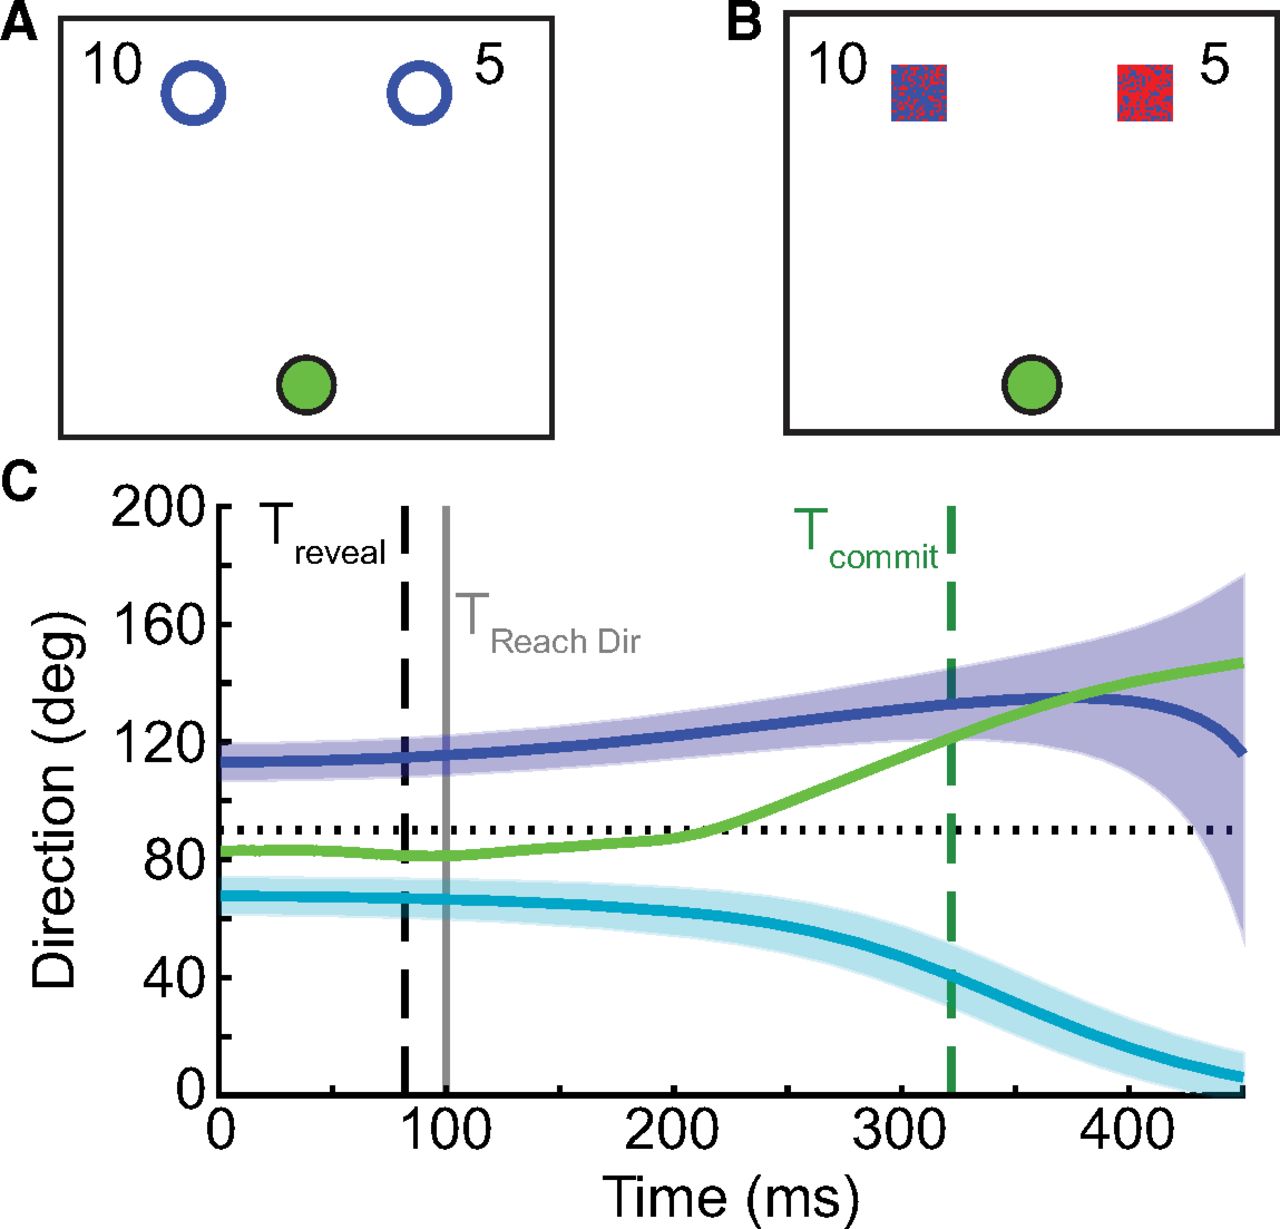
Methods for experiments 1 and 2. Participants completed a go-before-you-know task in which they observed two targets and were required to begin moving; only after they began their movement would the true target would be revealed. A, In experiment 1, one of the two target options could be correct more frequently, and the other target could result in more reward. Reward offers appeared explicitly on screen (e.g., 10 vs 5 cents, or a reward ratio of 2:1), the two targets were otherwise identical, and participants had to learn the frequency manipulation through experience. B, In experiment 2, target probability was modulated on each trial instead of blockwise frequency; target probability on the current trial was indicated by the color of the target (the degree of redness reflects the probability of being correct, e.g., 80% vs 20%). C, At each time point, the instantaneous hand direction (green) was computed relative to the direction required to be moving toward one of the two targets (blue, teal; the thick line represents the center of the target, and the shaded region represents the target width). The time at which the hand was heading directly toward one of the two target options (Tcommit, dashed green) was compared with the time when the correct target was revealed (Treveal, dashed black). If Tcommit occurred before Treveal the movement was classified as direct, otherwise it was classified as intermediate. This was estimated independently of when the initial reach direction was measured, which was always 100 ms into the reach (TReachDir, gray).
- Figure 2.
Methods for experiment 3. A, Participants completed a modified go-before-you-know task in which intermediate reaches were explicitly indicated. Specifically, starting from a home position (green), participants could reach directly to one of two near targets with no knowledge of which target was correct until after hitting the target, or they could pass through a rectangle that would cause both near targets and one of the far targets to disappear, revealing the correct far target. Both leftward or both rightward targets were “correct” on a given trial, and were assigned the same ratio of reward and likelihood. The reward offered for the far targets was a proportion of the reward available on the near targets; varying this proportion changed the relative desirability of making direct or intermediate reaches. The dashed lines were not visible to participants, but have been drawn to indicate the width of the “intermediate” rectangle relative to the far targets. B, Participants also completed a utility test in which on each trial they indicated with a button press whether they preferred a sure bet or a 50/50 gamble. C, Psychometric curves were fit to the choices made in the utility test, and the indifference point was estimated. Rightward shifts of the indifference point reflect greater risk aversion; leftward shifts reflect greater risk/reward-seeking tendency. Vertical jitter of data points was added for visualization purposes.
- Figure 3.
Reach-direction histograms for experiment 1. Initial reach direction for direct (blue bars) and intermediate (green bars) reaches (data pooled across all participants), with varying reward and frequency ratios. In all cases, the data have been aligned such that reaches to the more rewarded target are in the positive direction (rightward), and reaches to the more frequent target are in the negative direction (leftward). As the relative reward ratio increases (left to right), reaches are biased toward the more rewarded target. Likewise, as the relative frequency ratio increases (top to bottom), reaches are biased toward the more likely target. Fits reflect the average distribution parameters from bootstrapped fits to subsets of the pooled group distributions.
- Figure 4.
Estimation of biases in experiment 1. For direct reaches (A) and intermediate reaches (B), the effect of changing reward (top) or frequency (left side) alone was fit by a linear regression. These regressions were then used to predict the reach direction bias observed when both reward and frequency were changing (3 small panels; dashed arrows illustrate the estimation for one condition). Weighting the influence of frequency and reward unequally best explained the data (compare the red lines reflecting the best weighting of frequency and reward to the blue lines reflecting an equal weighting of frequency and reward). These weights indicated a much stronger influence of frequency compared with reward for direct reaches, but these factors were weighted differently for intermediate reaches.
- Figure 5.
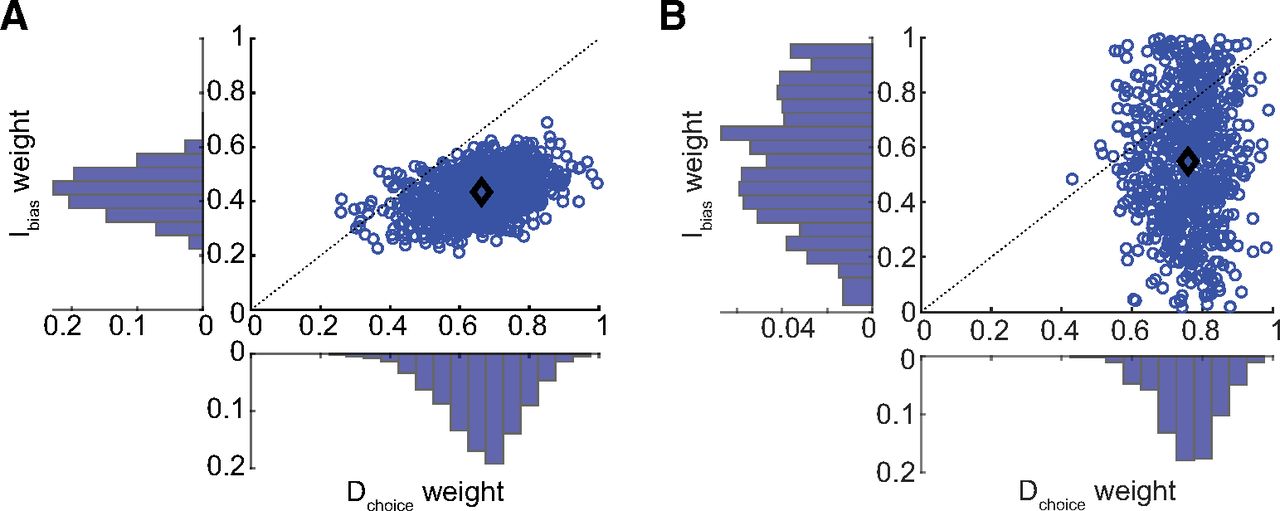
Comparison of likelihood-reward weight estimates for direct versus intermediate reaches, for experiments 1 and 2. A, The relative weighting of frequency for direct (Dchoice weight) and intermediate (Ibias weight) reaches, and their relationship (blue circles), is plotted for experiment 1. In this experiment, on average (black diamond), frequency tended to be weighed more heavily than reward for direct reaches, but the opposite weighting was observed for intermediate reaches. Such findings are consistent with an alternative analysis using a neuroeconomics-based approach (see Extended Data Fig. 5-1). B, The same weight distributions and relationships are plotted for experiment 2 (see supporting data figures for experiment 2 in Extended Data Figs. 5-2, 5-3). Although there was much greater variability of probability-reward weight estimates for intermediate reaches in this experiment, on average weighting effects in experiment 2 were analogous to those observed in experiment 1 (compare the black diamond in panels A, B).
- Figure 6.
Average reach-direction histograms for experiment 3. For each condition, individual histograms were generated for each participant and then averaged. Bar height reflects the proportion of total reaches aimed in a particular direction (bins of 5°) for a given individual in that condition; error bars reflect SEM across participants. Data were labeled according to whether individuals intercepted the rectangular “intermediate” target to hit the far targets (green bars), or reached to one of the near “direct” targets (blue bars). As in Figure 3, data were sorted such that the positive reach directions were in the direction of the more rewarded target, while negative reach directions were in the direction of the more frequent target. As the relative reward ratio increased (left to right), reaches were biased toward the more rewarded target. Likewise, as the relative frequency ratio increased (top to bottom), reaches were biased toward the more likely target. The skew in the direct-reach distributions likely arose because the intermediate “box” option was quite wide and participants had to avoid hitting it when making a direct reach.
- Figure 7.
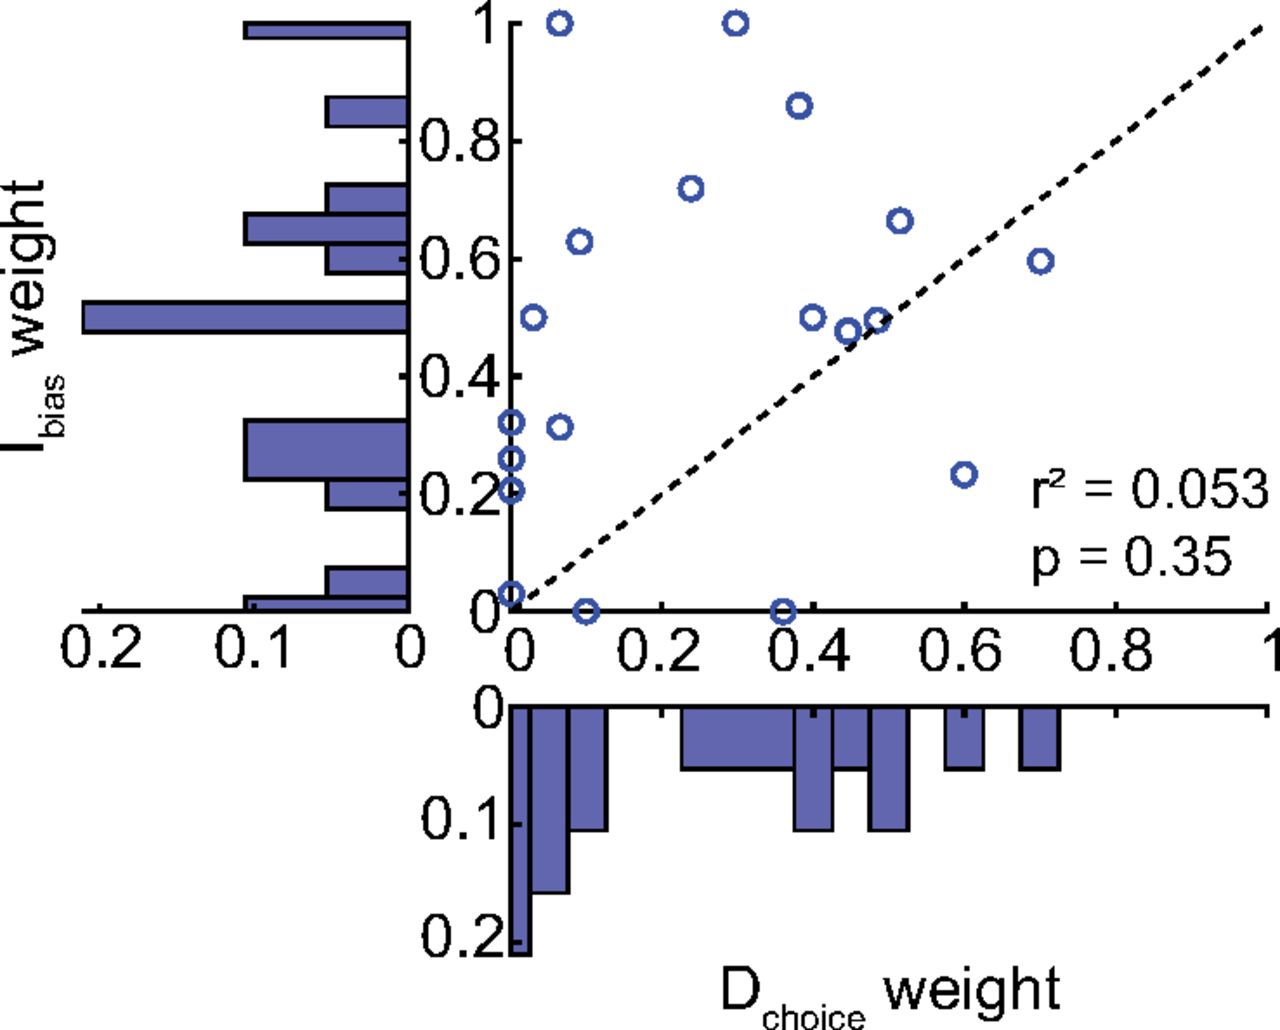
Comparison of individual likelihood-reward weight estimates for direct and intermediate reaches. As before, weights differed for direct and intermediate reaches, with no apparent systematic relationship evident. A parameter recovery analysis (Extended Data Fig. 7-1) suggests that this lack of correlation is likely not a result of the analysis method used to estimate these weights.
- Figure 8.
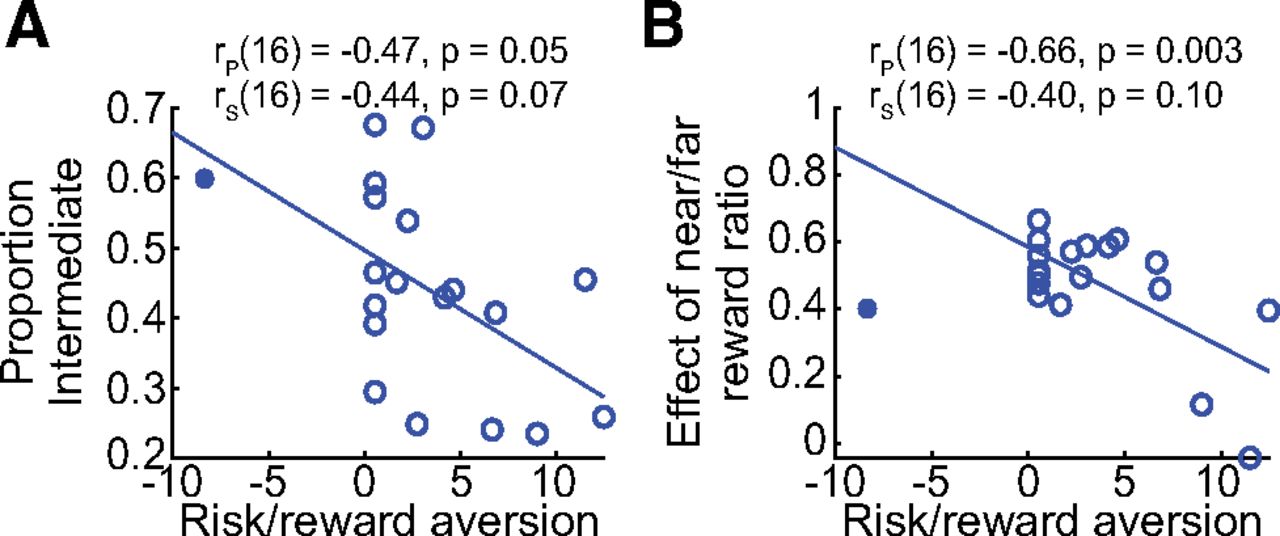
Risk/reward attitude correlated with individual differences in behavior. A, Individuals who were more risk/reward averse (i.e., larger values on the abscissa) tended to generate a greater average proportion of intermediate movements, suggesting intermediate movements may reflect a strategy to maximize reward. Both Pearson (rp) and Spearman (rs) correlations are noted. The filled circle reflects the outlier participant, who was not included in the regression estimation. B, Risk/reward-aversion tended to reduce the degree to which the relative reward ratio of near to far targets shifted the proportion of intermediate reaches produced (i.e., smaller ordinate values). The filled circle reflects the outlier participant, who was not included in the regression estimation.


Extended Data
Extended Data Figure 5-1
Subjective valuation fits for experiment 1. In addition to estimating the relative weighting of reward and likelihood on observed reach biases, we also examined the relationship between the observed reach biases and the relative subjective values of the targets in conditions when the rewards and likelihoods of the two targets were unequal. This relationship was examined both for direct reaches (A) and intermediate reaches (B). In both cases, the left panels show the distribution of power law fits to the relationship between reward ratio and the measured bias divided by the frequency ratio of the two targets. The right panel shows a histogram of the estimated value of the exponent (α) applied to the reward ratio; larger α values reflect less discounted reward relative to likelihood in determining the relative subjective values of the two targets.
The analysis presented in Extended Data Figure 5-1 is based on typical neuroeconomic analyses that model the subjective value (SV) of option i as a power law relationship, typically assuming that the target reward (R) is discounted relative to the target likelihood (P) by some power (α):
Here, we assume that the reach bias observed is proportional to the ratio of the subjective values of the two targets:
To be able to directly compare the biases for direct and intermediate reaches in this analysis, we scaled the bias on intermediate reaches (i.e., the initial reach direction) to be on the same range as direct reaches (between 0 and 1, since bias is measured as the proportion of reaches to the more rewarding target). Thus, initial reach direction on intermediate reaches was divided by the angular distance between the two targets (45°) and recentered ∼0.5.
Once the biases were rescaled, we then estimated α for both direct and intermediate reaches, for each iteration of our bootstrapped data. This was done by fitting a power law to the relationship between the reward ratio of the two targets and the bias divided by the likelihood ratio of the two targets as in Equation 2. Larger α values reflect less devaluation of target reward information relative to target likelihood information; or in other words, larger α values suggest that reward information exerts a stronger influence in determining the subjective value of the options, and hence more strongly influences the observed behavioral bias. Download Figure 5-1, EPS file.
Extended Data Figure 5-2
Reach-direction histograms for experiment 2. Initial reach direction for direct and intermediate reaches (data pooled across all participants), with varying reward and prospective-probability ratios. In all cases, the data have been aligned such that reaches to the more rewarded target are in the positive direction (rightward), and reaches to the more probable target are in the negative direction (leftward). As the relative reward ratio increases (left to right), reaches are biased toward the more rewarded target. Likewise, as the relative prospective-probability ratio increases (top to bottom), reaches are biased toward the more likely target. Fits reflect the average distribution parameters from bootstrapped fits to subsets of the pooled group distributions. Download Figure 5-2, EPS file.
Extended Data Figure 5-3
Estimation of biases in experiment 2. For direct reaches (A) and intermediate reaches (B), the effect of changing reward (top) or prospective-probability (left side) alone was fit by a linear regression. These regressions were then use to predict the reach direction bias observed when both reward and probability were changing (four small panels). Weighting the influence of probability and reward equally fit the data moderately well (blue squares); however, when the weights were allowed to vary, we obtained much better estimates (red circles). These weights indicated a much stronger influence of probability compared to reward for direct reaches, but the influence of probability and reward were weighted more similarly for intermediate reaches. Download Figure 5-3, EPS file.
Extended Data Figure 7-1
Parameter recovery analysis to evaluate the weight-estimation method. In experiment 3, weights for direct and intermediate reaches were highly uncorrelated. To examine whether this finding arose because the weights were actually uncorrelated or because the method used to estimate the weights was unreliable, we performed a parameter recovery analysis. We observed good recovery of our simulation weights (compare the median recovered weight to the simulated weight, black open circles), for both (A) direct reaches, and (B) intermediate reaches. The dashed gray line reflects the line y = x; all median recovered weight values fall close to this line. C, We also compared the recovered weights from direct and intermediate reaches to each other on each simulation repetition, where in each simulation the same weight value was used to generate both direct and intermediate reaches. Note that these points cluster also along the line y = x, suggesting that if we see a lack of relationship between the weights estimated on direct and intermediate reaches across participants, it is likely because these weights were indeed uncorrelated rather than because of an artifact introduced by the weight-estimation procedure.
For the parameter recovery analysis, we simulated the ability to accurately recover the underlying weights associated with frequency and reward biases. Biases were simulated in reach preference (direct reaches, Dchoice) and reach direction (intermediate reaches, Ibias). These biases were determined by choosing a relative weighting of likelihood and reward. On each simulated trial, we calculated the preference for choosing the more frequent target based on the current trial’s frequency ratio and the reward ratio separately (e.g., if the frequency ratio is 2:1, the preference for choosing the more frequent target is 0.67). We calculated the distance this preference was from equal preference (i.e., 0.5), and scaled that distance by the predetermined frequency or reward weighting; this yielded a frequency-biased and reward-biased preference for each target:
Then, the objective utility (probability times reward) was computed for each of the two targets based on the scaled preference values:
These expected values were normalized by the sum of the expected values for the two targets to yield the probability of choosing each target. On direct reaches, a random number was drawn; if the random number was lower than the probability of choosing Target 1, we recorded a direct-reach choice of Target 1; otherwise, we recorded a choice of Target 2. On intermediate reaches, we converted the probability of choosing Target 1 into a reach direction by multiplying by 30°, then subtracting 15° to center reaches about the midline. In this way, we could build a binary distribution of direct reaches and a continuous distribution of intermediate reaches, for every possible combination of frequency and reward ratios presented during experiment 3 (200 trials were simulated for each condition). Finally, we applied our weight estimation approach as described in Materials and Methods (computing regressions to estimate the relationship between frequency ratio and bias and reward ratio and bias separately, then finding the best weighting of these regressions to explain the bias observed when both frequency and reward ratios were not equal to 1) to recover the degree to which frequency was weighted across simulated trials (Dchoice and Ibias). We repeated this simulation for 100 iterations at each of nine frequency-reward weightings (0.1–0.9). We compared the recovered weighting to the actual weighting for both direct and intermediate reaches separately, as well as comparing the recovered weightings for direct reaches versus intermediate reaches (since on each repetition both direct and intermediate reaches were simulated from the same underlying weights). Download Figure 7-1, EPS file.
In this issue


