

Abstract
The marble burying test is a commonly used paradigm to describe phenotypes in mouse models of neurodevelopmental and psychiatric disorders. The current methodological approach relies predominantly on reporting the number of buried marbles at the end of the test. By measuring the proxy of the behavior (buried marbles), many important characteristics regarding the temporal aspect of this assay are lost. Here, we introduce a novel, automated method to quantify mouse behavior during the marble burying test with the focus on the burying bouts and movement dynamics. Using open-source software packages, we trained a supervised machine learning algorithm (the “classifier”) to distinguish burying behavior in freely moving mice. In order to confirm the classifier’s accuracy and characterize burying events in high detail, we performed the marble burying test in three mouse models: Ube3am-/p+ [Angelman syndrome (AS) model], Shank2−/− (autism model), and Sapap3−/− [obsessive-compulsive disorder (OCD) model] mice. The classifier scored burying behavior accurately and consistent with the previously reported phenotype of the Ube3am-/p+ mice, which showed decreased levels of burying compared with controls. Shank2−/− mice showed a similar pattern of decreased burying behavior, which was not found in Sapap3−/− mice. Tracking mouse behavior throughout the test revealed hypoactivity in Ube3am-/p+ and hyperactivity in the Shank2−/− mice, indicating that mouse activity is unrelated to burying behavior. Reducing activity with midazolam in Shank2−/− mice did not alter the burying behavior. Together, we demonstrate that our classifier is an accurate method for the analysis of the marble burying test, providing more information than currently used methods.
- activity characteristics
- anxiolytics
- automated classification
- burying characteristics
- marble burying test
- open-source tools
Significance Statement
The marble burying test is widely used in phenotyping neurodevelopmental and neuropsychiatric disorder mouse models. Currently, its analysis consists largely of manually scoring the number of buried marbles on the completion of the assay. This approach is not standardized across laboratories, and leaves out important variables such as movement characteristics and information about the burying bouts. We introduce a method that reliably tracks mouse behavior throughout the experiment, classifies the duration and number of the burying bouts, and is generalizable across laboratories. Using machine learning for measuring the actual burying behavior standardizes this method, and provides rich information about the burying characteristics and overall behavior.
Introduction
The marble burying test (Pinel and Treit, 1978) is a commonly used paradigm, aimed at studying repetitive behavior as well as an anxiety-like phenotype (Broekkamp et al., 1986; Thomas et al., 2009; Angoa-Pérez et al., 2013). It has more recently been used to study models of neuropsychiatric and neurodevelopmental disorders, with over 87% of studies being done in mice (Çalişkan et al., 2017). The behavioral meaning of marble burying is however highly debated throughout literature. Studies have found that burying behavior can be selectively inhibited by some anxiolytics and antidepressants (Ichimaru et al., 1995; Nicolas et al., 2006; Wise et al., 2012) in a dose-dependent manner. However, results show no correlation with “anxiety-related” responses in the open-field or light–dark tests (such as elevated plus maze), nor are they correlated with overall exploratory activity (Thomas et al., 2009). Marble burying and digging-event frequency were found to correlate only on the first 2 out of 5 d of repeated testing, showing a dissociation between burying and digging behavior (Thomas et al., 2009; Taylor et al., 2017). Same studies show that mice tend to decrease the number of buried marbles when tested multiple times within 1 d.
The most commonly used scoring method focuses only on the number of buried marbles. In this classical approach, mice are removed from the apparatus at the end of testing and an experimenter assesses visually how many marbles are covered more than a chosen threshold. This threshold varies throughout literature but is commonly set at a marble being either 50% or two-thirds covered by bedding to be considered buried (Thomas et al., 2009; Angoa-Pérez et al., 2013; Kalariya et al., 2015; Sonzogni et al., 2019). The main benefit of this method is high throughput because of the short analysis time needed. It has also been shown to be highly consistent within a given mouse model (Sonzogni et al., 2018). This visual assessment method is used in the vast majority of published studies (de Brouwer et al., 2019). However, several research groups added additional analysis in the efforts to better describe the marble burying results. The most common adaptations are: (1) post hoc manual assessment of photographs taken before and after the test (Homma and Yamada, 2009); (2) analysis of the interobserver reliability (Kinsey et al., 2011); (3) automated tracking of mouse mobility during the test (Nicolas et al., 2006; Serra et al., 2021). Although these methods indeed provide additional information about mouse behavior, they are not widely adopted and they do not quantify the spatio-temporal characteristics of the burying bouts. A few studies, which report burying and digging events, label them by manually annotating the video frames (Wright-Williams et al., 2013; Smith et al., 2014; Serra et al., 2021), which is an accurate but highly time-consuming method.
Automated classification of behaviors based on machine learning algorithms provides a way to study animal behaviors over time in high detail (Kabra et al., 2013; Pereira et al., 2019; Wiltschko et al., 2020). In the last few years, this technique has been used to identify social and locomotor behaviors in mice (van den Boom et al., 2017), and other species (Aso et al., 2014; Blut et al., 2017). Although lower throughput than visual inspection, the collected videos can be analyzed in a batch mode, significantly speeding up the analysis process, and once trained, the classifiers can be used across many experiments.
Here, we used supervised machine learning to train a classifier to provide a method for repeatable inter-experimenter and intra-experimenter scoring of burying behavior that gives additional information regarding spatial and temporal burying characteristics. To test the accuracy of the classifier, we evaluated whether it was adept at detecting the established burying phenotype in a mouse model of Angelman syndrome (AS; Ube3am-/p+; Huang et al., 2013; Sonzogni et al., 2018; Wang et al., 2018). Using an automated video tracking software in combination with our classifier we were able to detect the clear hypoactivity phenotype of the Ube3am-/p+ mice and determine the spatial characteristics of the burying events.
Furthermore, we used our classifier to describe the characteristics of burying behavior in the Shank2−/− model of autism spectrum disorder (ASD; Schmeisser et al., 2012; Won et al., 2012) and the Sapap3−/− model of obsessive-compulsive disorder (OCD; Welch et al., 2007), two additional mouse models known for repetitive and compulsive-like/anxious behaviors, respectively. We observed that burying behavior was not increased for Shank2−/− and Sapap3−/− mice. Additionally, burying behavior was found to be independent of locomotor activity patterns in those models since application of an anxiolytic drug, midazolam, decreased the hyperactivity phenotype in Shank2−/− mice but did not significantly alter the burying behavior. Our novel method provides rich information about the burying characteristics and overall behavior and can be adapted to many experiments across different laboratory settings.
Materials and Methods
Experimental procedures
All experimental animal procedures were approved a priori by an independent animal ethical committee (DEC-Consult, Soest, The Netherlands), as required by Dutch law and conform to the relevant institutional regulations of the Erasmus Medical Center, the Netherlands Institute for Neuroscience KNAW, and Dutch legislation on animal experimentation (CCD approval: AVD1010020197846, AVD101002016791, and AVD801002015126).
Animals
We used male and female mice of the following strains: (1) Ube3a m-/p+ (Ube3atm2Yelg; Wang et al., 2018) mice (27.13 ± 0.78 g, seven males and five females) and their wild-type (WT) littermates (24.07 ± 1.03 g, six males and six females); (2) Shank2−/− mice (20.1 ± 0.97 g, five males and five females for standard marble burying tests and eight males for pharmacological testing) and their WT littermates (22.1 ± 0.69 g, five males and five females; Schmeisser et al., 2012; Won et al., 2012); (3) Sapap3−/− mice (eight males and four females) and their WT littermates (10 males and two females, Welch et al., 2007). Strain 1 was generated in the F1 hybrid 129S2-C57BL/6J background. Strains 2 and 3 were bred on a C57BL/6J background.
Strains 1–2 were between 8 and 12 weeks of age and were housed and tested in the Erasmus Medical Center Rotterdam, The Netherlands. Animals had ad libitum access to water and food (standard laboratory chow) and were kept on a regular 12/12 h light/dark cycle. Shank2−/− mice and their WT littermates were group-housed (three mice per cage, mixed genotypes in the same cage). Ube3am-/p+ mice and their WT littermates were group-housed (three mice per cage, mixed genotypes in the same cage). All mice from strains 1–2 were kept on wood chip bedding (Lignocel Hygienic Animal Bedding, JRS), with a density of 204 g/l, which was also used for the experiments.
Sapap3−/− mice as well as their WT littermates (strain 3) were between 8 and 18 weeks of age and were housed and tested at the Netherlands Institute for Neuroscience, Amsterdam, The Netherlands. Animals had ad libitum access to water and food (standard laboratory chow) and were group housed on a regular 12/12 h light/dark cycle. The Sapap3−/− mice and their littermates were kept on corn-cob bedding (Bio Services EuroCob Corn), with a density of 566 g/l, that was also used for the experiments.
Behavioral testing
Animals were habituated to the testing room for at least 1 h before experiments. To isolate external factors, all experiments were done inside a 130 × 80 × 80 cm wooden box with a door. The 6 mm high-pressure laminate walls were lined with acoustic foam to reduce external noise penetration. Testing was done in a 26.6 × 42.5 × 18.5 cm cage (Eurostand 1291H-type III H) which rested on an elevated 10-mm frosted Perspex shelf. The apparatus was evenly lit from top and bottom using white LED strips and recorded with an overhead camera (Basler acA1300-600gm) with a 4.4–11 mm/F1.6ens (KOWA) at 25 frames per second. Testing cages were filled with wood chip bedding (Lignocel Hygienic Animal Bedding, JRS) for strains 1–2, and corn-cob bedding (Bio Services EuroCob Corn) for strain 3, to the height of ∼4 cm. Next, 20 blue glass marbles were spaced out evenly in four rows on the bedding. The recordings were started immediately after the animals were placed in the cage, using a custom Bonsai script (Lopes et al., 2015). The animals were left to explore the apparatus for 30 min, after which the mice were removed and a top-down image of the marbles was taken. The bedding was discarded and the cages were cleaned with 70% ethanol between each experiment.
Pharmacological testing
Animals were acclimated to the testing room for at least 1 h before experiments. Midazolam (1 mg/kg) was dissolved in physiological saline (0.9%). Injections were given through the intraperitoneal route of administration in a volume of 5 μl/g of body mass. On day 1 of pharmacological testing, four mice received a saline injection whereas the other four mice received a midazolam injection. Animals received intraperitoneal injections 30 min before the test. Following the marble burying test, animals were given 1 d of rest. On day 3, mice that previously received saline injections were injected with midazolam, and mice that previously received midazolam injections received a saline injection, allowing for within-animal saline-dug comparison.
Manual scoring of burying behavior
Manual annotation of four 10-min videos was done by four observers using the open-source software BORIS (Friard and Gamba, 2016), which allowed for frame-by-frame annotation.
Classifier training
A classifier to study burying behavior was created in the open source, MATLAB (MathWorks, R2018a) based Janelia Automatic Animal Behavior Annotator (JAABA; v0.6) environment (Kabra et al., 2013). Videos were prepared by cropping raw images to the area of the apparatus using FFMPEG (https://www.ffmpeg.org/). To prepare the data for classifier training, the videos were then tracked using open-source software MATLAB based Mouse Tracker (motr; Ohayon et al., 2013). All videos were processed and tracked in a batch-mode, significantly decreasing the processing time. The output data from motr were converted to the required format for JAABA by using the function “PrepareJAABA.” Version 0.6.0 of JAABA was obtained from SourceForge (http://jaaba.sourceforge.net/). The classifier was trained on 13,203 frames in three videos of Shank2−/− mice and two videos of their WT littermates. Not all frames were annotated to get a relatively equal distribution of burying and non-burying frames. A minimum bout length of one second was applied for the analysis of burying characteristics. The trained classifier is available at https://doi.gin.g-node.org/10.12751/g-node.syheka/. However, to obtain maximum accuracy, we recommend training a custom classifier on newly acquired videos as the experimental conditions such as light, cage dimensions, mouse color and bedding can differ across laboratories. The classifier can then be used for all newly acquired videos.
To obtain information regarding movement characteristics, all videos were tracked using open-source software Optimouse (Ben-Shaul, 2017). All videos were tracked in a batch-mode, which significantly decreased the processing time. The (x,y) position data from Optimouse were combined with the frame by frame output of JAABA to create heatmaps of burying topography using a custom-written MATLAB script.
Image analysis
A custom script to analyze buried marble surface area was created in ImageJ (https://imagej.nih.gov/ij/). The marbles are separated from the background with the use of color thresholding, after which the masked-out surface area can be measured per marble.
Code accessibility
The code/software described in the paper is freely available online at https://github.com/BaduraLab/Marble-Burying. The ImageJ code is available as Extended Data 1. The classifier is deposited at https://doi.gin.g-node.org/10.12751/g-node.syheka/.
Extended Data 1
Marble surface area color macro. Download Extended Data 1, TXT file.
Data processing and statistics
All data were processed using Microsoft Excel and custom MATLAB scripts, on a Windows 10 64-bit computer. Statistical group comparisons were done using GraphPad Prism 8 software. The assumption of normality was tested using the D’Agostino–Pearson test. For pharmacological testing the Shapiro–Wilk test was used to determine normality. For nonpaired data, if the data passed the assumption of normality, a one-tailed or two-tailed t test was used to compare groups. If the assumption of normality was violated, a one-tailed or two-tailed Mann–Whitney test was used. For paired data, if the data passed the assumption of normality, a paired t test was used. If the assumption of normality was violated, a Wilcoxon test was used.
Results
Classification performance
We collected five videos of marble burying (30 min/25 fps each) from three male Shank2−/− and two female Shank2−/− mice of 14–18 weeks old in our custom-built marble burying setup (for details, see Materials and Methods). We preprocessed the videos by cropping them to the size of the marble burying arena using FFMPEG (https://www.ffmpeg.org/) and subsequently tracked the mice using open source Mouse Tracker (motr; Ohayon et al., 2013). Next, we transferred the videos to the JAABA environment (Kabra et al., 2013) and trained the classifier to discriminate the burying events. Cross-validation of frames labeled by experimenters during training of the classifier showed that the classifier achieved a classification accuracy of 83.1% for correctly annotating burying frames and 83.9% for non-burying frames (Fig. 1A). Manual annotation of four 10-min videos by four independent observers blinded to genotype showed high variability in the reported average bout duration between observers (Fig. 1B). There was a significant overlap in the annotation made by the observers and the classifier (Fig. 1C). Overall, the observers annotated less frames as burying-positive than the classifier (Fig. 1D).
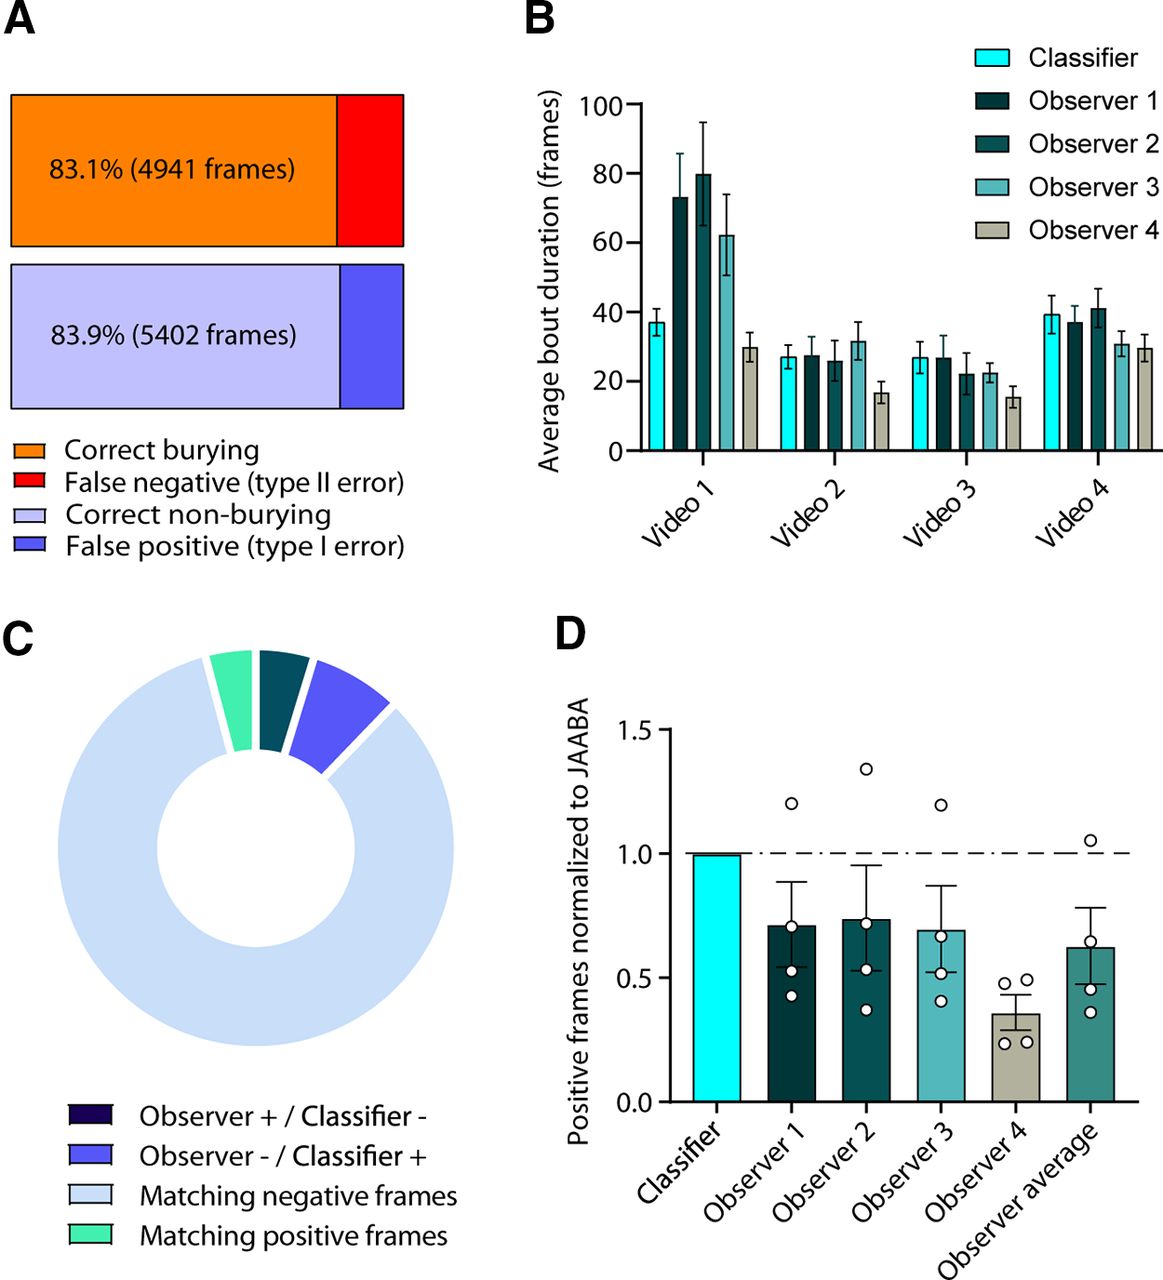
Classifier validation. A, Cross-validation results of 13,203 manually-annotated frames. The orange bar represents correct annotation of frames containing burying, while red represents frames incorrectly scored as burying by the classifier. Light-blue bar represents correct annotation of non-burying frames, whereas dark-blue shows incorrectly annotated non-burying frames. B, Average duration of bouts in four videos of 10 min in duration, manually scored by four observers. C, Pie chart depicts (1) frames that observers scored as burying, whereas the classifier scored non-burying (Observer + / Classifier −); (2) frames that observers scored as non-burying, whereas the classifier scored burying (Observer − / Classifier +); and (3/4) non-burying and burying frames where observers were in consensus with the classifier (Matching positive/negative frames). D, Frames scored positive for burying by the observers normalized to the results of the classifier. Each dot represents a single video annotated by an observer.
Classification validation in the Angelman mouse model
In order to validate the results from the classifier, we chose a mouse model with a well-documented phenotype in the marble burying test. Ube3a mutant mice (Ube3am-/p+) are a model for AS, which have consistently shown impaired marble burying behavior (Sonzogni et al., 2018; Rotaru et al., 2020).
All videos were collected and processed as described above and in Materials and Methods. Using our classifier, we indeed found that Ube3am-/p+ mice (n = 12) spent less time burying than their WT littermates (n = 11; p = 0.0175), which was caused by a trend in the decreased number of bouts (p = 0.0735) as well as shorter average bout duration (p = 0.0405; Fig. 2A,B). Next, we used open-source software Optimouse (Ben-Shaul, 2017) to analyze movement characteristics independent of the burying behavior. Ube3am-/p+ mice traveled significantly less distance (p = 0.0011) during the marble burying test and were significantly slower (n = 12 both genotypes; p = 0.0004; Fig. 2C), showing decreased locomotor activity consistent with previous findings (Sonzogni et al., 2018). By combining the output of the tracking software with the output of the classifier we created heatmaps illustrating spatial information regarding burying events. Both Ube3am-/p+ mice as well as their WT littermates had a strong preference for moving in the corners of the apparatus (Fig. 2D, top). However, while the WT mice predominantly buried in the corners, the burying behavior of Ube3am-/p+ mice was less spatially specific (Fig. 2D, bottom).
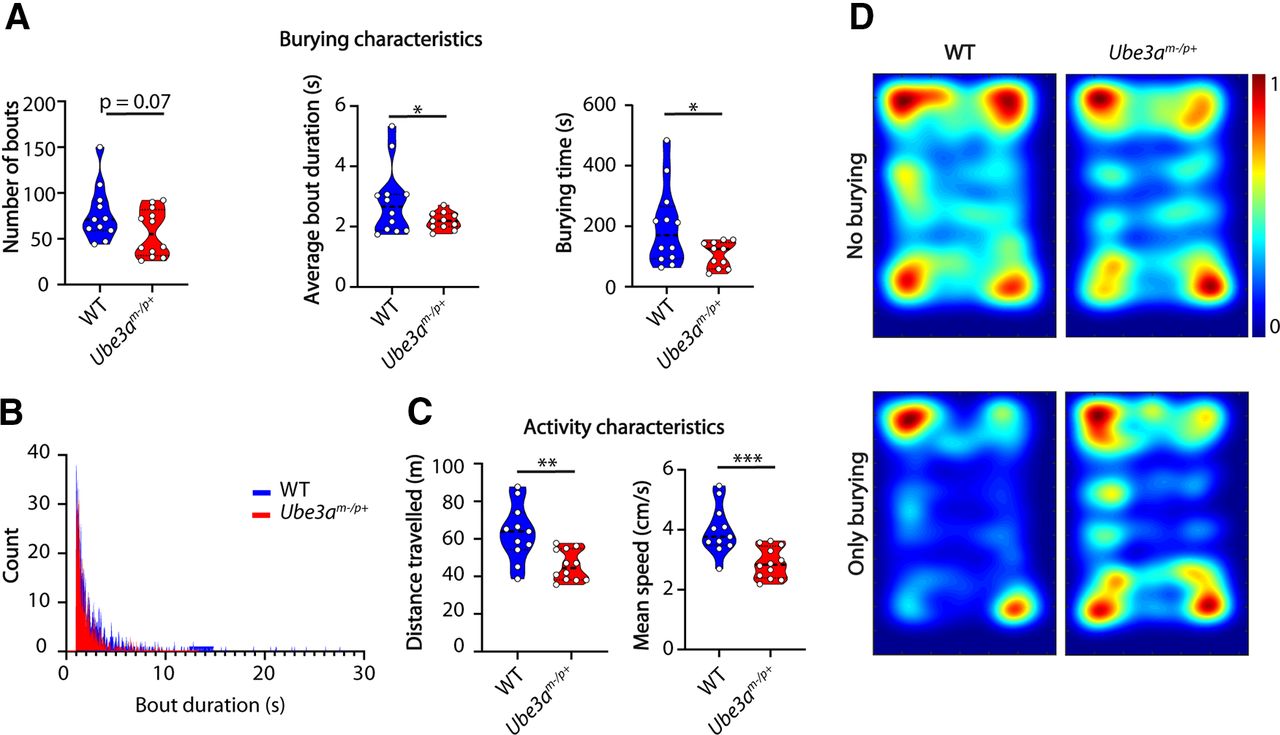
Ube3a mutants show a burying phenotype consistent with literature. A, Number of bouts, average bout duration, and total burying time for WT and Ube3am-/p+ mice during the marble burying test. Data presented as median with interquartile range (number of bouts, one-tailed Mann–Whitney test; average bout duration and total burying time, two-tailed, unpaired t test). B, Histogram showing distribution of bout lengths and their frequency. C, Distance traveled and mean speed over the duration of the test. Data presented as median with interquartile range (one-tailed, unpaired t test). D, Heatmaps showing all frames where mice do not bury (top) and frames where mice show burying behavior (bottom); *p ≤ 0.05, **p ≤ 0.01, ***p ≤ 0.001, n = 12 mice per genotype except for the WT group where n = 11 for A, B, D because of erroneous motr tracking coming from an artifact of the experimenter’s hand in the field of view.
Quantification of complex parameters reveals unique features of marble burying behavior
Burying behavior in the marble burying test is often ascribed to anxiety-like behaviors and/or repetitive behaviors, but conclusive evidence for either type of behavior is lacking. Because our methodological approach enables measuring several behavioral parameters in one assay, we performed the marble burying experiments with two additional mouse models to study this further.
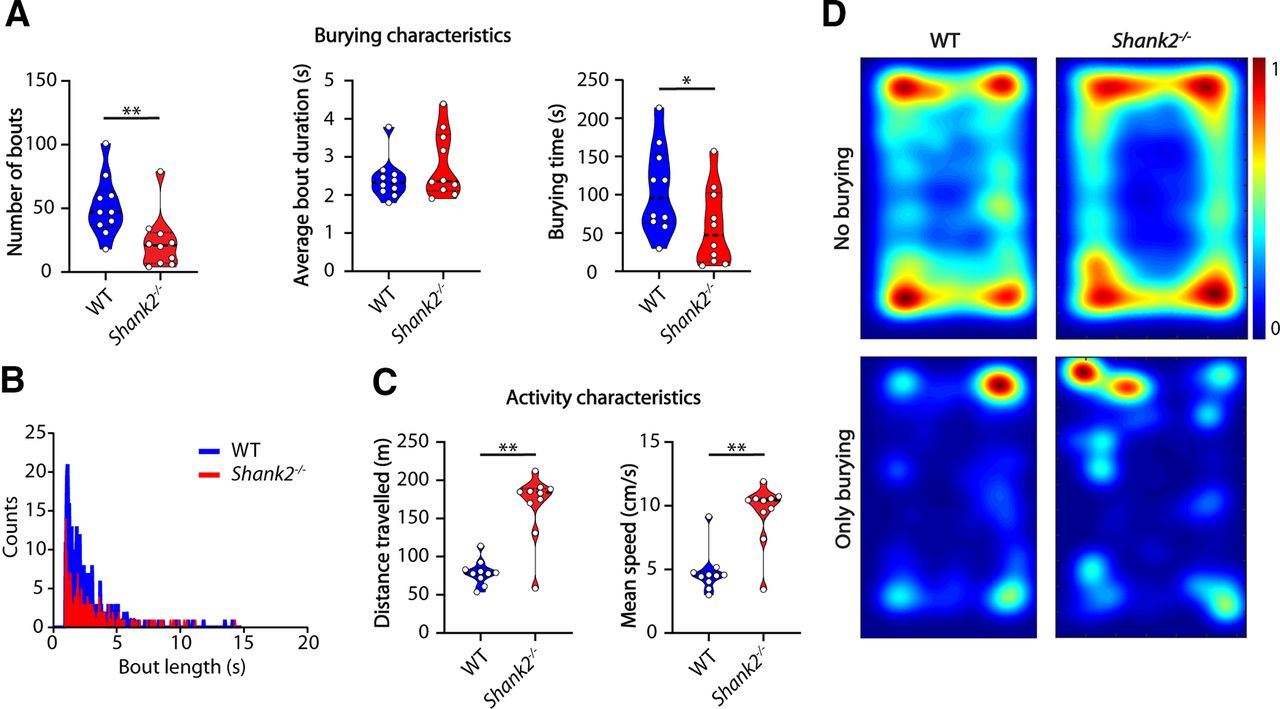
We first tested mice with a mutation in the Shank2 gene, an established mouse model for ASD (Peter et al., 2016; Eltokhi et al., 2018; Kim et al., 2018), that consistently display increased repetitive behavior in the grooming assay and hyperactivity (Schmeisser et al., 2012; Peter et al., 2016). In the marble burying test however, Shank2−/− mice (n = 10 mice per genotype) showed a significant decrease in the number of burying bouts (p = 0.0032) and total burying time (p = 0.0309; Fig. 3A). There was no difference in average bout length (p = 0.2894), reflected in no visible difference in shape of the distribution of bout durations (Fig. 3B). Therefore, we can conclude that the decrease in the number of burying bouts was evenly distributed across shorter and longer bouts. The hyperactivity phenotype was clearly present in the marble burying test as Shank2 mutants traveled larger distances (p = 0.0005) at a higher speed (p = 0.0008; Fig. 3C). Shank2−/− mice hyperactivity was evident from the heatmaps, with minor differences in spatial distribution of the burying events when compared with WT littermates (Fig. 3D).

Shank2 mutants show decreased number of bouts but similar bout duration compared with WTs. A, Number of bouts, average bout duration, and total burying time shown for WT and Shank2 mutant mice during the marble burying test. Data presented as median with interquartile range (number of bouts and average bout duration, one-tailed Mann–Whitney test; burying time, one-tailed, unpaired t test). B, Histogram showing distribution of bout lengths and their frequency. C, Distance traveled and mean speed over the duration of the test. Data presented as median with interquartile range (one-tailed Mann–Whitney test). D, Heatmaps showing all frames where mice do not bury (top) and frames where mice do bury (bottom); *p ≤ 0.05, **p ≤ 0.01; n = 10 mice per genotype.
To further test how hyperactivity might influence the burying behavior in Shank2−/− mice and whether decreased burying behavior can be rescued by decreasing locomotor activity, we assessed within-animal performance change in the marble burying test as a result of midazolam injection in eight Shank2−/− mice. Midazolam has previously been shown to reduce locomotor activity and marble burying in mice (Wise et al., 2012). The number of burying bouts (p = 0.0938), average bout duration (p = 0.3026) and total burying time (p = 0.1533) were not affected significantly after midazolam injection (Fig. 4A). Shank2−/− mice traveled significantly less distance (p < 0.0001) after midazolam administration and were significantly slower (p < 0.0001; Fig. 2C), showing decreased locomotor activity. Heatmaps indicate a reduced preference for the corners of the arena, consistent with the anxiolytic effects of midazolam (Wise et al., 2012).
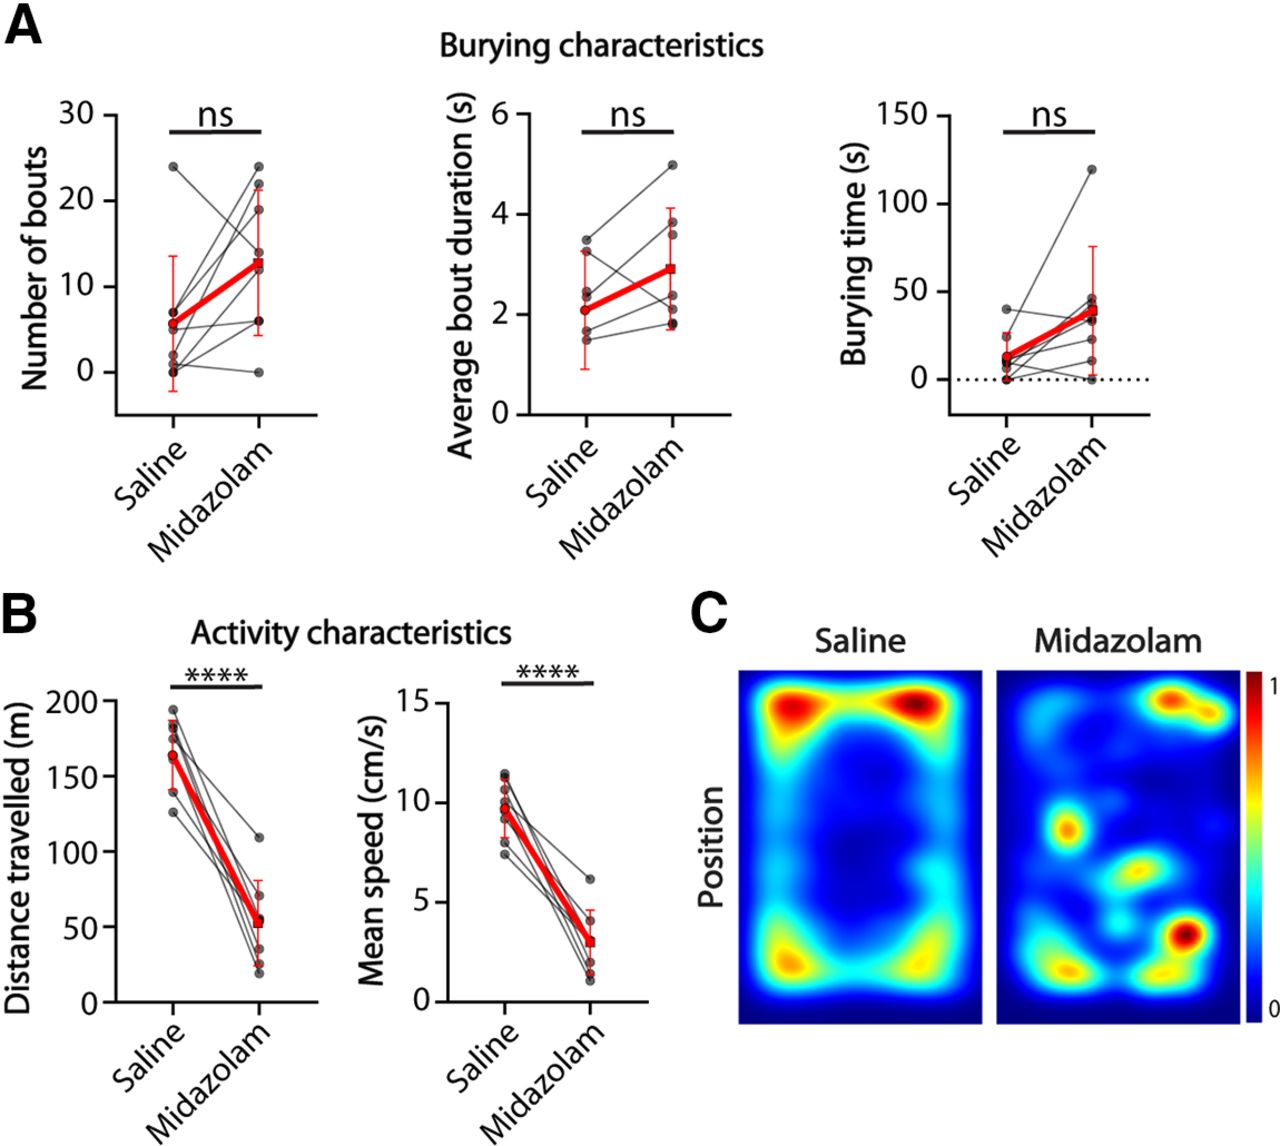
Shank2 mutants show decreased locomotion on midazolam treatment but similar burying characteristics compared with saline controls. A, Number of bouts, average bout duration, and total burying time shown for Shank2 mutant mice during the marble burying test. Red lines indicate group mean with SD (number of bouts, Wilcoxon test; average bout duration and burying time, two-tailed paired t test). B, Distance traveled and mean speed over the duration of the test. Red lines indicate group mean with SD (two-tailed paired t test). C, Heatmaps showing the position of the mice during the test after saline injection (left) and midazolam injection (right); ****p ≤ 0.0001; ns = not significant; n = 8 mice.
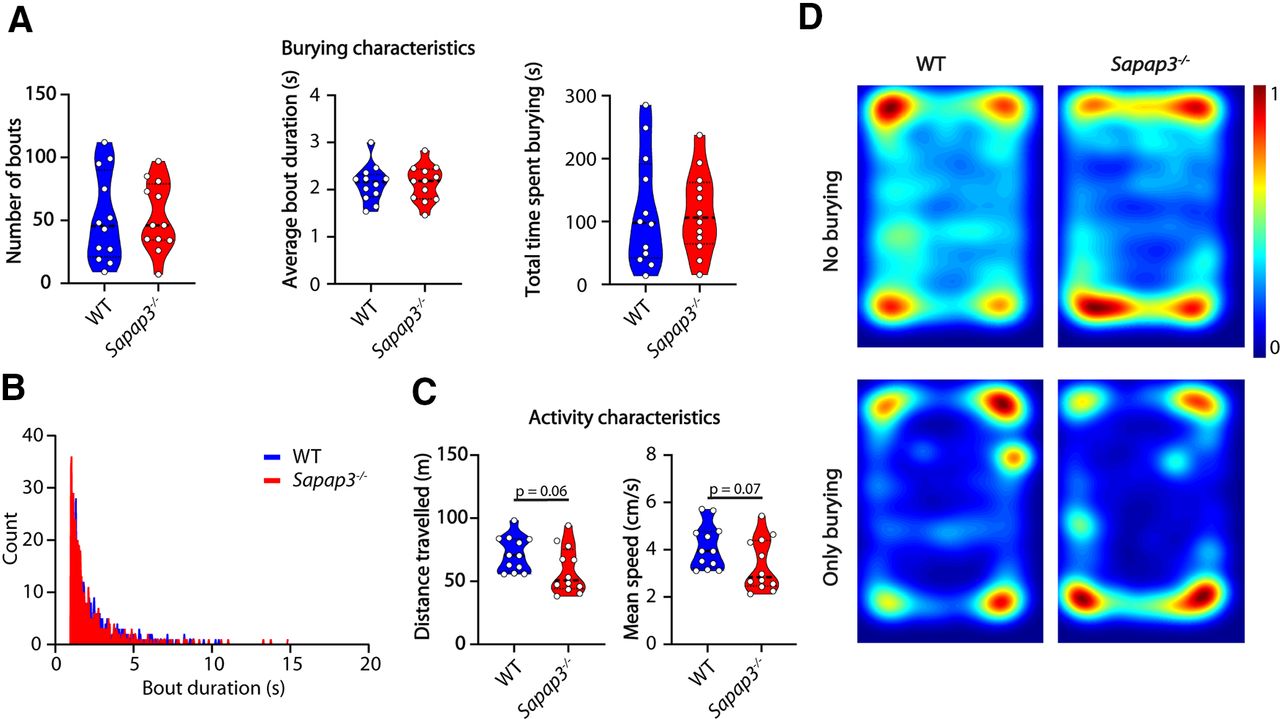
We next examined the performance of Sapap3−/− mice in the marble burying test. Sapap3−/− mice present with a phenotype that matches considerably with OCD patients, including compulsive-like grooming, decreased cognitive flexibility, altered habit formation, and increased anxiety-like behavior (Welch et al., 2007; van den Boom et al., 2019; Ehmer et al., 2020b). Similar to OCD patients, compulsive grooming present in Sapap3−/− mice can be rescued by administration of selective serotonin reuptake inhibitors (SSRIs) or deep-brain stimulation (Welch et al., 2007; Pinhal et al., 2018). However, in the marble burying assay the Sapap3−/− mice did not show altered burying characteristics: there was no difference between the mutant mice and their WT littermates (n = 10 mice per genotype) in number of bouts (p = 0.9441), bout duration (p = 0.9856), total time spent burying (p = 0.9362) or bout-duration distribution (Fig. 5A,B). Sapap3−/− mice showed a tendency to travel less and at lower speeds (Fig. 5C). Consistent with the anxiety phenotype (Welch et al., 2007) they spent most time in the corners (Fig. 5D, top), but the spatial distribution of the burying events was not affected.

Sapap3−/− mice do not show a burying phenotype but tend to travel less distance and do so at decreased speeds. A, Number of bouts, average bout duration, and total burying time shown for WT mice and Sapap3−/− mice during the marble burying test. Data presented as median with interquartile range (two-tailed, unpaired t test). B, Histogram showing distribution of bout lengths and their frequency. C, Distance traveled and mean speed over the duration of the test. Data presented as median with interquartile range (two-tailed, unpaired t test). D, Heatmaps showing all frames where mice do not bury (top) and frames where mice do bury (bottom); n = 12 mice per genotype.
Our methodological approach allowed us to quantify the duration and characteristics of the burying events as well as their distribution in time (Fig. 6). Ube3am-/p+ and Shank2−/− mice showed a consistent decrease in burying behavior over the entire session (Fig. 6A,B) compared with control mice. No difference was found for Sapap3−/− mice (Fig. 6C).

Cumulative burying over time. Time-binned plot with cumulative burying over time. Each bin represents a 1-min time period. Groups shown are Ube3am-/p+ (A), Shank2−/− (B), and Sapap3−/− (C), and their respective control littermates; n = 12 mice per genotype for A, C, n = 10 mice per genotype for B.
Comparison of analysis methods
In order to provide a standardized alternative, fast way of analyzing the result of the marble burying test other than visual scoring, we developed a script in ImageJ to measure buried surface area per marble, based on color thresholding of the marbles and measuring the masked surface area (Fig. 7A). We found that the results of the Ube3am-/p+ mice and their WT littermates were comparable between the classifier (p = 0.0175; Fig. 7B), experienced visual experimenter scoring (p = 0.0061; Fig. 7C), and image analysis (p = 0.0056; Fig. 7D). Visual scoring results per animal showed a strong correlation with the analysis of postburying images using ImageJ (Fig. 7E, top). However, burying behavior scored by the classifier showed no direct correlation with the number of buried marbles (Fig. 7E, bottom). Although no information is gained over burying characteristics over time, measuring buried marble surface area with ImageJ provides a way to analyze the marble burying result in a way that is similarly fast as visual scoring, yet with replicable results that are not based on experimenter performance or experience.

Analysis method comparison. A, Example of thresholded marbles analyzed with the ImageJ script. Analysis was done by taking a photograph of the buried marbles at the end of each test (left), color thresholding the marbles (middle), and measuring the masked surface area (right). B, Ube3am-/p+ results as analyzed with the trained classifier. Data presented as median with interquartile range (one-tailed, unpaired t test). C, Same mice as in A, but analyzed using visual scoring at the end of each test by the experimenters. Data presented as median with interquartile range (one-tailed, unpaired t test). D, Same mice as in A, B, but analyzed with the ImageJ script. Shown is the marble area that is left uncovered. Data presented as median with interquartile range (one-tailed, unpaired t test). E, Scatterplots showing correlation between ImageJ and visual scoring (top) and correlation between the classifier and visual scoring (bottom); *p ≤ 0.05, **p ≤ 0.01; A, n = 11 for WT and n = 12 for Ube3am-/p+; B, C, n = 12 per genotype.
Discussion
The marble burying test is often used as an indicator of anxiety and OCD (Broekkamp et al., 1986; Borsini et al., 2002; Thomas et al., 2009; Angoa-Pérez et al., 2013; Eltokhi et al., 2018). However, the meaning of marble burying behavior is highly debated throughout literature. Here, we introduce an analysis method that can increase inter-experimenter and intra-experimenter repeatability and establishes marble burying as its own unique behavior. We found that manual annotation of four 10-min-long videos by four independent observers blinded for genotype showed high variability in the identified average bout duration between observers, indicating that besides being time-consuming, manual annotation of burying bouts lacks reproducibility (Fig. 1B). We successfully trained a JAABA classifier by having skilled experimenters annotate video frames, which then independently scored burying behavior in Ube3am-/p+ mice consistent with existing literature (Fig. 2A).
A substantial benefit of automated classification is to allow for nonexperienced observers to score the marble burying results in a replicable manner that is consistent with skilled experimenters scoring the number of buried marbles (Fig. 7). Our classifier was able to score burying behavior in mice across varying laboratory settings, with differences in the bedding materials and behavioral boxes (wood chip bedding for Ube3a and Shank2 groups, and corn cob bedding for Sapap3 groups), which demonstrates its applicability across different behavioral setups. A classifier can be (re-)trained to accommodate varying experimental designs and conditions or to include additional objects. Together with spatial information from tracking data, this will allow for combining the study of marble burying behavior with paradigms such as novelty tests.
Additional information of mouse behavioral patterns gained from automated classification is an important step toward elucidating the biological meaning of marble burying. While a visual quantification of buried marbles at the end of each test results in a single output parameter (i.e., number of marbles buried), characterizing the actual behavior provides insight into specific burying characteristics and varying burying patterns over time. For example, Sapap3−/− mice were previously shown to have a significant shift to longer grooming events and differentiating grooming probability over time (Ramírez-Armenta et al., 2022), however we did not find this tendency in the burying bouts characteristics during the marble burying test (Fig. 6C). In contrast, we found that the Ube3am-/p+ and Shank2−/− mice showed a decrease in burying behavior over the entire duration of the test (Fig. 6A,B). This analysis is suitable for testing pharmacological, chemogenetic and optogenetic interventions, where tracking changes in the behavior over time is a crucial experimental output. Finally, the use of the classifier in combination with the tracking software reveals novel spatial-information parameters, previously unavailable in the marble burying test. Our analysis showed a striking decrease in Ube3am-/p+ specificity for burying in the corners of the arena (Fig. 2D). This was further seen after midazolam treatment. Shank2−/− mice showed a decreased preference for the corners of the test after midazolam injection (Fig. 4B), consistent with its anxiolytic effects (Wise et al., 2012). Overall, the activity analysis shows that there is no correlation between the level of activity and burying behavior as Shank2−/− mice show clear hyperactivity but less burying bouts compared with their WT littermates. This finding is in contrast to a recently published study (Berg et al., 2021), where the authors discuss low activity as a potential cause for decreased number of buried marbles in an AS mouse model. Our observations are however consistent with the recent study showing that rescue of the Ube3a expression in the juvenile mice alleviates the motor deficits in the rotarod assay but not the marble burying (Milazzo et al., 2021). Our pharmacological intervention with midazolam significantly reduced the hyperactivity in Shank2−/− mice. However, this did not result in a rescue of the burying phenotype (Fig. 4A). Together, these data strongly indicate that motor activity is not directly related to the burying behavior in Ube3am-/p+ and Shank2−/− mice.
For cases in which additional information about burying characteristics is not required, we introduced a custom-written ImageJ script for the analysis of buried marble surface area (Fig. 7A). This method showed consistent results with both the classifier (Fig. 7B) and visual scoring of buried marbles (Fig. 7C), and showed a strong correlation with visual scoring results (Fig. 7E, top). Burying behavior showed no clear correlation with the number of buried marbles on a per-animal basis (Fig. 7E, bottom). This disparity can be caused by factors such as marbles being buried and unburied several times over the duration of the test, which cannot be captured by the scoring of the resulting buried marbles. The lack of correlation between the burying events and the number of buried marbles further emphasizes the need for using the methods, such as our classifier, that directly measure the burying behavior instead of focusing solely on the outcome (buried marbles). Further research will need to confirm whether the disparity between buried marbles and burying bouts is present in mouse models showing increased burying behavior, or whether this pattern is specific for mice, which present with decreased burying behavior.
By combining the additional information gained from the classifier with selective mouse models known for repetitive and compulsive-like behaviors we aimed to test whether these phenotypes will cause deficits in the marble burying test. Previous studies have shown increased repetitive behavior and an obsessive-compulsive-like phenotype in Shank2−/− and Sapap3−/− mice, represented by the increased levels of self-grooming behavior (Welch et al., 2007; Schmeisser et al., 2012). In our experiments, Shank2−/− mice showed a significant decrease in the number of burying bouts and overall burying time (Fig. 3A). No difference was found between Sapap3−/− mice and their WT littermates (Fig. 4). These results indicate that repetitive behavior is not a unitary construct (Ehmer et al., 2020a) and that burying behavior, although it is often ascribed to repetitive behaviors (Thomas et al., 2009), captures a distinct behavioral aspect.
Assigning the marble burying behavior to its unique class, distinct from other behaviors, can explain not only our own results but many previously published confounding findings. Our current understanding of the behavioral implications of burying behavior are still far removed from being able to relate a phenotype to human conditions. Thus, more research is necessary to elucidate the exact biological background of burying behavior.
In conclusion, in this study, we provide a novel method for replicable analysis of the marble burying test by automated classification of behavior. The classifier scored decreased levels of Ube3am-/p+ burying behavior consistent with literature, providing a way to reduce inter-experimenter and intra-experimenter variability as well as allowing nonexperienced observers to accurately analyze the marble burying test. We provide a reproducible alternative in the form of an image analysis script for cases in which additional information is not required. Mouse models of ASD and OCD, which previously showed increased levels of repetitive behavior, were found to have decreased levels of burying behavior (Shank2−/−) or no difference from WTs (Sapap3−/−). Benzodiazepine treatment in Shank2−/− mice showing hyperactivity reduced locomotor activity but did not rescue reduced burying behavior. Together, these data strongly indicate that motor activity is not directly related to the burying behavior.
Acknowledgments
Acknowledgements: We thank Roxanne ter Haar for assistance with breedings and animal experiments. We also thank Bastijn van den Boom for the valuable discussions.
Footnotes
The authors declare no competing financial interests.
This work was supported by Netherlands Organization for Scientific Research (NWO) Grants VIDI/917.18.380,2018/ZonMw (to A.B.) and VIDI 864.14.010,2015/06367/ALW (to I.W.), the NWO Gravitation Program BRAINSCAPES 024.004.012 (to I.W.), the Foundation for OCD Research (I.W.), and the Amsterdam Brain and Cognition (ABC) Project Grant 2021 (to T.A. and I.W.).
This is an open-access article distributed under the terms of the Creative Commons Attribution 4.0 International license, which permits unrestricted use, distribution and reproduction in any medium provided that the original work is properly attributed.
References
In this issue


