

Article Figures & Data
Figures
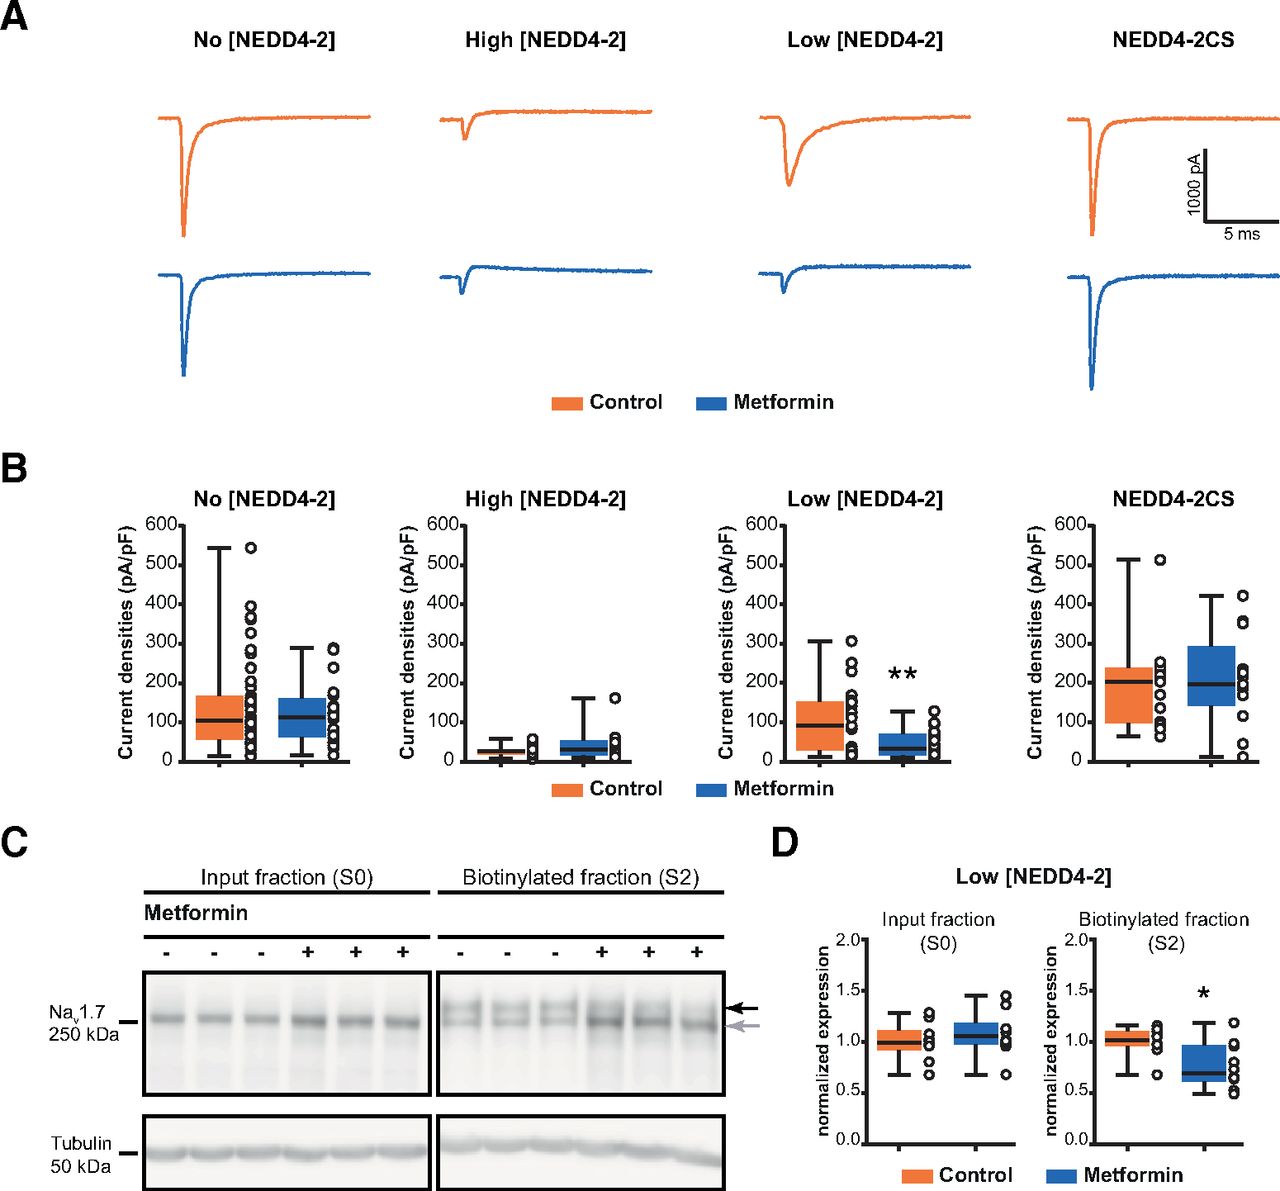
- Figure 1.
The effect of metformin on the NaV1.7 peak current depends on the presence of NEDD4-2 in HEK293 cells. A, Representative traces of NaV1.7 recordings, at the maximum peak current, from NaV1.7-transfected HEK293 cells, cotransfected with different concentrations of NEDD4-2 plasmid. These data are supported by further data presenting the multiple traces, obtained at each step of the protocol, in Extended Data Fig. 1-2. Cells were incubated with culture medium for control conditions (top) or 20 mm metformin (bottom) over 12 h. High [NEDD4-2] (ratio 1:1), Low [NEDD4-2] (ratio 1:0.3), and NEDD4-2CS (mutated form of NEDD4-2 with inactivated catalytic site) conditions are presented. B, Bar graphs presenting the NaV1.7 peak current in the four conditions with control medium or 20 mm metformin (n = 12–47 cells recorded/group). C, Representative blots of surface biotinylation of HEK293 cells cotransfected with NaV1.7 and Low [NEDD4-2]. The upper band corresponds to the fully glycosylated form of NaV1.7, while the lower band corresponds to the core glycosylated form. D, Respective quantification of NaV1.7 expression in total input fraction (S0) and biotinylated fraction (S2), with control medium or metformin treatment (n = 10/condition). Values were normalized to tubulin expression. These data are supported by further data presenting NaV1.7 expression, with other concentration of NEDD4-2, in Extended Data Fig. 1-1. Data are represented as a box plot with whiskers extending from the 10th to the 90th percentile, and each dot represents one recorded cell (A) or one sample (D). Statistical analysis was performed using an unpaired t test with Welch’s correction for both patch-clamp and Western blot datasets (Extended Data Table 1-2). *p < 0.05, **p < 0.01, ***p < 0.001. Detailed references for the resources used are presented in Extended Data Table 1-1.
- Figure 2.
Metformin reduced the total INa and NaV1.7 current densities in DRG neurons in a NEDD4-2-dependent manner. DRG neuronal primary cultures were incubated for 12 h with culture medium or 20 mm metformin. A, Representative traces of total INa, at the maximum peak current, recorded with an I–V protocol in DRG neurons from Nedd4-Lfl/fl mice or SNS-Nedd4-L−/− mice. The traces were normalized to the capacitance of the recorded cell and expressed in pA/pF over time. These data are supported by further data presenting the multiple traces, obtained at each step of the protocol, in Extended Data Figure 2-1. B, Quantified total INa current density in the four conditions (n = 22–28 cells recorded/condition). C, Representative traces of NaV1.7 current density, at the maximum peak current, recorded with a I–V protocol. NaV1.7 currents were isolated from the total INa by acute application of ProTxII at 5 nm during the recordings. The traces were normalized to the capacitance of the recorded cell and expressed in pA/pF over time. D, Quantified NaV1.7 current density in the four similar conditions (n = 19–23 cells recorded/condition). Data are represented as a box plot with whiskers extending from the 10th to the 90th percentile (minimum to maximum), with each dot representing a single recorded cell. Statistical analysis was performed using an unpaired t test with Welch’s correction (Extended Data Table 1-2). *p < 0.05, **p < 0.01, ***p < 0.001. Detailed references for the resources used are presented in Extended Data Table 1-1.
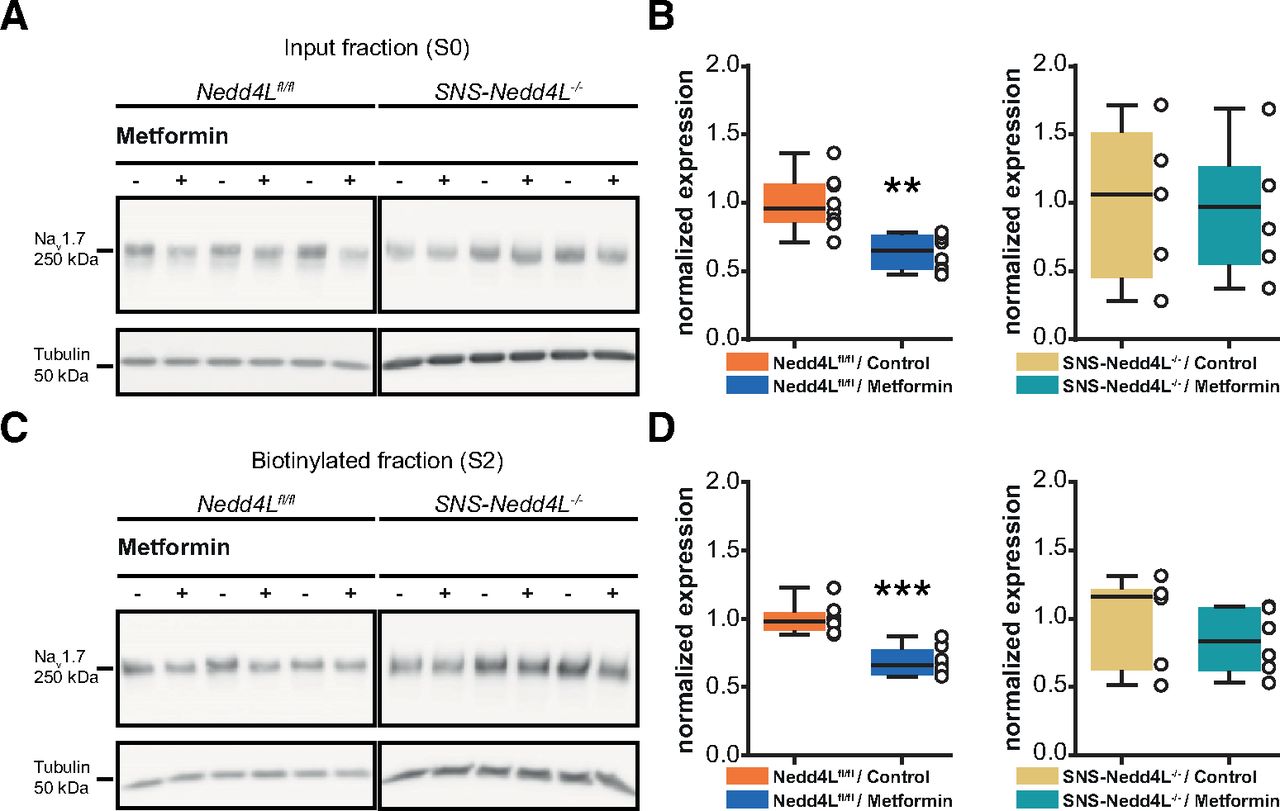
- Figure 3.
Effect of metformin on NaV1.7 expression in DRG neurons. Primary cultures of DRG were incubated for 12 h with medium alone or 20 mm metformin. A, Representative blots of NaV1.7 expression in total input fraction (S0) on DRG neurons from Nedd4Lfl/fl (left) or SNS-Nedd4L−/− (right). B, Quantification of NaV1.7 expression on the input fraction from DRG neurons of Nedd4Lfl/fl (n = 8/treatment) or SNS-Nedd4L−/− (n = 5–6/treatment), treated or not with metformin. C, Representative blots of NaV1.7 expression in biotinylated fraction (S2) on DRG neurons from Nedd4Lfl/fl (left) or SNS-Nedd4L−/− (right). D, Quantification of NaV1.7 expression on the biotinylated fraction from DRG neurons of Nedd4Lfl/fl (n = 8/treatment) or SNS-Nedd4L−/− (n = 6/treatment), treated or not with metformin. Values were normalized to tubulin expression. These data are supported by further data presenting AMPK and p-AMPK expression, with or without metformin treatment, in Extended Data Figure 3-1. Data are represented as a box plot with whiskers extending from the 10th to the 90th percentile (minimum to maximum), with each dot representing a single sample. Statistical analysis was performed using an unpaired t test with Welch’s correction (Extended Data Table 1-2). *p < 0.05, **p < 0.01, ***p < 0.001. Detailed references for the resources used are presented in Extended Data Table 1-1.
- Figure 4.
Metformin decreases NEDD4-2 phosphorylation. A, Representative blots of the total NEDD4-2 expression (top) and the phosphorylated NEDD4-2 (at serine-328; bottom) in DRG neurons incubated with culture medium or with metformin. B, Quantification of the metformin effect on NEDD4-2 expression (n = 4/treatment) and phosphorylated NEDD4-2 (Ser-328 residue; n = 4/treatment). For all datasets, values were normalized to tubulin expression, and the data are represented as a box plot with whiskers extending from the 10th to the 90th percentile (minimum to maximum), with each dot representing a single sample. Statistical analysis was performed using and unpaired t test with Welch’s correction (Extended Data Table 1-2). *p < 0.05, **p < 0.01, ***p < 0.001. Detailed references for the resources used are presented in Extended Data Table 1-1.
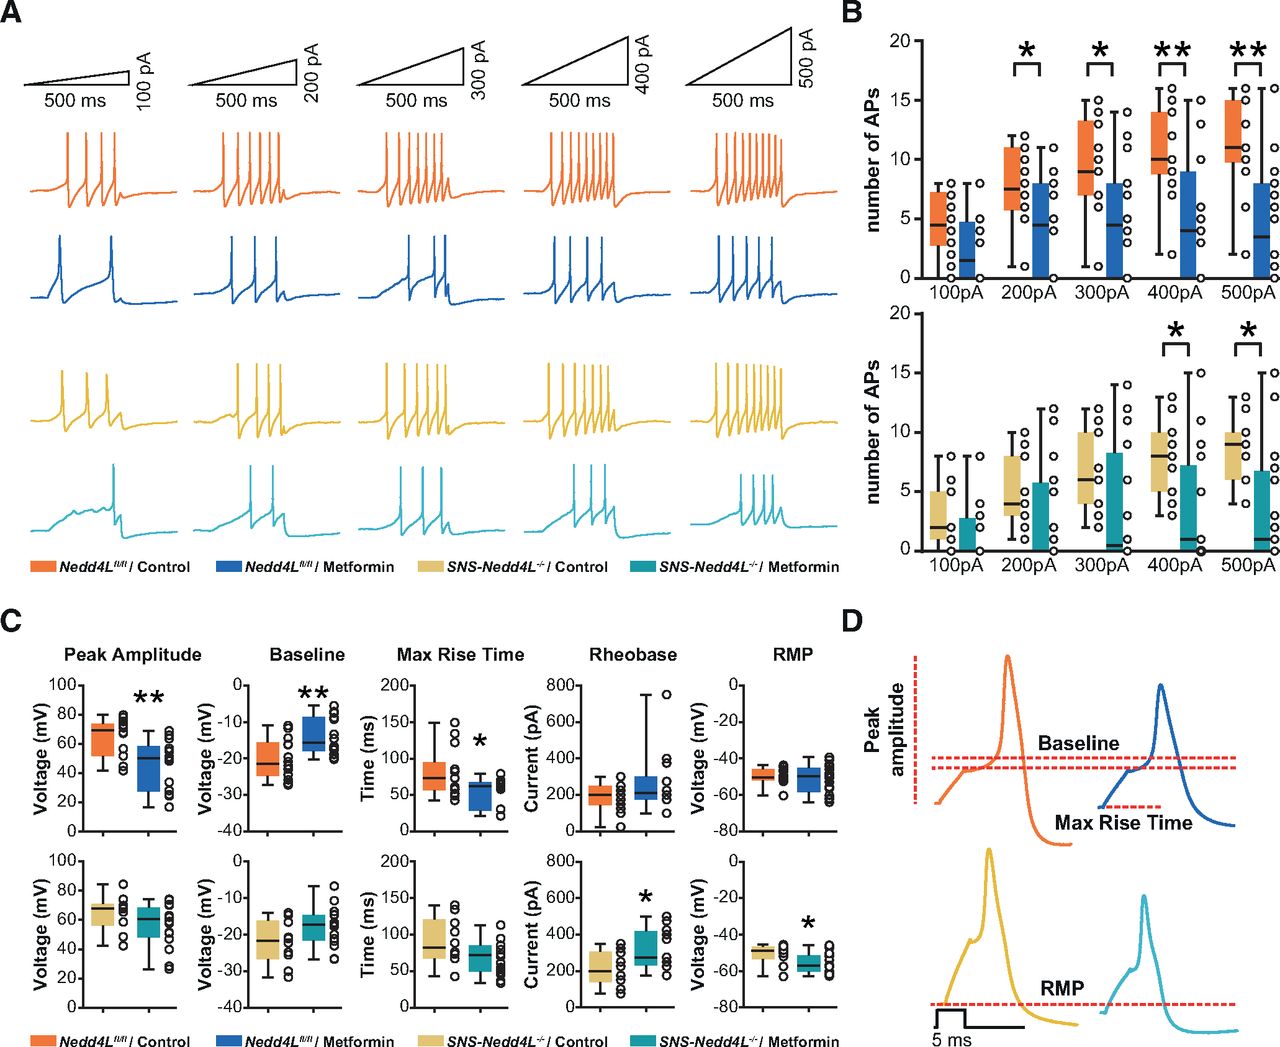
- Figure 5.
Current-clamp recordings of DRG neurons from Nedd4Lfl/fl or SNS-Nedd4L−/−, treated with medium or 20 mm metformin. The recordings are acquired from at least three different patch-clamp sessions. A, Representative traces of APs in different conditions elicited by ramp protocols of 500 ms (inset). B, Box plots showing the analysis of APs number in Nedd4Lfl/fl mice (top; n = 14–16/treatment) and SNS-Nedd4L−/− mice (bottom; n = 11–16/treatment); data are represented as a box plot with whiskers extending from the 10th to the 90th percentile (minimum to maximum), with each dot representing a single recorded cell. Statistical analysis was performed using a two-way repeated-measures ANOVA, followed by Sidak’s multiple-comparisons post hoc test (*p < 0.05, **p < 0.01, ***p < 0.001; Extended Data Table 1-2). C, Representative single AP and its parameters in different conditions, as illustrated by the color code. D, Analysis of AP parameters, which are significantly changed on metformin treatment in Nedd4Lfl/fl mice (n = 14 cells/treatment) or SNS-Nedd4L−/− mice (n = 10–16 cells/treatment); data are represented as a box plot with whiskers extending from the 10th to the 90th percentile (minimum to maximum). These data are supported by further data presenting the AP characteristics, obtained from DRG neurons of Nedd4Lfl/fl or SNS-Nedd4L−/− mice treated with or without metformin, in Extended Data Figure 5-1. Statistical analysis was performed using an unpaired t test with Welch’s correction (Extended Data Table 1-2). *p < 0.05, **p < 0.01, ***p < 0.001. Detailed references for the resources used are presented in Extended Data Table 1-1.


Tables
- Table 1
Biophysical properties of NaV1.7-mediated currents in HEK293 cells, transfected with different NEDD4-2 plasmids, with (+) or without (–) metformin treatment.
NaV1.7 alone NaV1.7 + Low [NEDD4-2] NaV1.7 + NEDD4-2CS Metformin – + – + – + SSA V1/2 (mV) −8.1 ± 0.7 −6.3 ± 1.1 −6.7 ± 1.1 −5.4 ± 1.4 −9.3 ± 0.6 −9.1 ± 0.9 Slope 6.5 ± 0.2 7.1 ± 0.3 6.0 ± 0.3 **7.2 ± 0.3 7.1 ± 0.3 7.1 ± 0.2 n 30 17 16 11 12 11 SSI V1/2 (mV) −61.3 ± 1.1 −61.5 ± 1.3 −58.0 ± 1.5 −58.9 ± 1.8 −65.8 ± 1.2 −65.2 ± 1.3 Slope 7.45 ± 0.4 *9.01 ± 0.6 8.82 ± 0.7 7.75 ± 0.6 7.72 ± 0.5 7.1 ± 0.3 n 30 16 15 14 12 12 The three groups correspond to HEK293 cells transfected only with NaV1.7, with NaV1.7 and NEDD4-2 in low concentration (NaV1.7 cDNA/NEDD4-2 cDNA ratio 1:0.3), or with NaV1.7 and an inactivated NEDD4-2, mutated on the catalytic site. The V1/2 (mV) is the voltage at which half of the available channels are activated or inactivated based on their steady-state protocol. Data are expressed as the mean ± SEM. Statistical analysis was performed using an unpaired t test with Welch’s correction (Extended Data Table 1-2). Detailed references for the resources used are presented in Extended Data Table 1-1.
*p < 0.05, **p < 0.01, ***p < 0.001. The bold values correspond to the values, which shows a statistically significant difference.
- Table 2
Biophysical properties of total NaV and NaV1.7-mediated currents in DRG neurons from Nedd4Lfl/fl or SNS-Nedd4L−/− mice, with (+) or without (–) metformin treatment
Nedd4-2fl/fl mice SNS-Nedd4-2–/– mice NaV total NaV1.7 NaV total NaV1.7 Metformin – + – + – + – + SSA V1/2 (mV) −37.1 ± 2.3 −35.6 ± 3.4 −42.8 ± 3.2 −40.4 ± 4.7 −37.0 ± 2.7 −39.9 ± 4.8 −36.5 ± 14.0 −43.2 ± 4.9 Slope 6.5 ± 0.5 6.6 ± 0.6 5.9 ± 1.0 5.2 ± 1.2 6.2 ± 0.4 **8.2 ± 0.4 7.0 ± 1.5 5.9 ± 0.6 n 15 10 6 5 12 8 3 6 The SSA was measured on total INa current density or NaV1.7-mediated currents for each genotype and treatment condition. The V1/2 (mV) is the voltage at which half of the available channels are activated with the SSA protocol. Data are expressed as the mean ± SEM. Statistical analysis was performed using an unpaired t test with Welch’s correction (Extended Data Table 1-2). Detailed references for the resources used are presented in Extended Data Table 1-1.
*p < 0.05, **p < 0.01, ***p < 0.001. The bold values correspond to the values, which shows a statistically significant difference.
Figure 1-1
Supplemental data figure supporting Figure 1. Effect of metformin on NaV1.7 expression in HEK293 cells, depending on NEDD4-2 expression levels. A, Representative blots of the total input fraction (S0) or surface biotinylation (S2) of HEK293 cells cotransfected with NaV1.7 and No [NEDD4-2], treated with medium or metformin. B, Respective quantification of NaV1.7 expression in S0 (left) and S2 (right), with control medium or metformin treatment (n = 6/condition). C, Representative blots of the S0 or S2 of HEK293 cells cotransfected with NaV1.7 and High [NEDD4-2], treated with control medium or metformin. D, Respective quantification of NaV1.7 expression in S0 (left) and S2 (right), with control medium or metformin treatment (n = 6/condition). Values were normalized to tubulin expression. Data are represented as a box plot with whiskers extending from the 10th to the 90th percentile; each dot represents one sample. Statistical analysis was performed using an unpaired t test with Welch’s correction (Extended Data Table 1-2). *p < 0.05, **p < 0.01, ***p < 0.001. Detailed references for the resources used are presented in Extended Data Table 1-1. Download Figure 1-1, EPS file.
Figure 1-2
Supplemental data figure supporting the Figure 1. Representative example traces of NaV1.7 currents, at each step of the protocol. The voltage-clamp protocol used is represented below the traces. It consisted in evoked sodium currents, at a holding potential of –100 mV, with pulses of 100 ms ranging from –80 to +40 mV in increments of 5 mV. Recordings from transfected HEK293 cells, cotransfected with NaV1.7 and different concentrations of NEDD4-2 plasmid. Cells were incubated with culture medium for control conditions (top) or 20 mm metformin (bottom) during 12 h. High [NEDD4-2] (ratio 1:1), Low [NEDD4-2] (ratio 1:0.3), and NEDD4-2CS (mutated form of NEDD4-2 with inactivated catalytic site) conditions are presented. Detailed references for the resources used are presented in Extended Data Table 1-1. Download Figure 1-2, EPS file.
Figure 2-1
Supplemental data figure supporting Figure 2. Representative example traces of total INa or NaV1.7 currents, at each step of the protocol, recorded from different DRG neurons, with or without metformin treatment. The voltage-clamp protocol used is represented below the traces. It consisted in evoked sodium currents, at a holding potential of –100 mV, with pulses of 100 ms ranging from –80 to +40 mV in increments of 5 mV. A, Recordings of total INa from DRG neurons of Nedd4-Lfl/fl mice or SNS-Nedd4-L–/– mice. The traces were normalized to the capacitance of the recorded cell and expressed in pA/pF over time. B, Recordings of NaV1.7 current density from DRG neurons of Nedd4-Lfl/fl mice or SNS-Nedd4-L–/– mice. NaV1.7 currents were isolated from the total INa by acute application of ProTxII at 5 nm during the recordings. The traces were normalized to the capacitance of the recorded cell and expressed in pA/pF over time. Detailed references for the resources used are presented in Extended Data Table 1-1. Download Figure 2-1, EPS file.
Table 1-1
Supplemental data table of reagents, solutions, and RRID references, supporting all of the figures. RRID and source references of the resources used in the current study are noted. Download Table 1-1, XLSX file.
Table 1-2
Supplemental data table of all statistical analysis, supporting all of the figures. Statistical table. Each row represents a dataset and the corresponding statistical tests, statistical values, p values, and Cohen’s effect size factor. Download Table 1-2, XLSX file.
Figure 3-1
Supplemental data figure supporting the Figure 3. Effect of metformin on AMPK and p-AMPK in HEK293 cells and DRG neurons. A, Representative blots of AMPK and p-AMPK expression in HEK293 cells, treated with medium or 20 mm metformin. B, Respective quantification of AMPK, p-AMPK expressions, and p-AMPK/AMPK ratio (n = 6/condition). C, Representative blots of AMPK and p-AMPK expression in DRG neurons, treated with control medium or 20 mM metformin. D, Respective quantification of AMPK, p-AMPK expressions, and p-AMPK/AMPK ratio (n = 6/condition). Values were normalized to tubulin expression. Data are represented as a box plot with whiskers extending from the 10th to the 90th percentile; each dot represents one sample. Statistical analysis was performed using an unpaired t test with Welch’s correction (Extended Data Table 1-2). *p < 0.05, **p < 0.01, ***p < 0.001. Detailed references for the resources used are presented in Extended Data Table 1-1. Download Figure 3-1, EPS file.
Figure 5-1
Supplemental data table supporting Figure 5. AP characteristics recorded from DRG neurons by electrophysiological current-clamp protocol. Neurons were obtained from Nedd4Lfl/fl mice (n = 14 cells/treatment) or SNS-Nedd4L–/– mice (n = 10–16 cells/treatment) and treated with control medium or metformin treatment (20 mm). Data are represented as the mean ± SEM. Statistical analysis was performed using and unpaired t test with Welch’s correction (Extended Data Table 1-2). *p < 0.05, **p < 0.01, ***p < 0.001. Detailed references for the resources used are presented in Extended Data Table 1-1. Download Figure 5-1, XLSX file.
In this issue


