

Article Figures & Data
Figures
- Figure 1.
The Virtual Brain workflow. Structural and functional connectomes were created from each subject’s dwMRI and fMRI data, respectively. Each subject’s unique structural connectome constrained their personal brain simulation, wherein local dynamics were represented by the dynamic mean field (DMF) model (Eqs. 1–6; Deco et al., 2014a,b). The simulated local synaptic gating potentials were then fed through the Balloon–Windkessel hemodynamic model, producing simulated fMRI time series. Each subject’s simulated fMRI time series was fitted to their functional connectome through parameter space exploration. The resulting subject-specific parameters were used in later analyses. E, Excitatory neural population; I, inhibitory neural population; w+, recurrent potential; JNMDA, excitatory connection strength.
- Figure 2.
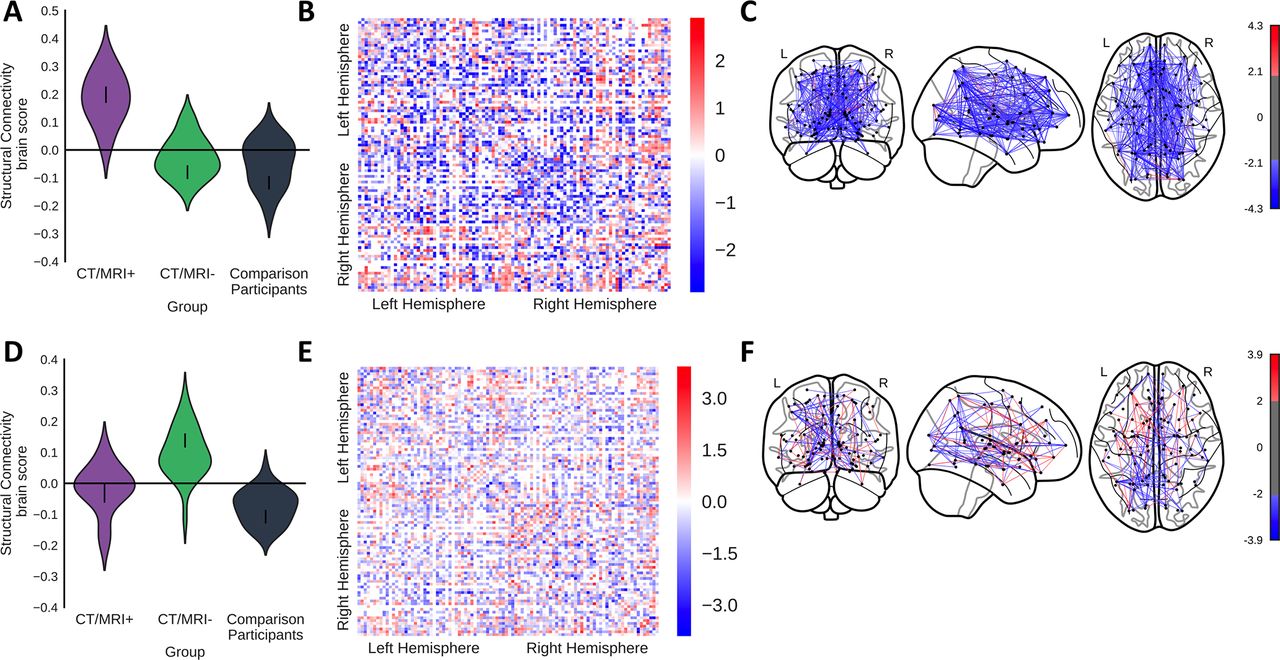
A group-comparison PLS distinguished the SC of CT/MRI-positive and CT/MRI-negative patients from comparison participants. A–F, The first latent variable (p < 0.0001, 67% covariance, singular value = 0.19) shows differentiation of CT/MRI-positive patients from the comparison participants (A–C), while the second latent variable (p = 0.016, 33% covariance, singular value = 0.13) differentiated CT/MRI-negative patients from the comparison participants (D–F). A, D, Violin plots show the distribution of brain scores for each group. Brain scores indicate the degree to which participants express the pattern of SC shown in B and E. Error bars are bootstrap-estimated 95% confidence intervals. B, E, Bootstrap ratios, which are a linear combination of SC weighted by how strongly they contribute to the latent variable are shown. Bootstrap ratios may be interpreted similar to z scores (>2.0, akin to p < 0.05), so regions with bars exceeding the dashed line may be considered to reliably contribute to the latent variable. C, F, Regional inhibitory connection strength bootstrap ratios that reliably contribute to the latent variable (>2) from B and E projected onto a brain.
- Figure 3.
A group-comparison PLS distinguished the CT/MRI-positive and CT/MRI-negative patients from comparison participants via their fractional anisotropy. A, B, The first latent variable (p = 0.01, 65% covariance, singular value = 8.2) that distinguished CT/MRI-positive patients from the comparison participants. A, Violin plot shows the distribution of brain scores for each group. Brain scores indicate the degree to which participants express the pattern fractional anisotropy shown in B. Error bars are bootstrap-estimated 95% confidence intervals. B, Bootstrap ratios, which are a linear combination of voxelwise fractional anisotropy weighted by how strongly they contribute to the latent variable. Bootstrap ratios are superimposed onto a white matter skeleton. Bootstrap ratios may be interpreted similar to z scores (>2.0, akin to p < 0.05), so only voxels with bootstrap ratios >2 are illustrated.
- Figure 4.
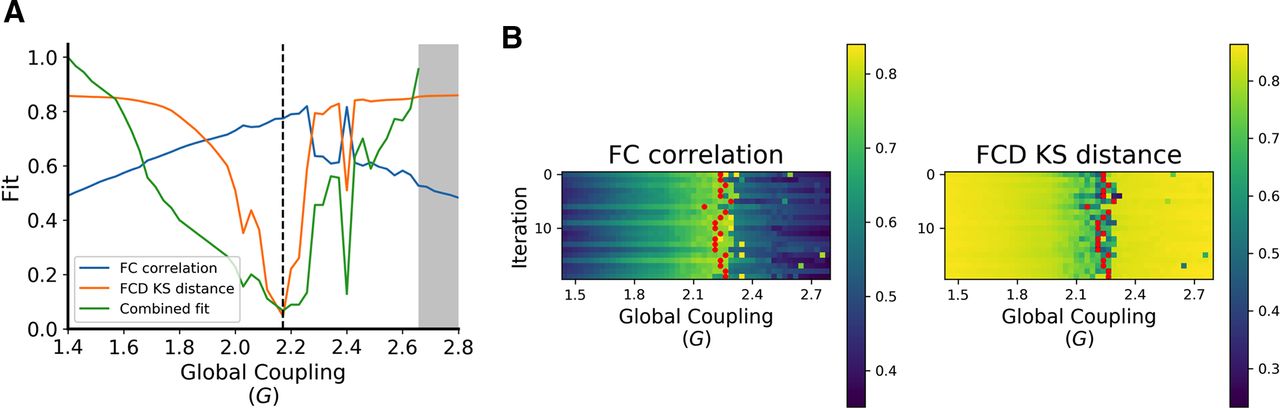
Summary of modeling fitting procedure. A, The parameter space exploration map for a representative subject given a single iteration. The gray area denotes values of global coupling for which the model fails to converge because it becomes hyperexcited. The black dashed line represents the optimal value of global coupling. Note that combined fit (green) is defined by the sum of the FC and FCD fits ranked across all other values of global coupling at which the model converged. B, The full-parameter space results for the same representative subject. Each grid shows model fits across all values of G on the x-axis, and iterations with randomized initial conditions on the y-axis. On the left, fits are defined by the uncentered correlation of the upper triangle of the empirical and simulated FC matrices. On the right, Kolmogorov–Smirnov (KS) distance between the upper triangles of the empirical and simulated FCD matrices defines fits. The red dots represent the optimal fit for each iteration.
- Figure 5.
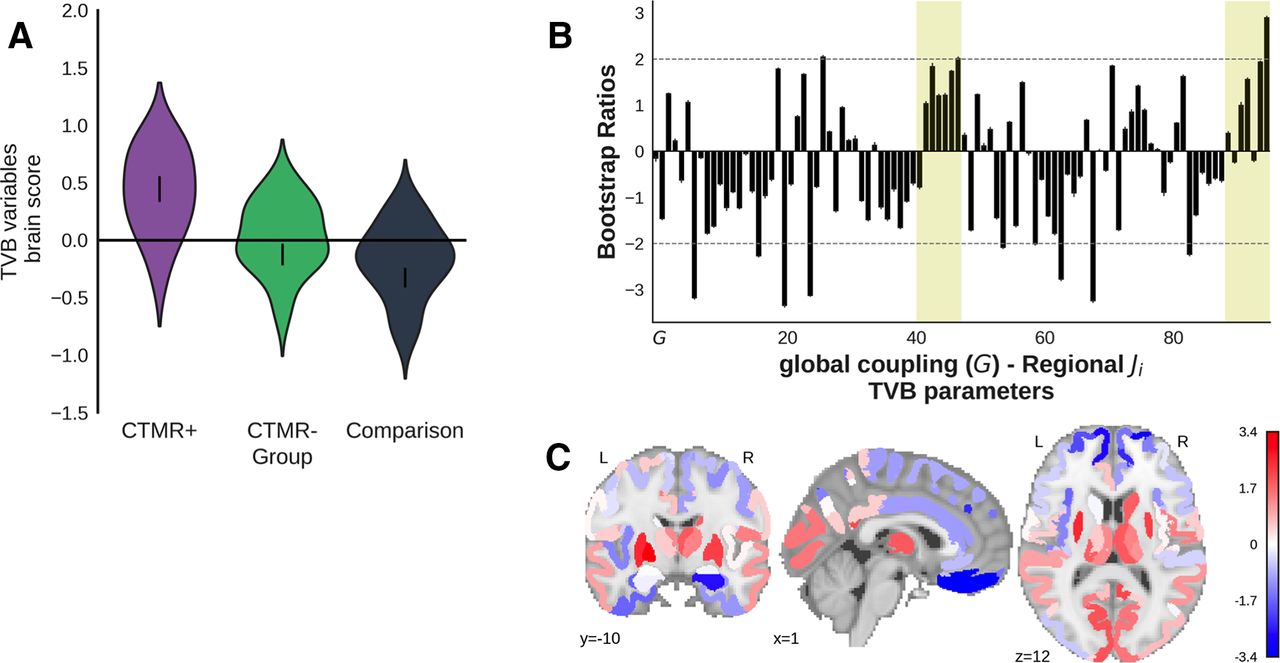
Group comparison PLS of TVB parameters (G and regional inhibitory connection strengths) across patients (combined CT/MRI-positive and CT/MRI-negative subgroups) and comparison participants (p = 0.026, singular value = 0.30). Patients showed mostly higher inhibitory connection strength relative to comparison participants, particularly in the subcortical regions. A, The violin plot shows the distribution of brain scores for each group. Brain scores indicate the degree to which participants express the pattern of global coupling and regional local inhibitory connection strength shown in B. Error bars are bootstrap-estimated 95% confidence intervals. B, Bootstrap ratios, which are a linear combination of global coupling and regional local inhibitory connection strength weighted by how strongly they contribute to the latent variable. Bootstrap ratios may be interpreted similar to z scores (>2.0, akin to p < 0.05), so regions with bars exceeding the dashed line may be considered to reliably contribute to the latent variable. Error bars are 1 SE. Bars representing subcortical regions are shaded. C, Regional inhibitory connection strength bootstrap ratios from B projected onto a glass brain.
- Figure 6.
Group-comparison PLS of TVB parameters (G and regional inhibitory connection strengths) across CT/MRI-positive patients, CT/MRI-negative patients, and comparison participants. A–C, The first latent variable (p = 0.03, 70.9% covariance, singular value = 0.43) that differentiated CT/MRI-positive patients from comparison participants. A, Violin plot shows the distribution of brain scores for each group. Brain scores indicate the degree to which participants express the pattern of global coupling and regional local inhibitory connection strength shown in B. Error bars are bootstrap-estimated 95% confidence intervals. B, Bootstrap ratios, which are a linear combination of global coupling and regional local inhibitory connection strength weighted by how strongly they contribute to the latent variable. Bootstrap ratios may be interpreted similar to z scores (>2.0, akin to p < 0.05), so regions with bars exceeding the dashed line may be considered to reliably contribute to the latent variable. Error bars are 1 SE. Bars representing subcortical regions are shaded. C, Regional inhibitory connection strength bootstrap ratios from B projected onto a brain.
- Figure 7.
A behavioral PLS analysis assessed the associations between the TBI Symptoms and Age and Cognition factors and TVB parameters (global coupling and regional inhibitory connection strengths) in the patients (combined CT/MRI-positive and CT/MRI-negative subgroups). The first significant variable is illustrated (p = 0.02, 74% covariance, singular value = 2.4) A, The bars represent the correlation between each factor and the pattern of TVB parameters shown in the corresponding bar graph in B. The error bars represent 95% confidence intervals, so the error bars of variables significantly contributing to the latent variable do not cross zero. B, Bootstrap ratios, which are a linear combination of global coupling and regional local inhibitory connection strength weighted by how strongly they contribute to the latent variable. Bootstrap ratios may be interpreted similar to z scores (>2.0, akin to p < 0.05), so regions with bars exceeding the dashed line may be considered to reliably contribute to the latent variable. Error bars are 1 SE. Bars representing subcortical regions are shaded. C, Regional inhibitory connection strength bootstrap ratios from B that reliably contribute to the latent variable (>2) projected onto a brain.
- Figure 8.
A–F, Within-group behavioral PLS analyses show the relationships between the TBI Symptoms and Age and Cognition factor scores and the TVB parameters (G and regional inhibitory connection strengths) for the CT/MRI-negative (A–C) and CT/MRI-positive patients (D–F). A–C show the first latent variable (p = 0.005, 73.1% covariance, singular value = 3.0) for the within CT/MRI-negative patients, while D–F illustrate the first latent variable (p = 0.11, 67.6% covariance, singular value = 3.7) for the CT/MRI-positive patients. A, D, The bars represent the correlation between each factor with the pattern of TVB parameters shown in the corresponding bar graph B. The error bars represent 95% confidence intervals, so the error bars of variables significantly contributing to the latent variable do not cross zero. B and E show bootstrap ratios, which are a linear combination of global coupling and regional local inhibitory connection strength weighted by how strongly they contribute to the latent variable. Bootstrap ratios may be interpreted similar to z scores (>2.0, akin to p < 0.05), so regions with bars exceeding the dashed line may be considered to reliably contribute to the latent variable. Error bars are 1 SE. Bars representing subcortical regions are shaded. C, F, Regional inhibitory connection strength bootstrap ratios that reliably contribute to the latent variable (>2) from B and E projected onto a brain.


Tables
Scale Subscale CT/MRI-positive (n = 14) CT/MRI negative (n = 30) Comparison participants
(n = 36)Analysis for group
differenceAge (years) 39.9 (13.8) 31.2 (9.0) 26.6 (7.7) F(2,79) = 9.7, p = 0.0001 Gender 9 male; 5 female 18 male; 12 female 25 male; 11 female χ(2)2 = 0.65, p = 0.72 Race 9 white, 2 More than one race; 1
African American or African; 1
Asian; 1 Hawaiian or Pacific Islander23 white; 3 Asian; 2 Hawaiian or Pacific
Islander; 1 African American or
African; 1 more than one raceUnknown Education 14.6 (2.1) 14.6 (3.1) Unknown t(42) = −0.08, p = 0.93 Glasgow Coma Scale 14.6 (0.63) 14.9 (0.43) NA t(42) = 1.4, p = 0.18 Loss of consciousness 8 none; 6 < 0.5 h 12 none; 18 < 0.5 h NA χ(1)2 = 0.55, p = 0.46 Post-traumatic amnesia 5 none; 4 < 0.5 h; 5 0.5–24 h 14 None; 15 < 0.5 h; 1 0.5-24 h NA χ(1)2 = 8.6, p = 0.01 n = 11 n = 27 NA Glasgow Outcome Scale Extended 6 month 6.8 (0.98) 7.0 (0.94) NA t(36) = 0.64, p = 0.52 Brief Symptom Inventory Anxiety 54.9 (7.7) 53.6 (10.6) NA t(36) = −0.37, p = 0.71 Depression 54.2 (10.2) 52.6 (10.6) NA t(36) = −0.42, p = 0.67 Somatic 55.8 (7.9) 53.0 (9.7) NA t(36) = −0.86, p = 0.39 Global Severity Index 57.0 (7.3) 53.6 (10.8) NA t(36) = −0.97, p = 0.34 n = 11 n = 26 NA Satisfaction with Life Score 19.1 (7.6) 22.6 (5.9) NA t(35) = 1.5, p = 0.14 n = 11 n = 25 NA Trail Making Test Part A 30.7 (9.7) 28.3 (10.6) NA t(35) = −0.65, p = 0.52 Part B 69.8 (25.0) 76.4 (65.2) NA t(35) = 0.32, p = 0.75 Wechsler Adult Intelligence Scale Processing Speed 109.2 (16.3) 106.5 (14.6) NA t(35) = −0.49, p = 0.62 California Verbal Learning Test 55.5 (9.8) 55.5 (9.2) NA t(35) = 0.06, p = 0.98 The following statistics are reported: one-way ANOVA (age), χ2 test of independence (gender, loss of consciousness, post-traumatic amnesia), independent-samples t test [Education, Glasgow Coma Scale, Glasgow Outcome Scale Extended (6 month), Brief Symptom Inventory, Satisfaction with Life Score, Trail Making Test Part A and B, Wechsler Adult Intelligence Scale, and California Verbal Learning Test. NA, Not applicable. Data are mean (SD), unless otherwise indicated.
1 4 contusions, 1 shear (MRI) 2 2 shear (MRI) 3 1 shear (MRI) 5 2 shear (MRI) 5 4 contusions (MRI)
1 intracranial lesions, 1 skull fracture, 1 subdural hematoma, 1 contusion, 1 brain swelling (CT)6 4 contusions, 3 shears (MRI) 7 2 shear (MRI) 8 1 skull fracture (CT) 9 1 contusion, 2 shear (MRI)
1 intracranial lesions, 1 sub arachnoid hemorrhage, 1 contusion10 1 subdural hematoma, 2 contusions (MRI)
1 intracranial lesions, 1 subarachnoid hemorrhage, 1 contusion11 1 subdural hematoma, 2 contusions, 2 shear (MRI)
1 intracranial lesions, 1 skull fracture, 1 subdural hematoma, 1 subarachnoid hematoma12 1 intracranial lesions, 1 subarachnoid hematoma (CT) 13 2 shear (MRI) 14 1 shear, 1 deep shear (MRI) - Table 3
Cortical and subcortical regions from the regional map parcellation from Kötter and Wanke (2005)
Index Region Right Left 1 49 Primary auditory cortex 2 50 Secondary auditory cortex 3 51 Amygdala 4 52 Anterior cingulate cortex 5 53 Posterior cingulate cortex 6 54 Retrosplenial cingulate cortex 7 55 Subgenual cingulate cortex 8 56 Frontal eye field 9 57 Gustatory cortex 10 58 Hippocampus 11 59 Anterior insula 12 60 Posterior insula 13 61 Primary motor cortex 14 62 Inferior parietal cortex 15 63 Intraparietal cortex 16 64 Medial parietal cortex 17 65 Superior parietal cortex 18 66 Centrolateral prefrontal cortex 19 67 Dorsolateral prefrontal cortex 20 68 Dorsomedial prefrontal cortex 21 69 Medial prefrontal cortex 22 70 Orbitoinferior prefrontal cortex 23 71 Orbitolateral prefrontal cortex 24 72 Orbitomedial prefrontal cortex 25 73 Prefrontal polar cortex 26 74 Ventrolateral prefrontal cortex 27 75 Parahippocampal cortex 28 76 Dorsolateral premotor cortex 29 77 Medial premotor cortex 30 78 Ventrolateral premotor cortex 31 79 Primary somatosensory cortex 32 80 Secondary somatosensory cortex 33 81 Central temporal cortex 34 82 Inferior temporal cortex 35 83 Temporal polar cortex 36 84 Superior temporal cortex 37 85 Ventral temporal cortex 38 86 Visual area 1 (primary visual cortex) 39 87 Visual area 2 (secondary visual cortex) 40 88 Anterior visual area, dorsal part 41 89 Anterior visual area, ventral part 42 90 Thalamic ROI with major frontal connections 43 91 Thalamic ROI with major temporal connections 44 92 Thalamic ROI with major occipitoparietal
connections45 93 Caudate nucleus 46 94 Putamen 47 95 Pallidum 48 96 Accumbens nucleus Parameter Value (no. of steps) Description G 1.4–2.8 (50) Scaling factor for inter-region (global) excitatory coupling Noise ( 0.001 Amplitude of noise kernel Conduction velocity (m/s) 6 Speed of inter-region (global) signal transmission w+ 1.4 Excitatory recurrent potential JGABA (nA) 1.0* Local feedback inhibitory synaptic coupling JNMDA (nA) 0.15 Local excitatory coupling Time steps (ms) 600,000 Simulation duration fMRI TR (ms) 2000 Simulation TR *JGABA values were initialized at 1.0 and adjusted iteratively by the FIC tuning algorithm during each simulation.
Scale Subscale TBI
symptomsAge and
cognitionGlasgow Outcome
Scale Extended6 month −0.73 −0.033 Brief Symptom
InventorySomatic 0.71 0.16 Depression 0.86 −0.075 Anxiety 0.87 −0.032 Global severity
index0.99 −0.043 Satisfaction with
Life Scale−0.83 0.29 Education −0.33 −0.51 Age −0.036 0.42 Trail Making Test Part A 0.19 0.62 Part B −0.085 0.89 Wechsler Adult
Intelligence ScaleProcessing
speed0.25 −0.92 California Verbal
Learning Test−0.10 −0.31 Percentage covariance 37% 22% Loadings >0.3 are shown in bold to assist interpretation. BSI and TMT scales are reverse coded such that higher scores indicate more symptoms or poorer performance.
Fitting metric Descriptive
statisticCT/MRI-positive
(n = 14)CT/MRI negative
(n = 30)Comparison
(n = 36)Significance Functional connectivity,
unlefted correlationMean 0.66 0.66 0.68 F(2,77) = 0.32, p = 0.73 SD 0.11 0.09 0.12 Minimum 0.50 0.33 0.35 Maximum 0.79 0.84 0.88 Functional connectivity dynamics,
Kolmogorov–Smirnov distanceMean 0.13 0.12 0.12 F(2,77) = 0.03, p = 0.97 SD 0.07 0.14 0.13 Minimum 0.04 0.03 0.03 Maximum 0.31 0.70 0.74 Iterations optimal solution
was chosen forMean 37.0% 34.5% 34.3% F(2,77) = 0.15, p = 0.86 SD 13.7% 16.2% 14.9% Minimum 15.0% 15.0% 15.0% Maximum 75.0% 90.0% 90.0%
In this issue


