

Article Figures & Data
Figures
- Figure 1.
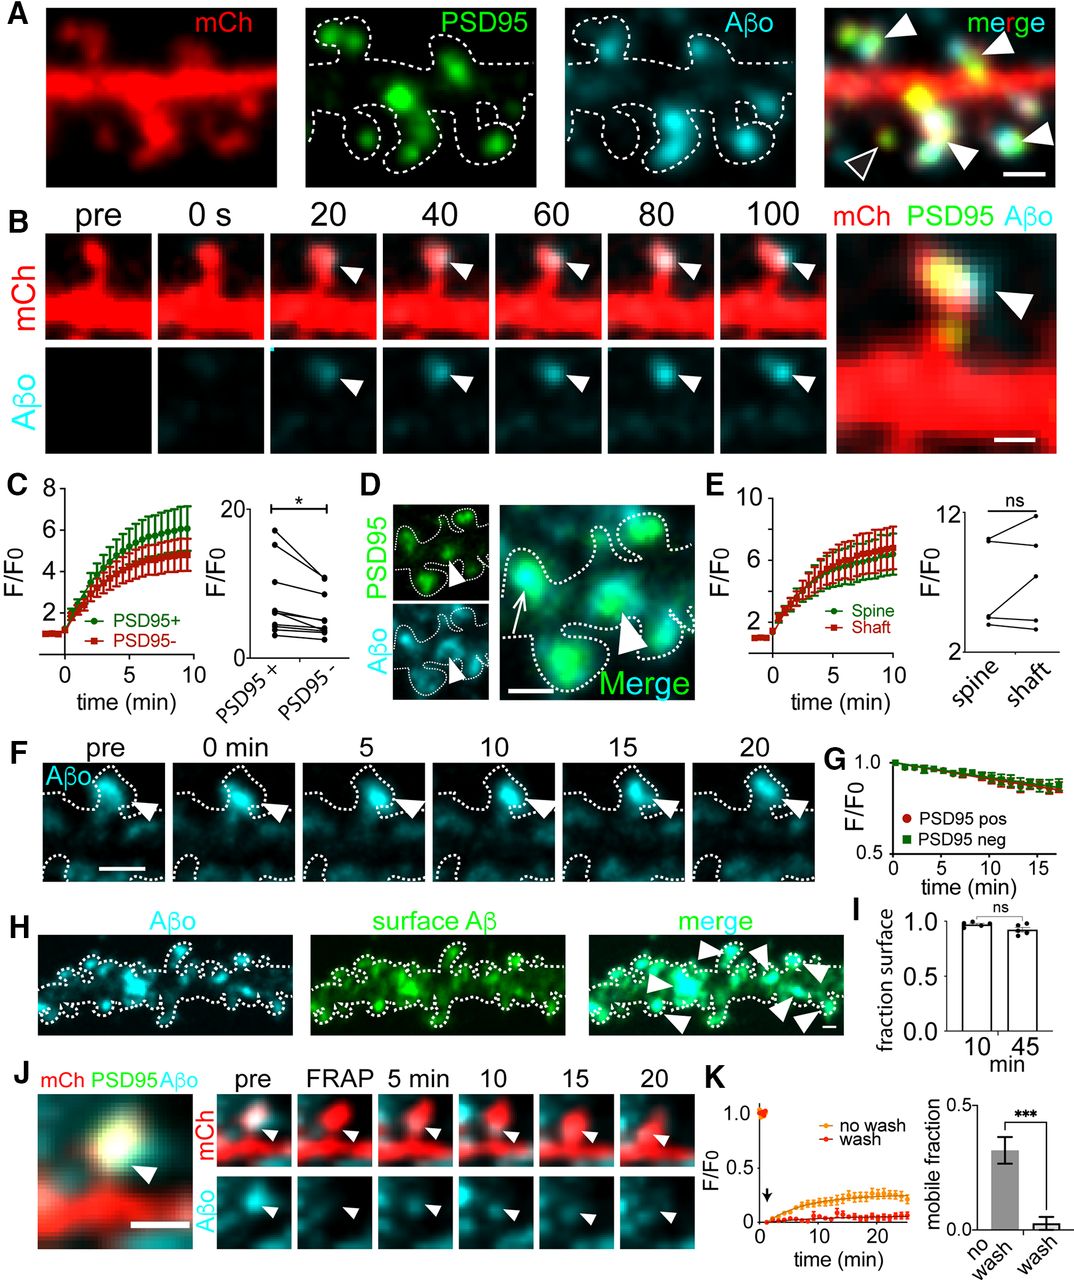
Kinetics of Aβ association and dissociation at synaptic sites. A, Representative dendritic segment from a neuron transfected with mCherry (red) and PSD95FingR-GFP (green) treated with labeled Aβo (teal) for 10 min. Closed arrowheads denote dendritic spines labeled with Aβo and the open arrowhead denotes a spine lacking Aβo. Fluorescent Aβ was confirmed to form oligomeric species and block LTP in Extended Data Figure 1-1. Scale bar: 1 μm. B, Representative image series of Aβo accumulation on a spine excitatory synapse. Aβo was added at 0 s. Scale bar: 1 μm. C, left, Quantification of Aβo association kinetics at PSD95-positive dendritic spines or neighboring PSD95-negative dendritic shafts (n = 10 neurons, 4 independent cultures). Right, Plateau intensity values for Aβo binding at PSD95+ versus PSD95– (shaft) locations on the same cell (n = 10 neurons; p = 0.0139, paired Student’s t test). D, Representative image of Aβo localization to spine (arrow) and shaft (arrowhead) PSD95. Scale bar: 1 μm. E, left, Aβo binding kinetics at PSD95 puncta on spines or shafts (n = 20 PSD95 puncta from 5 neurons, 3 independent cultures). Right, Plateau intensity values of Aβo at PSD95 puncta on the spine and shaft of the same neuron (n = 5 neurons, p = 0.2857, paired Student’s t test). ns = not significant. F, Representative image sequence of Aβo (teal) bound to a dendritic spine following washout into Aβo-free imaging media at t = 0 min. The cell outline is shown as a dashed line, drawn based on a cell fill (data not shown). Scale bar: 1 μm. G, Quantification of Aβo intensity following washout. Data are plotted as F/F0, with F0 representing normalized Aβo signal immediately before washout (n = 5 neurons). H, Representative image of a dendrite from a hippocampal neuron expressing mCh (dotted line), treated with labeled Aβo (cyan, left panel) for 10 min and then an extracellular antibody against Aβo to assess surface localization (green). Scale bar: 1 μm. I, Fraction of Aβo puncta (averaged per cell) labeled with an extracellular antibody (i.e., localized to the cell surface) 10 and 45 min following Aβo application (n = 5 neurons per group, two independent cultures). ns = not significant, Student’s t test. J, Representative time series for FRAP experiments. Shown is a single Aβo-bound spine. The Aβo signal was photobleached and signal recovery was monitored over time. Arrowheads indicate the location of photobleaching and signal recovery. Scale bar: 1 μm. K, Kinetics and extent of Aβo recovery following photobleaching in the continued presence (no wash, orange) or absence (wash, red) of Aβo in the extracellular solution (wash: n = 23 spines, from 6 neurons and 2 independent cultures; no wash: n = 12 spines from 4 neurons and 2 independent cultures). Quantification of the mobile Aβo fraction is shown to the right under each condition (***p = 0.0007, Student’s t test).
- Figure 2.
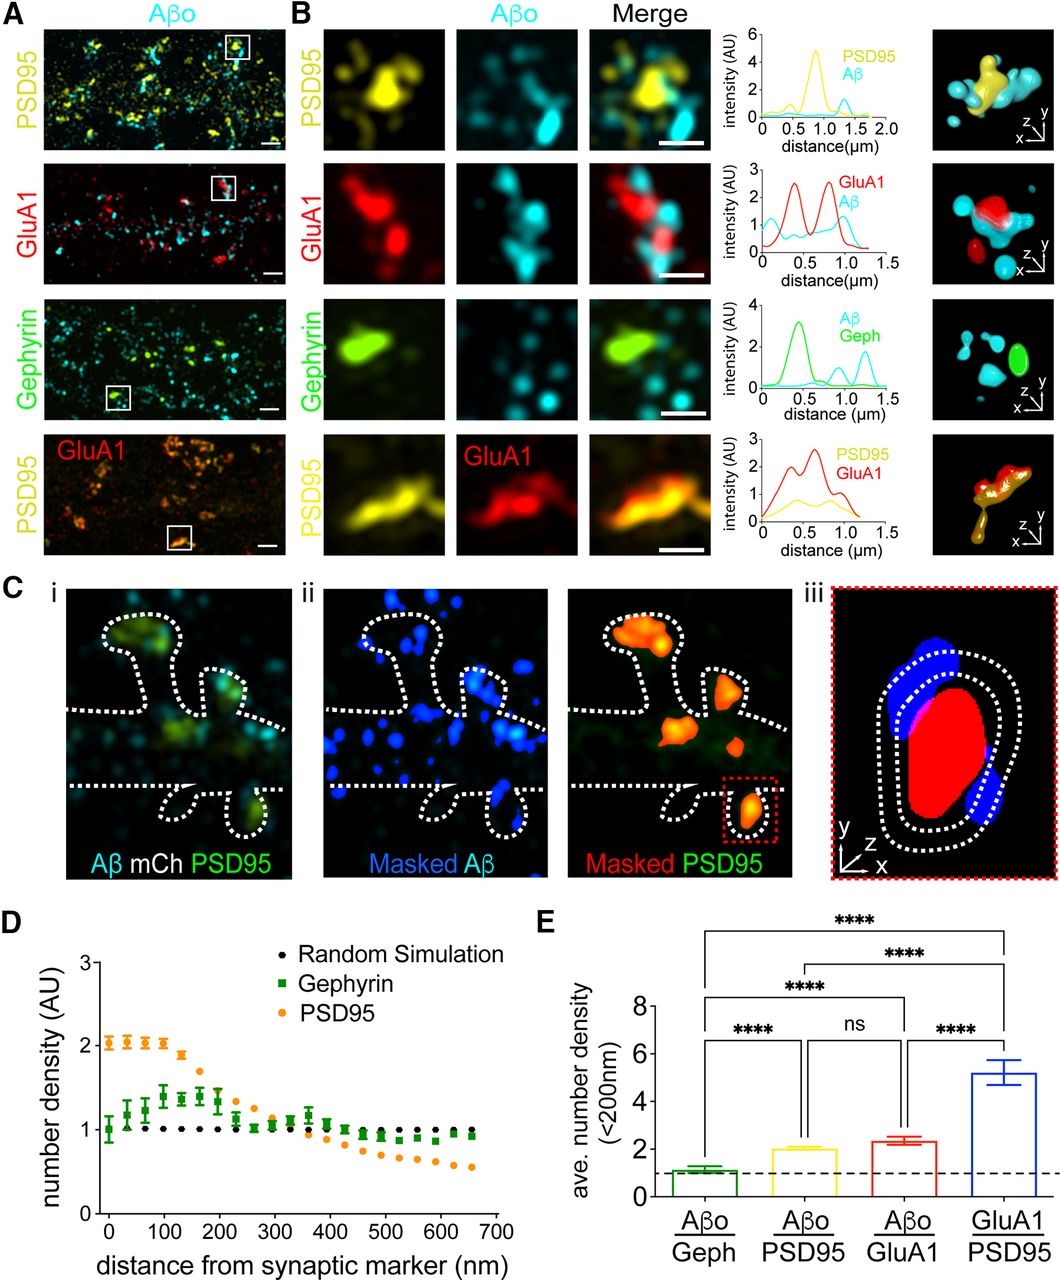
Super-resolution localization of Aβo relative to excitatory and inhibitory synapses. A, Representative SIM images of Aβo (teal) with excitatory synaptic proteins PSD95 (yellow), GluA1 (red), and the inhibitory synaptic protein Gephyrin (green). Bottom panels show control, GluA1 (red) with PSD95 (yellow). Scale bars: 1 μm. B, Expanded regions showing individual synapses from panel A. Scale bars: 500 nm. The graphs to the right of each example plot pixel intensities for each channel along a line drawn diagonally through representative synapses. 3D volume renderings of masked and segmented synapses are shown to the right. C, Approach for quantifying the spatial relationship between synaptic proteins and Aβo. i, Representative SIM image showing PSD95 (green) and Aβo (cyan). The outline of the cell (dashed line) was drawn using the signal from an mCh cell fill (data not shown). ii, The Aβo signal (cyan) is masked and binarized (blue). Right, PSD95 (green) is masked and binarized (red). iii, Magnified red box from ii. The number of Aβo puncta are counted at increasing concentric voxel distances around masked synaptic marker. D, The number of Aβo puncta (quantified as described in panel B) at different distances from either PSD95 (orange; n = 48 neurons) or gephyrin (green; n = 18 neurons), normalized to randomly localized simulated data (black; average of seven independent simulations). A value of 1 indicates no spatial relationship, >1 a positively correlated spatial relationship, and <1 a negatively correlated spatial relationship. E, Aβo is enriched near the excitatory PSD. Plotted is the average number density of segmented Aβo puncta 0–64 nm from PSD95, GluA1, or gephyrin (PSD95 n = 48 neurons, GluA1 n = 16 neurons, gephyrin n = 18 neurons). The average number density of the synaptic protein GluA1 relative to PSD95 is plotted for comparison (n = 7 neurons); ****p < 0.0001, one-way ANOVA. ns = not significant.
- Figure 3.
Single molecule localization microscopy reveals Aβo forms nanoscale clusters immediately adjacent to the synaptic membrane. A, Representative dSTORM images of synapses from hippocampal neurons labeled with PSD95 (magenta) that were treated with 500 nm Aβo (cyan) for 10 min. Three examples of raw localization data are shown. The bottom panels display localizations using a density-based lookup table with warmer colors representing higher density regions. The segmented PSD is shaded in gray. Scale bar: 200 nm. B, Representative dSTORM image of GluA1 (cyan) and PSD95 (magenta). Raw localizations are shown in the top panels and the bottom panels are rendered as in A. Scale bar: 200 nm. C, Quantification of the fraction of individual spine Aβo localizations that fall within the segmented PSD95 at single synapses (left; n = 24 synapses, 5 cells, 2 independent cultures). The same analysis is shown for GluA1 for comparison (right; n = 64 synapses, 11 cells, 3 independent cultures); ***p < 0.0001, Student’s t test. D, Frequency histograms are shown plotting the fraction overlap of segmented Aβo clusters (left) or GluA1 clusters (right) with the PSD. A value of 0 indicates no overlap with the PSD while a value of 1 indicates the cluster fell entirely within the PSD. Intermediate values indicate clusters that fell on the edge of the segmented PSD.
- Figure 4.
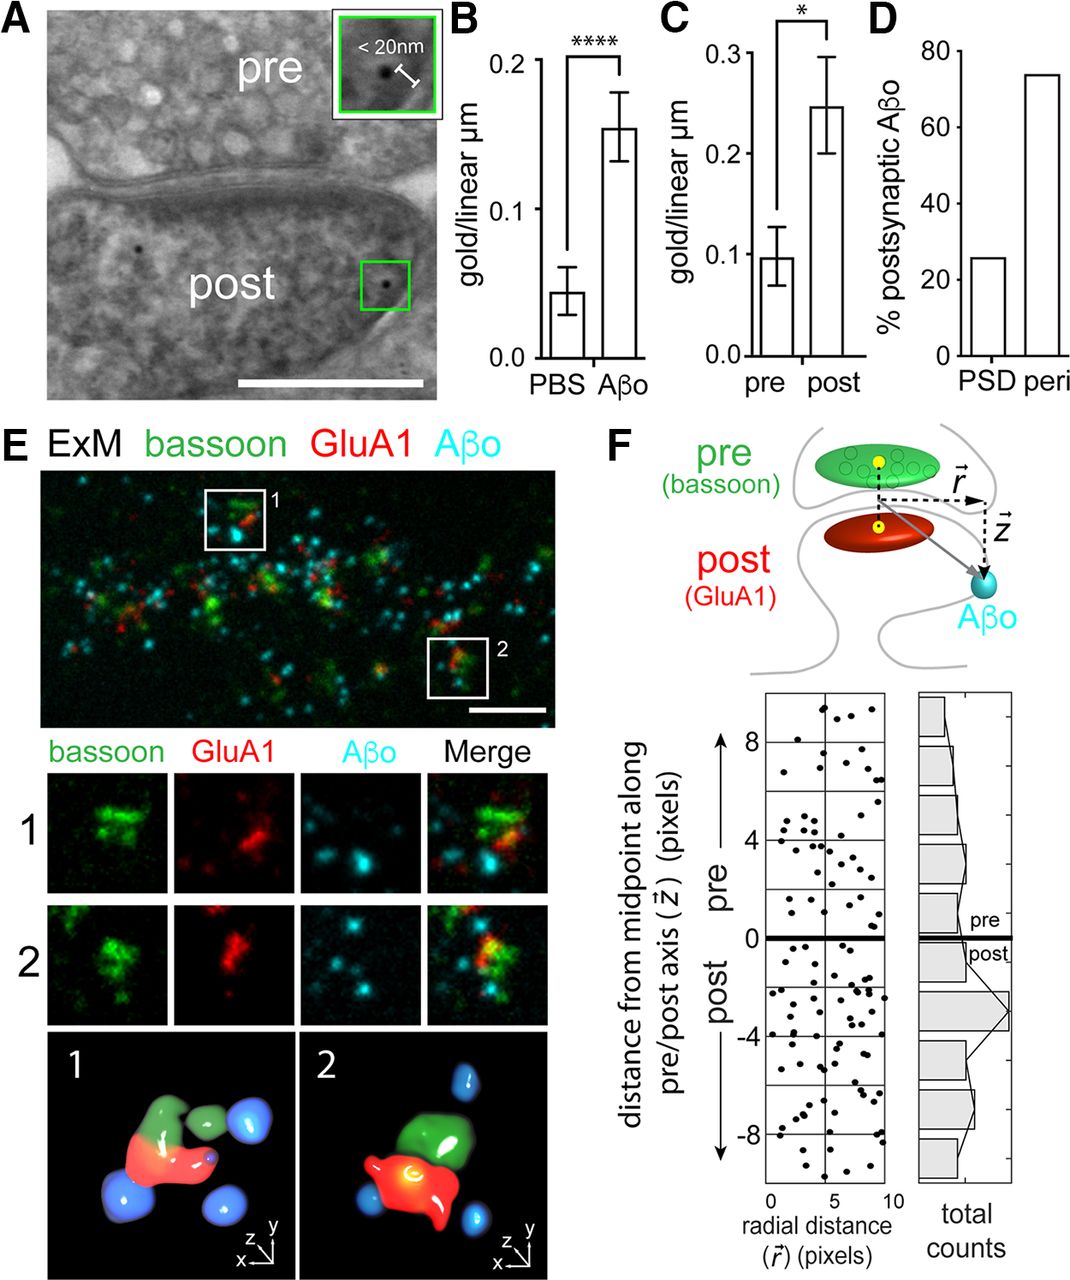
Aβo binds at both presynaptic and postsynaptic sites. A, Representative postembedding immunogold electron micrograph of a synapse exposed to 500 nm Aβo and labeled with an Aβ antibody and gold-conjugated secondary. The green box (magnified in inset) highlights immunogold signal. Gold particles within 20 nm of the cell membrane were considered plasma membrane-associated based on the size of the primary and secondary labeling antibodies. Scale bar: 200 nm. B, Quantification of total membrane-associated Aβo (measured as total number of gold particles per linear micron of plasma membrane) from samples treated with PBS alone or PBS with 500 nm Aβo. (PBS: n = 60 spines; Aβ: n = 66 spines; p < 0.0001, Mann–Whitney test). C, Quantification of Aβo label on the presynaptic or postsynaptic membrane (p = 0.0005, Mann–Whitney test). D, Percentage of the total dendritic spine gold particles that localized directly at the PSD or perisynaptic regions within 200 nm of the PSD (n = 27 gold particles). E, Representative image of a dendritic segment processed for ExM, labeled for presynaptic bassoon (green), postsynaptic GluA1 (red), and Aβo (cyan). The lower panels show two representative synapses (labeled 1 and 2) from the larger image and their respective 3D volume renderings. F, top, Schematic of the analysis used to quantify presynaptic and postsynaptic Aβo signal. The synaptic axis is defined by a line drawn between the centers of mass of masked bassoon (presynaptic marker) and GluA1 (postsynaptic marker) signals. A vector is generated from the middle of the pre/post axis to the center of mass of the segmented Aβo, with the component vectors representing the radial distance from the synapse center (r) and the distance along the pre/post axis (z). Bottom, Quantification of Aβo signal along the pre/post and radial axes. Negative and positive values indicate postsynaptic and presynaptic localization respectively. The number of Aβo puncta at different distances along the pre/post axis are summed and plotted in the histogram to the right (n = 89 synapses from 26 neurons from 3 independent cultures).
- Figure 5.
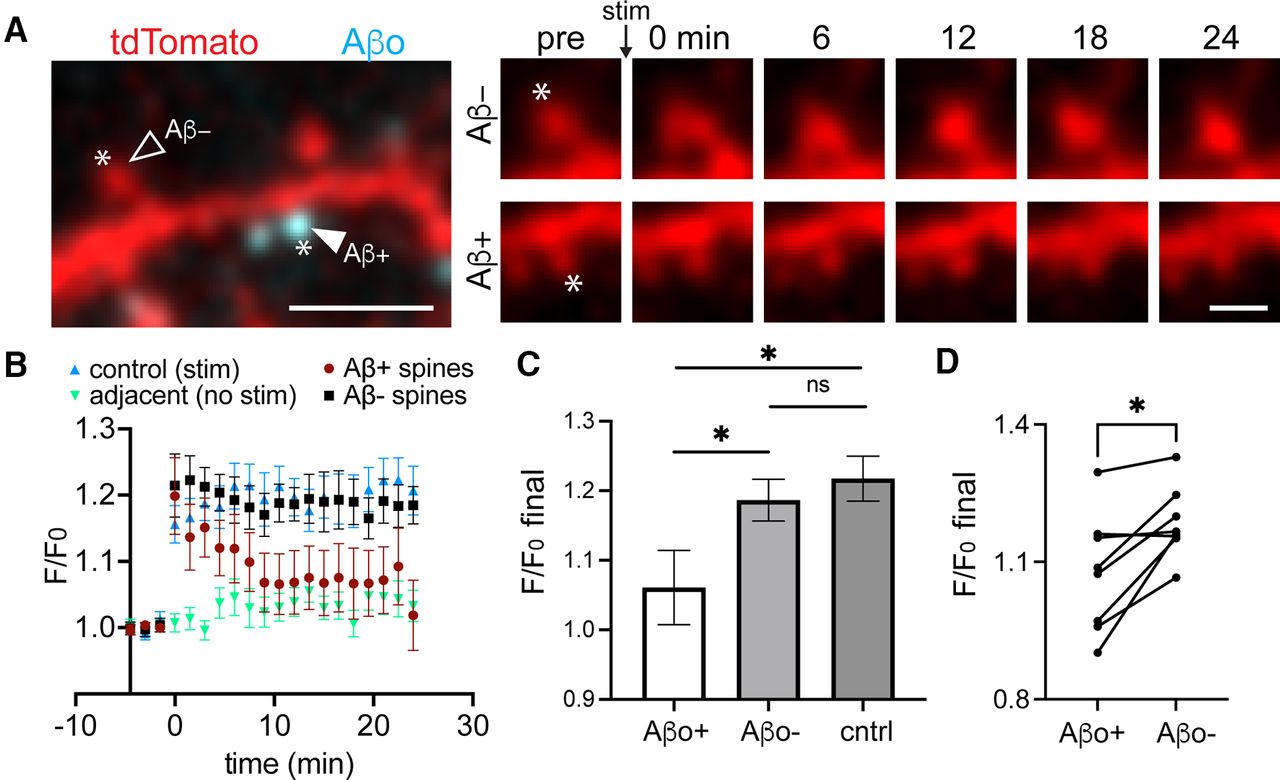
Aβo-mediated plasticity impairment is locally restricted near sites of surface binding. A, left, Representative image of a dendritic segment from a neuron transfected with tdTomato (red) and treated with Aβo-488 (teal). Asterisks designate the location of MNI-glutamate uncaging. The closed arrowhead shows a spine with bound Aβo (Aβ+), and the open arrowhead shows a neighboring spine lacking Aβo (Aβ–). Right, Time course of Aβo– spine (top) and Aβo+ spine (bottom) from the same dendritic segment before the uncaging stimulus and up to 24 min following the stimulus. Scale bars: 5 μm (left panel) and 1 μm (right panels). B, Quantification of spine size (based on the cell fill intensity) before and after MNI-glutamate uncaging for control spines not treated with Aβo (blue, n = 14 spines, N = 5 neurons, 3 independent cultures), adjacent spines that were not stimulated (green, n = 12 spines, N = 5 neurons, 3 independent cultures), Aβ+ spines from cultures treated with 500 nm Aβo for at least 25 min (maroon, n = 16 spines, N = 8 neurons, 3 independent cultures), and neighboring Aβo-lacking spines (black, n = 14 spines, 8 neurons, 3 independent cultures). C, Average increase in spine cell fill signal during the final 3 min of imaging compared with baseline for control (n = 14 spines, N = 5 neurons, 3 independent cultures), Aβo+ (n = 16 spines, N = 8 neurons, 3 independent cultures), and Aβo– (n = 14 spines, 8 neurons, 3 independent cultures; *p ≤ 0.05, Student’s t test). ns = not significant. D, Average F/F0 over the final 3 min of imaging compared with baseline at Aβo-bound spines and neighboring Aβo-free spines on the same neurons (eight neurons, three independent cultures, *p = 0.0116, paired t test).


Extended Data
Extended Data Figure 1-1
Fluorescent Aβ peptide forms oligomers that disrupt LTP. A, HiLyte647-conjugated Aβ peptide forms oligomeric species. Shown is an immunoblot (probed with anti-Aβ 6E10) of Aβo prepared with HiLyte647-labeled peptide. Note the presence of putative dimers (1), trimers (2), and higher molecular weight species (3) in the preparation. B, Aβo prepared with HiLyte647-labeled peptide disrupts LTP measured by EPSP slope (left) or peak EPSP amplitude (right). LTP was induced by delivering 2 × 1-s trains of 100-Hz stimulation spaced 5 min apart (arrows). Slices were exposed to Aβo for 20 min prior to LTP induction. n = 8 slices from 8 animals, control; 6 slices from 6 animals Aβo treated. C, Representative EPSPs from control (left) or Aβo-treated (right) slices before (black) and 45 min following (gray) LTP induction. D, Average EPSP slope (left) and amplitude (right) for control (PBS treated) or Aβo-treated slices 45 min following LTP induction. The dashed line represents baseline; *p < 0.05, Student’s t test. Download Figure 1-1, TIF file.
In this issue


