

Article Figures & Data
Figures
- Figure 1.
CCK-Cre mice provide a tool to suppress activity specifically in bulbar TCs. A, CCK expression in a tdTomato reporter mouse line. CCK is densely expressed in cells in the inner portion of the glomerular layer and outer portion of the external plexiform layer. Scale bar, 100 μm. B, Example membrane voltage responses from a PG cell (top) and an eTC (bottom) in a CCK-NpHR3.0 mouse in response to a 1 s pulse of 590 nm LED light. C, Summary data of NpHR3.0-induced membrane voltage changes in eTCs (n = 14) and PG cells (n = 6). D, Example spike recordings from an eTC in LCA configuration. Yellow bar denotes a 590 nm light pulse. E, Top, Raster plot of 20 trials recorded from the same cell as in D. The mean PSTH of all trials (black curve) is superimposed. Shaded area denotes SE. Bin width = 30 ms. Bottom, A histogram of all trials. F, G, Example spike recordings from an eTC in current-clamp configuration. Plots are the same as in D and E. H, Summary data from combined LCA (n = 4; dashed lines) and current-clamp (n = 8; solid lines) experiments. Firing rate calculated as the mean in each epoch. Error bars indicate the SEM. I, Mean PSTH across all recordings (n = 12). *** denotes p < 0.001.
- Figure 2.
Light application in CCK-NpHR3.0 mice reduces the frequency of spontaneous excitatory synaptic inputs onto PG cells but not eTCs. A, The subtype of PG cell (external tufted driven vs olfactory nerve driven) for this analysis was determined by applying electrical stimulus pulses to OSN axons (downward arrows). Note the barrage of evoked EPSCs in the voltage-clamped cell (Vhold = –77 mV), characteristic of ETd-PG cells. B, Example recordings of sEPSCs (no stimulation) in an ETd-PG cell across three consecutive sweeps. The yellow bar denotes a 590 nm light pulse for 1 s to suppress TC output. The traces to the right depict expanded sections of the second sweep, highlighting examples of sEPSC bursts that reflect spike bursts in connected eTCs (Shao et al., 2009). C, Top, Raster plot of 20 trials recorded from the same cell as in A. The mean PSTH of all trials is superimposed in red, the shaded area denotes SEM. Bottom, A histogram of all trials from the raster plot above. D, Example sEPSC recordings from an eTC and expanded traces to the right noting the absence of sEPSC bursts. E, Plots are same as B, but for the eTC shown in D. F, Mean sEPSC PSTHs across all PG cells (n = 6) and eTCs (n = 7). G, Summary data from all PG cells. H, Summary data from all eTCs. * denotes p < 0.05, n.s. not significant.
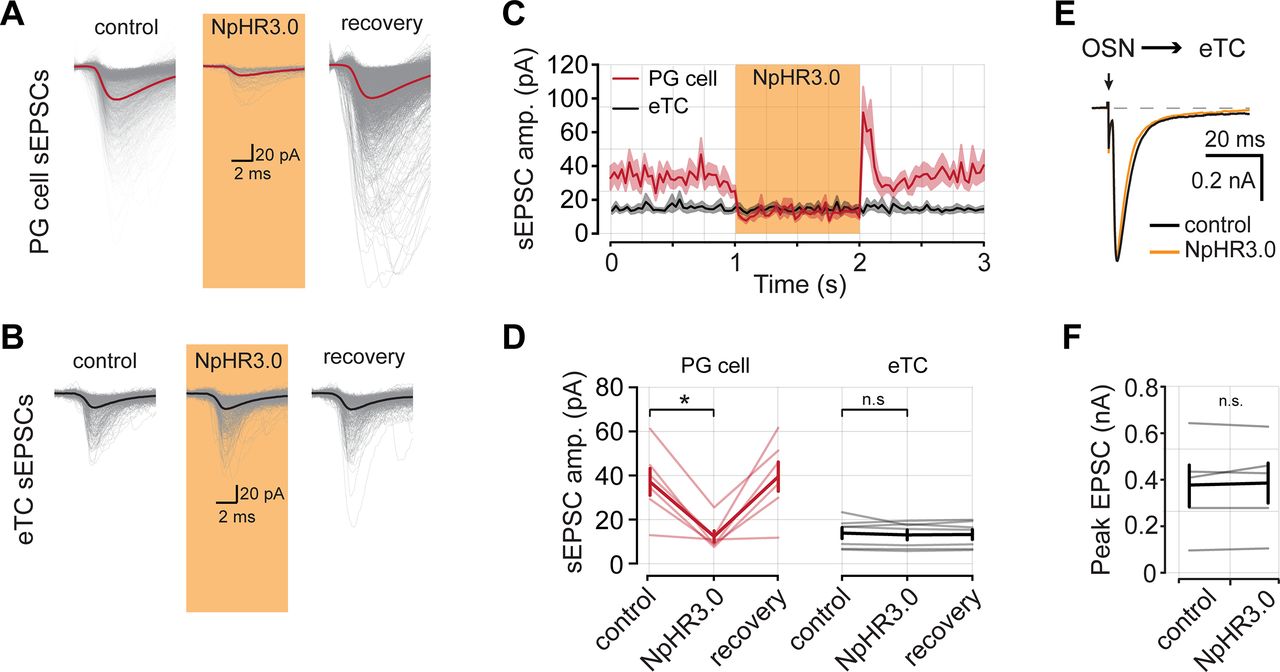
- Figure 3.
Light application in CCK-NpHR3.0 mice eliminates large-amplitude sEPSCs in PG cells. A, Aligned sEPSCs captured from an example PG cell in each epoch. B, Aligned sEPSCs captured from an example eTC. C, PSTH of mean sEPSC amplitude across all PG cells and eTCs (n = 6 PG cells, n = 7 eTCs). D, Summary data from all cells in each recording epoch eTCs [reduction in PG cells, 61.84 ± 9.87% (p = 0.031); reduction in eTCs cells, 5.18 ± 4.22% (p = 0.688; Wilcoxon signed-rank test)]. E, Example EPSCs evoked by OSN stimulation recorded from an eTC and during TC inactivation with NpHR3.0. Downward arrow denotes stimulus to OSNs. F, Summary of evoked EPSC amplitudes from five eTCs (control trials, 372.31 ± 91.51 pA; vs NpHR3.0 trials, 381.39 ± 88.64 pA; p = 0.945; Wilcoxon signed-rank test). * denotes p < 0.05, n.s. not significant.
- Figure 4.
Evoked EPSCs in ETd-PG cells require activation of CCK-expressing TCs. A, Example EPSCs evoked by OSN stimulation in a PG cell. Each panel contains five overlaid trials. Downward arrows correspond to OSN stimulation. B, Raster plot of EPSCs from the PG cell in A. The yellow bar indicates the presence of 590 nm light to suppress CCK-expressing cells with NpHR3.0. C, EPSC count of each trial in B in the 300 ms immediately following OSN stimulation. D, Summary PSTH of EPSC frequency across all PG cells (n = 6). Red trace, control trials; yellow trace, trials with the LED on. Note: the drop in EPSC frequency right at OSN stimulation reflects obscuring of the EPSCs by the stimulus artifact; the jump in EPSC frequency that follows is consistent with the kinetics of a monosynaptic OSN-driven EPSCs in PG cells that has been reported by Shao et al. (2009). E, Summary data of evoked EPSC frequency in the 10–300 ms window following ON stimulation (control trials, 36.21 ± 3.47 Hz; vs NpHR3.0 trials, 8.46 ± 1.52 Hz; n = 6; p = 0.031, Wilcoxon signed-rank test). F, Summary of baseline EPSC frequency during control and NpHR3.0 trials (control trials, 12.93 ± 4.57 Hz; vs NpHR3.0 trials, 17.31 ± 5.08 Hz; p = 0.094, Wilcoxon signed-rank test). G, Top, Evoked spikes recorded in an MC under control conditions and during TC inactivation. Bottom, Example excitatory currents recorded from the same MC. TC inactivation reduced the size of the current. H, Excitatory current area measurements from three MCs on interleaved trials of TC inactivation with NpHR3.0. The dashed line represents the MC in G. I, Summary data of effects on TC inactivation on OSN-evoked excitatory currents measured in MCs. * denotes p < 0.05, n.s. not significant.
- Figure 5.
Pair-cell recordings show that eTCs provide direct input to PG cells, but not other eTCs. Ai, Example eTC–eTC pair recording in rat olfactory bulb slices. eTC1 is recorded in current clamp and depolarized to generate spikes. Excitatory currents are recorded from eTC2 in voltage-clamp configuration. Three consecutive sweeps are shown in both cells as well as the average response in eTC2 (bottom). Note that the evoked responses are dominated by a small-amplitude prolonged current. A cell-fill image of the eTC–eTC pair is shown in the inset. Scale bar, 20 μm. Aii, Top, Raster plot of rapid EPSCs detected in eTC2 from Ai across 20 trials. EPSCs were detected as in previous figures. The black curve is the mean PSTH, and the shaded area is the SEM. Bottom, Pooled bin counts for 20 trials. B, Same as A, but for an eTC–PG cell pair. The eTC was depolarized in current-clamp configuration to generate spikes, and EPSCs were measured from the PG cell in voltage-clamp mode. C. Mean rapid EPSC PSTHs from 25 eTC–eTC pairs and 6 eTC–PG cell pairs. D, Summary data of the mean EPSC frequency in the baseline period and the 80 ms following eTC stimulation. E, Summary data comparing the integrated charge in postsynaptic eTCs and PG cells [eTC–eTC pairs (n = 25), 141.65 ± 30.04 pA • ms; vs eTC–PG cell pairs (n = 6), 432.49 ± 126.60 pA • ms; p = 0.010, Wilcoxon rank-sum test]. F, Comparison of the normalized change in fast EPSC rate with the magnitude of charge transfer in eTC–eTC pairs (R = −0.16; p = 0.44). * denotes p < 0.05, ** p < 0.01.
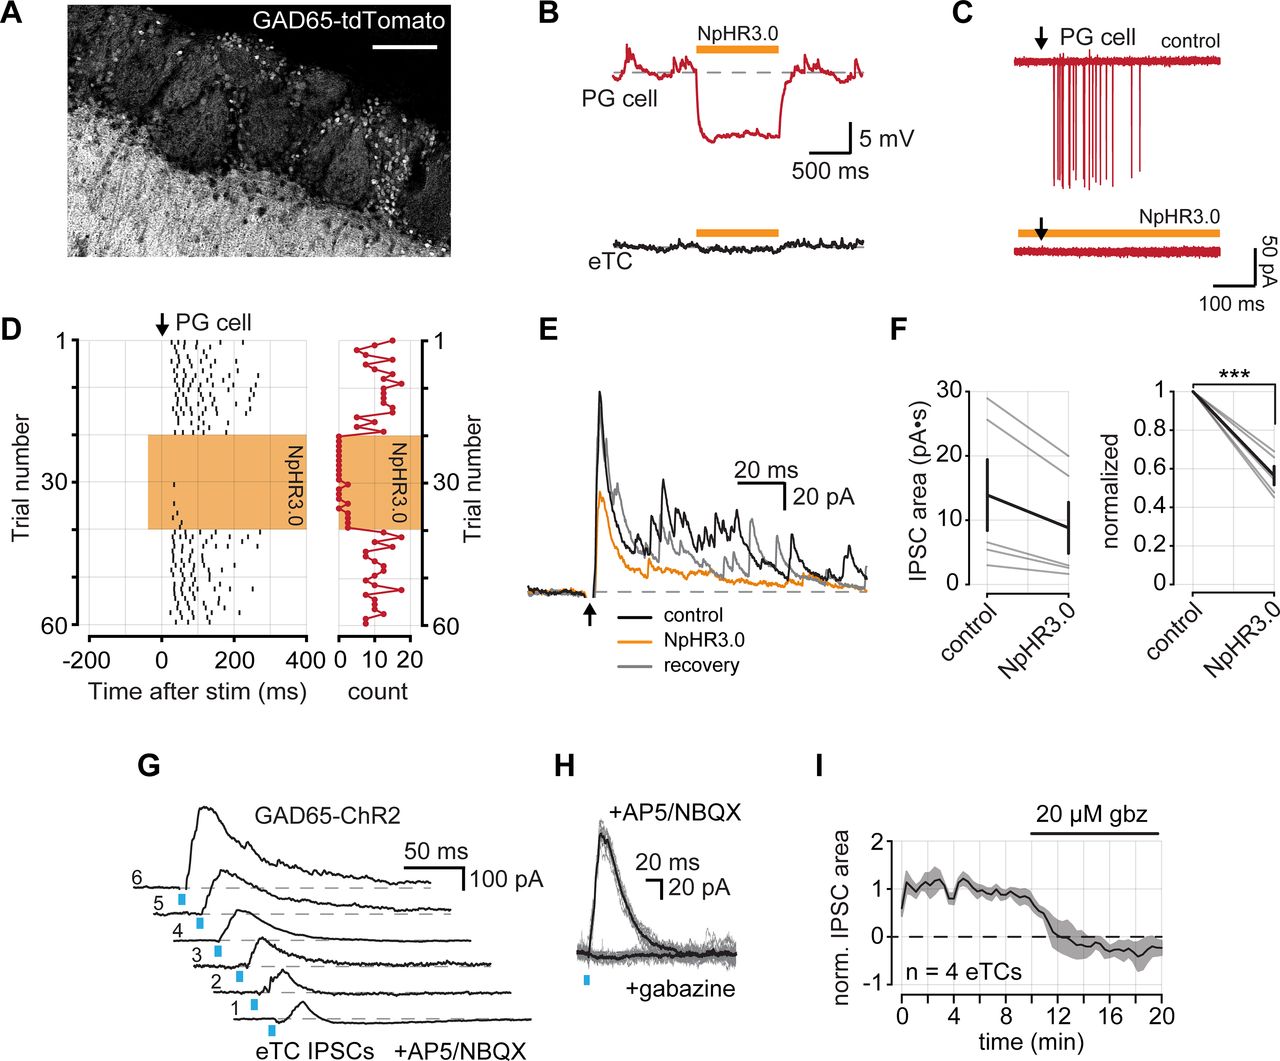
- Figure 6.
GAD65-expressing PG cells inhibit eTCs. A, GAD65 expression in a tdTomato reporter mouse line. GAD65 is expressed in the soma of PG cells that surround glomeruli. GAD65 expression is also observed in the EPL, likely reflecting granule cell apical dendrites. Scale bar, 100 μm. B, Example membrane voltage responses from a PG cell (top) and an eTC (bottom) in a GAD65-NpHR3.0 mouse in response to a 1 s pulse of 590 nm light. C, Example OSN-evoked (8 μA stimulus) spikes from a PG recorded in LCA configuration. Five overlaid trails under control conditions and during NpHR3.0 activation. Downward arrow corresponds to OSN stimulation. D, Left, Raster plot of evoked spikes per trial from the cell in C. Right, A plot of the number of spikes following each OSN stimulation. E, Example IPSCs evoked by OSN stimulation recorded from an eTC (Vhold = +28 mV) under control conditions, during NpHR3.0 activation, and following recovery. Each trace is an average of 10 consecutive trials in each condition. F, Left, Summary of OSN-evoked IPSC areas. Right, Summary of normalized IPSC areas (reduction, 43.48 ± 4.76%; n = 5; p < 0.001, Student’s t test). G, Example IPSCs recorded from six eTCs following 470 nm LED light stimulation in OB slices prepared from GAD65-ChR2 mice. H, IPSCs were eliminated by bath application of gabazine. Light-colored traces are individual trials and dark is the mean of all trials. I, Time course of IPSC block with gabazine from four eTCs. IPSC areas are normalized to the mean control area for each cell. *** denotes p < 0.00.


In this issue


