

Article Figures & Data
Figures
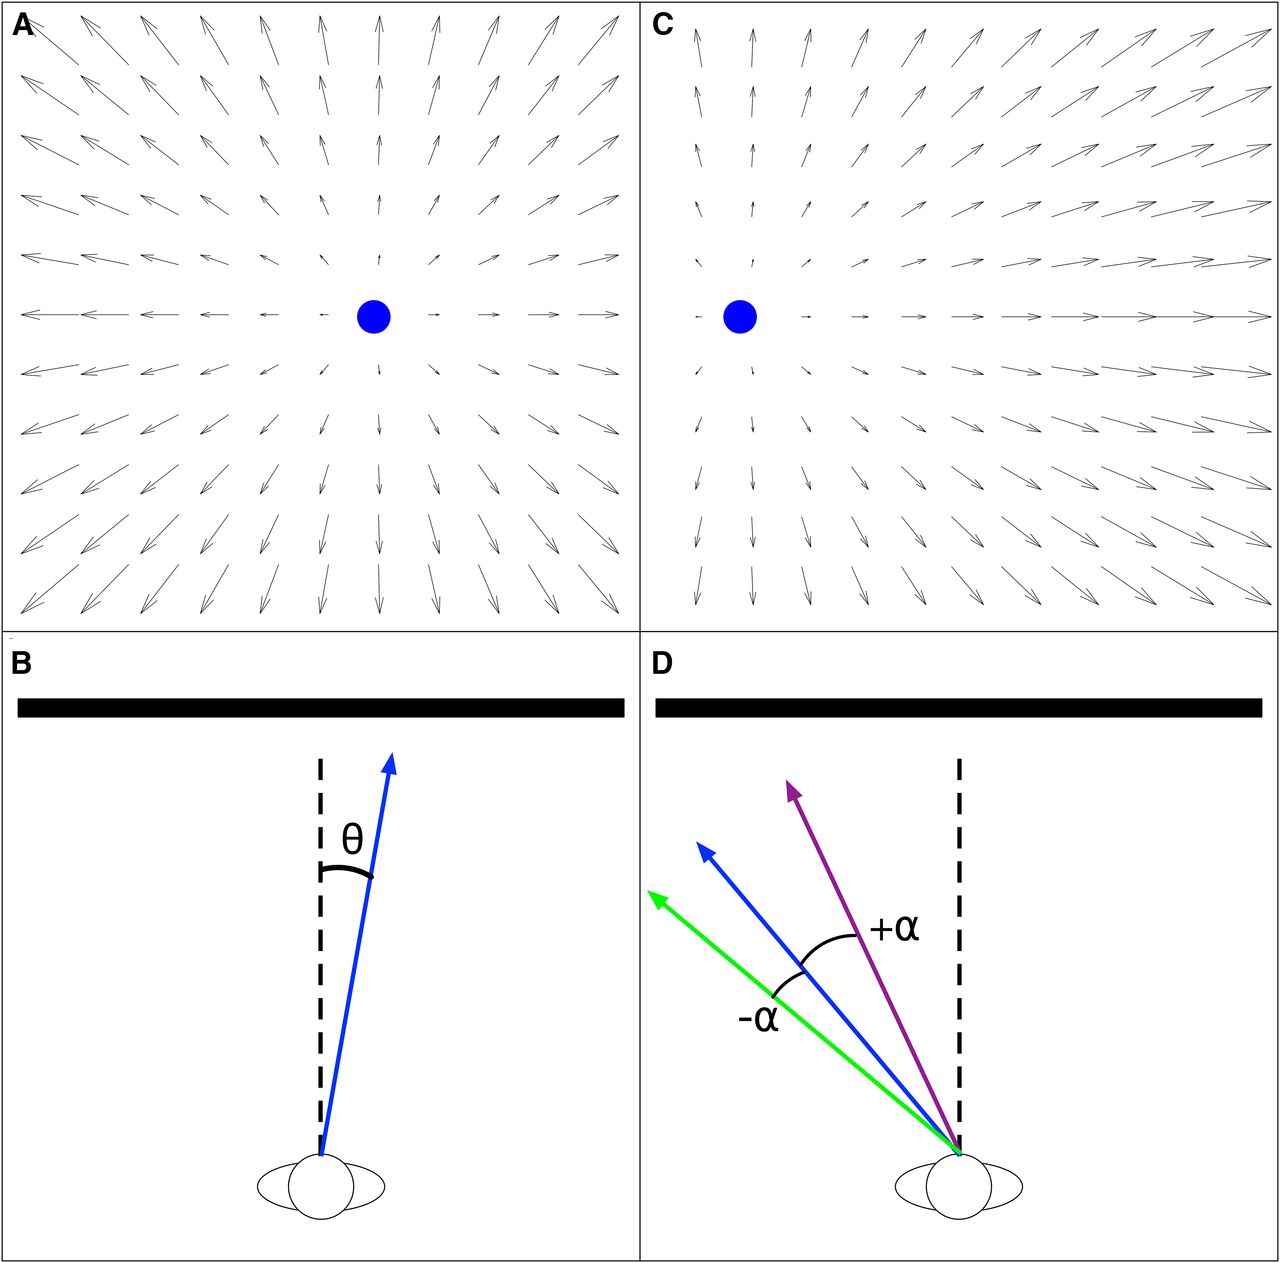
- Figure 1.
A, Idealized optic flow experienced by an observer heading +10° to the right of the straight-ahead direction (FoE indicated by blue disk). B, Bird’s eye view of scenario in A. Dashed line indicates the straight-ahead direction, blue solid arrow indicates the observer’s heading θ. C, Optic flow experienced by an observer moving at a peripheral −40° heading. D, Top-down bird’s eye view of the scenario from C, which highlights our convention for representing heading bias. Purple solid arrow illustrates underestimation of the judged heading angle or center bias (heading error α > 0° toward the straight-ahead direction) and green solid arrow illustrates overestimation of the judged heading angle or peripheral bias (heading error α < 0° away from the straight-ahead direction). The optic flow shown in top panels reflects a 90° field of view.
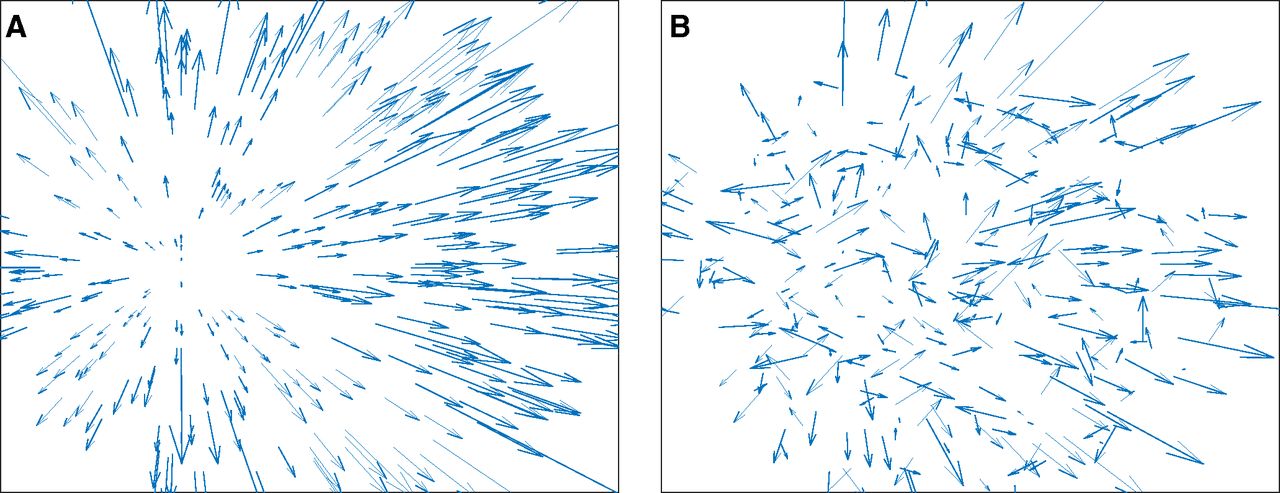
- Figure 2.
Sample frames from optic flow stimuli. A, Self-motion along a −20° heading through a 3D dot cloud. B, Same scenario as A with 70% noise (n = 0.7).
- Figure 3.
Schematic showing the architecture of MT-MSTd template models. Direction and speed tuned units in MT activate to the optic flow input and send feedforward signals to MSTd. Connections are structured such that tuning preferences in MT match a radial template pattern consistent with self-motion in a particular direction.
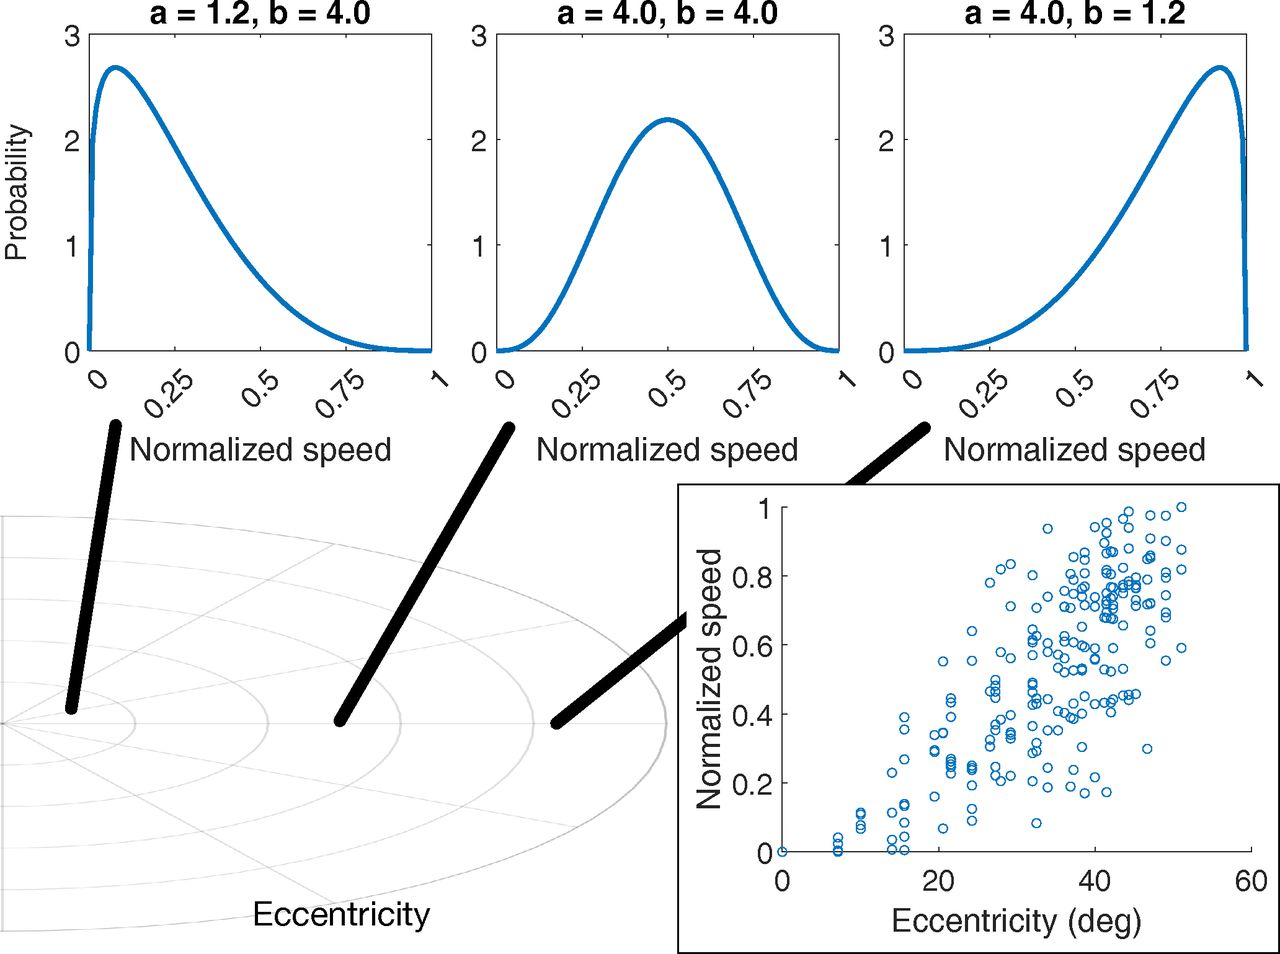
- Figure 4.
Methodology used to scale speed preference with eccentricity in MT speed tuning experiment. The eccentricity of a MT unit’s RF (bottom left) is used to parameterize the beta distribution that is sampled to determine the preferred speed (top). For example, the preferred speed of a foveal MT unit is drawn from beta distribution with most of the density concentrated around slow speeds (top-left plot). The bottom-right scatter plot shows the preferred speeds in the simulated population normalized to range of the optic flow speeds present in the stimulus.
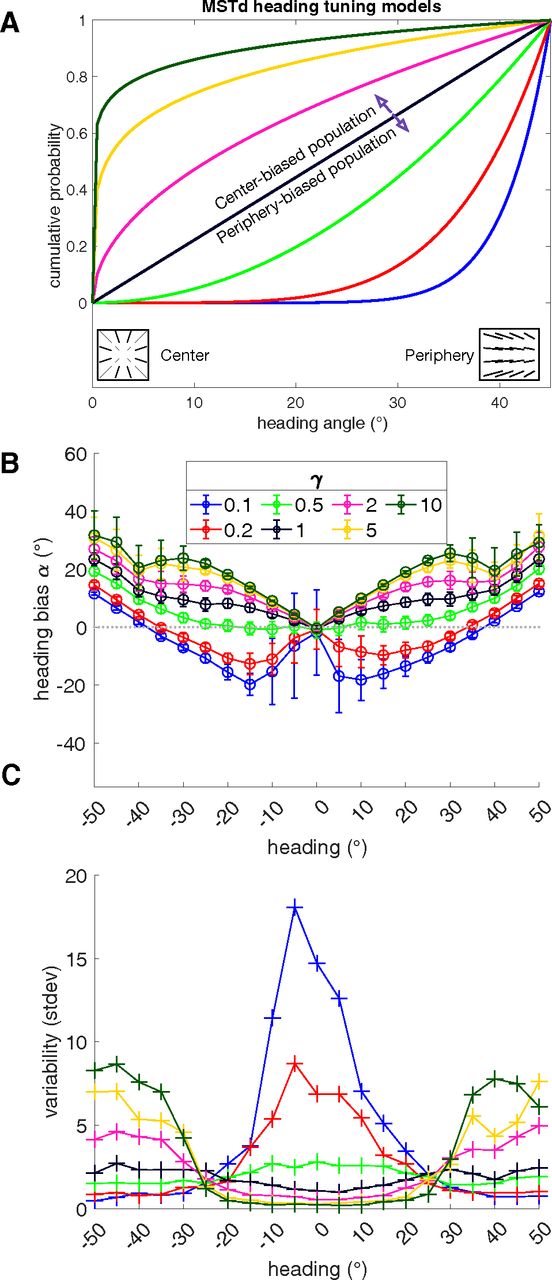
- Figure 5.
Simulations showing the effect of the heading representation of MSTd on estimates. A, The cumulative probability of sampling each MSTd unit’s preferred heading according to different MSTd models. The distribution of heading selectivity across the center-peripheral axis depends on each model’s γ value. Only positive (rightward) headings are depicted, but the model samples headings from all 2D headings within the field of view. B, Heading bias produced by simulating each model with self-motion along central-peripheral azimuthal axis within ±45° of center. Negative (positive) biases correspond to heading errors toward the periphery (center). Negative (positive) heading values correspond to self-motion to the left (right) of the straight-ahead direction, respectively. Each point indicates the mean over 50 model runs and error bars show ±1 SD. C, Variability (in SDs) obtained in the simulations plotted in B.
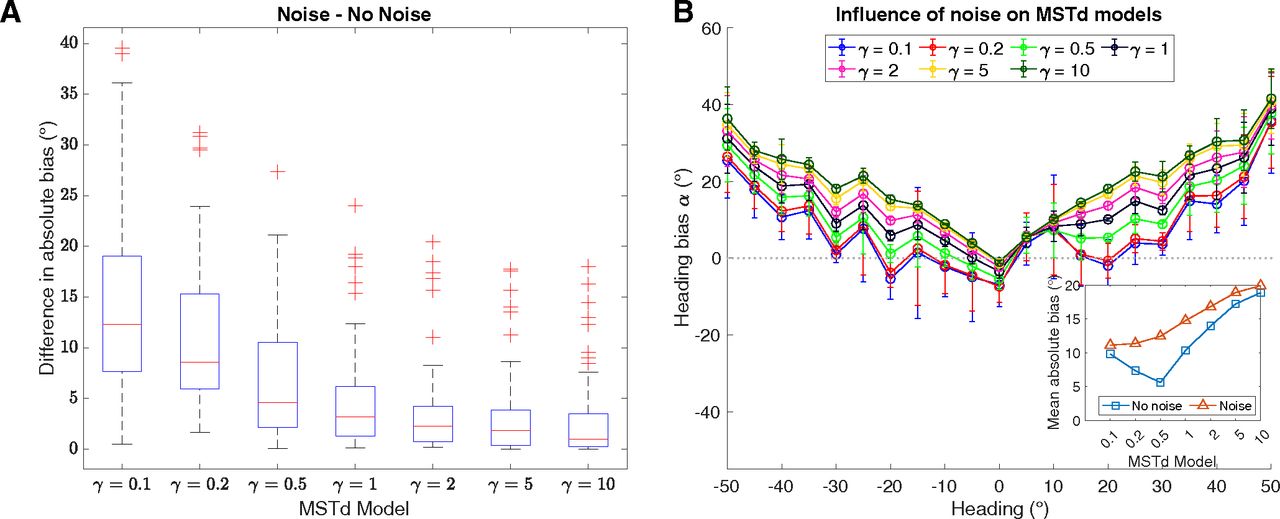
- Figure 6.
Simulations of optic flow containing noise using MSTd models with different heading representations. A, Box plot showing the absolute difference between the no noise condition and the noise stimuli that had 21 different headings and three noise levels (70%, 80%, or 90% noise dots). B, Mean heading bias averaged across noise levels produced by each MSTd model for each heading (same plotting conventions as Fig. 5). Inset compares mean absolute heading bias between the noise (red) and no noise (blue) stimuli, averaged across individual heading directions.
- Figure 7.
Simulations showing the effect of MSTd RF size on heading estimates. A, Schematic showing the simulated MSTd RF sizes (gray circles) compared with the 90° simulated field of view (black circle). B, C, Heading bias obtained over 50 runs of the peripheral (B; γ = 0.5) and central (C; γ = 2) MSTd models. D, E, Difference in mean heading bias produced by the peripheral (D; γ = 0.5) and central (E; γ = 2) MSTd models between the noise and no noise conditions. Insets show the absolute difference in heading bias between the noise and no noise conditions averaged across headings. Positive values indicate increased bias toward the straight-ahead.
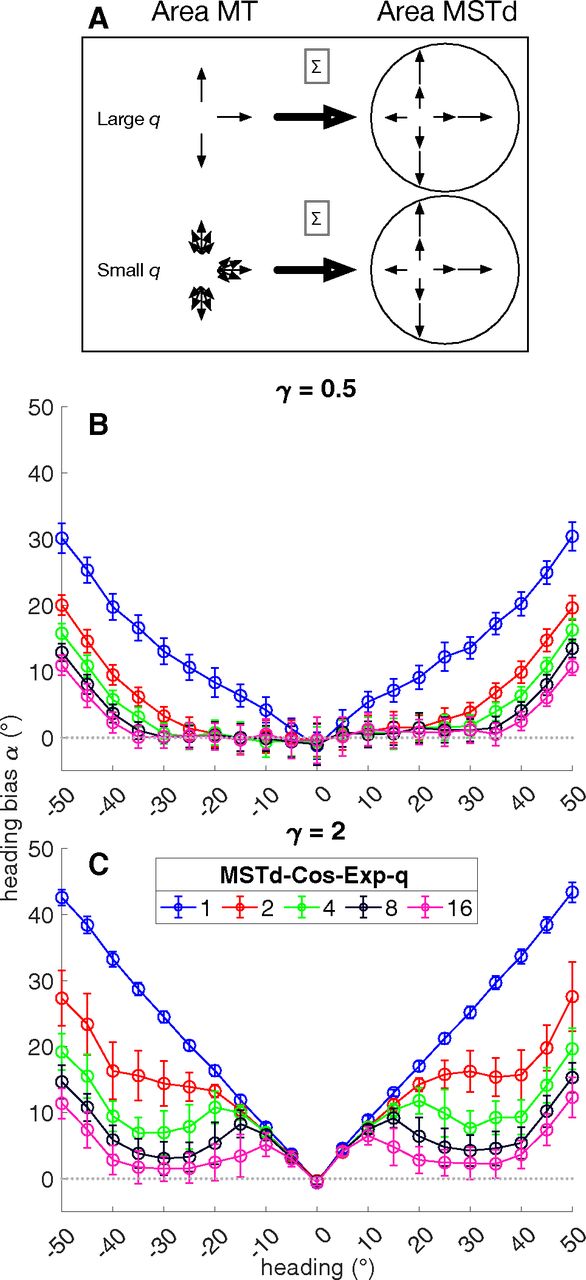
- Figure 8.
Simulations focusing on direction selectivity in MSTd. A, We varied model parameter q that controlled the range of directions each MSTd unit integrated that deviated from the preferred radial pattern. Large q values increased the selectivity and in the extreme case, MSTd units would only integrate directions that exactly match the preferred radial pattern. Smaller q values increased the range of integrated directions, centered around each preferred radial direction. B, Mean bias for each heading direction produced by the peripheral MSTd model configured with different q values. C, Same as B except for the central MSTd model. Same plotting conventions as Figure 5.
- Figure 9.
Simulations focusing on the effect of MT direction tuning on MSTd heading signals. A, Schematic illustrating the influence of the parameter σd on MT direction selectivity. Values close to 0° result in direction tuning that resembles a radial pattern across the population. Larger values define the maximum bilateral extent to which MT units may deviate from the radial direction. The σd = 360° condition created uniform random selectivity across MT. B, C, Heading bias obtained over 50 runs from the peripheral (B; γ = 0.5) and central (C; γ = 2) MSTd models. Same plotting conventions as Figure 5. D, E, Difference in mean heading bias produced by the peripheral (D; γ = 0.5) and central (E; γ = 2) MSTd models between the noise and no noise conditions. Same plotting conventions as Figure 7.
- Figure 10.
Simulations focusing on the effect of MT speed tuning on MSTd heading signals. A, Schematic depiction of the four MT speed tuning models considered: (0) direction only, (1) uniform random, (2) likelihood of faster preference increases with eccentricity, (3) likelihood of faster preference and RF size increase jointly with eccentricity. B, C, Heading bias obtained over 50 runs from the peripheral (B; γ = 0.5) and central (C; γ = 2) MSTd models. Same plotting conventions as Figure 5. D, E, Difference in mean heading bias produced by the peripheral (D; γ = 0.5) and central (E; γ = 2) MSTd models between the noise and no noise conditions. Same plotting conventions as Figure 7.
- Figure 11.
Simulation results from Figure 5B expressed with respect to bias (A) and raw heading estimates (B). Thick black curve in B indicates unity line. Same plotting conventions as Figure 5.


Tables
- Table 1
Parameters that characterize the optic flow inputs used to simulate neural models of MT and MSTd
Parameter Description Value 3D dot cloud extent 300 × 300 × 100 m θ Observer heading o Observer speed 1.5 m/s h Observer height 1.61 m v Field of view 90° f Focal length 1.74 cm T Dots in scene 300 n Noise dot proportion nm Maximum random (X, Y, Z) displacement of each noise dot around its
constant observer-relative position on each frame1 m F Duration 2 s (60 frames) Spatial resolution 128 × 128 pixels Parameter Description Value NMT Number of MT units 225 Coordinates of visual field left Coordinates of MT RF left Arranged in a 15 × 15 grid spaced apart by 7.1° (8 pixels) σd Maximum extent of random deviation in MT direction
preference about the radial direction180° σr Effective RF radius 6° (7 pixels) σv Sensitivity to optic flow that differs from the preferred direction 10° σs Sensitivity to optic flow that differs from the preferred speed 0.5°/s (0.45 pixels/s) αMT MT activation passive decay rate 0.1 βMT MT activation upper bound 2.5 dt Integration time step 0.1 Parameter Description Value NMST Number of MSTd units 169 γ Controls left-peripheral bias in heading representation 0.5 (“peripheral model”), 2 (“central model”) σMST Controls size of MSTd RFs 77 pixels αMST MSTd activation passive decay rate 0.1 βMST MSTd activation upper bound 2.5 Experiment Description Parameter Values MSTd heading left-peripheral bias in heading representation γ MSTd RF size SD of Gaussian RF σMSTd [11.3°, 21.8°, 38.7°, 50.2°, 58.0°, 63.4°]
([12.8, 25.6, 51.2, 76.8, 102.4, 128] pixels)MSTd direction Degree of intolerance to MT inputs that
mismatch the preferred radial patternq MT direction maximum extent of random deviation between
the radial direction and each MT preferred directionσd [0°, 60°, 120°, 180°, 240°, 300°, 360°] MT speed Baseline beta distribution shape used to sample
speed preferences of each MT unitks 4 MT speed + RF Intercept of linear regression fit that determines
RF size from eccentricityβecc,0 0.19° (0.42 pixels) MT speed + RF Slope of linear regression fit that determines RF
size from eccentricityβecc,1 [0.27, 0.54, 0.81, 1.07]° ([0.3, 0.6, 0.9, 1.2]) pixels
Extended Data Figure 5-1
Effect of MT cell placement. Our goal for the simulations depicted in Figure 5 was to focus on the influence of MSTd tuning on heading estimation while maintaining a consistent model MT. Toward this end, we distributed MT units in a 2D rectilinear grid; positioning MT RFs randomly, as we do in MSTd, might contribute error and variability to heading estimates unrelated to MSTd. Given that an even distribution of MT RFs across visuotopic space may not be a plausible assumption, we repeated the simulations whose results are shown in Figure 5 wherein MT RFs were placed randomly for two of the MSTd tuning models. As this figure shows, there is no meaningful difference in mean heading errors and variability when placing MT units randomly and on a regular 2D grid. Download Figure 5-1, EPS file.
In this issue


