

Article Figures & Data
Figures
- Figure 1.
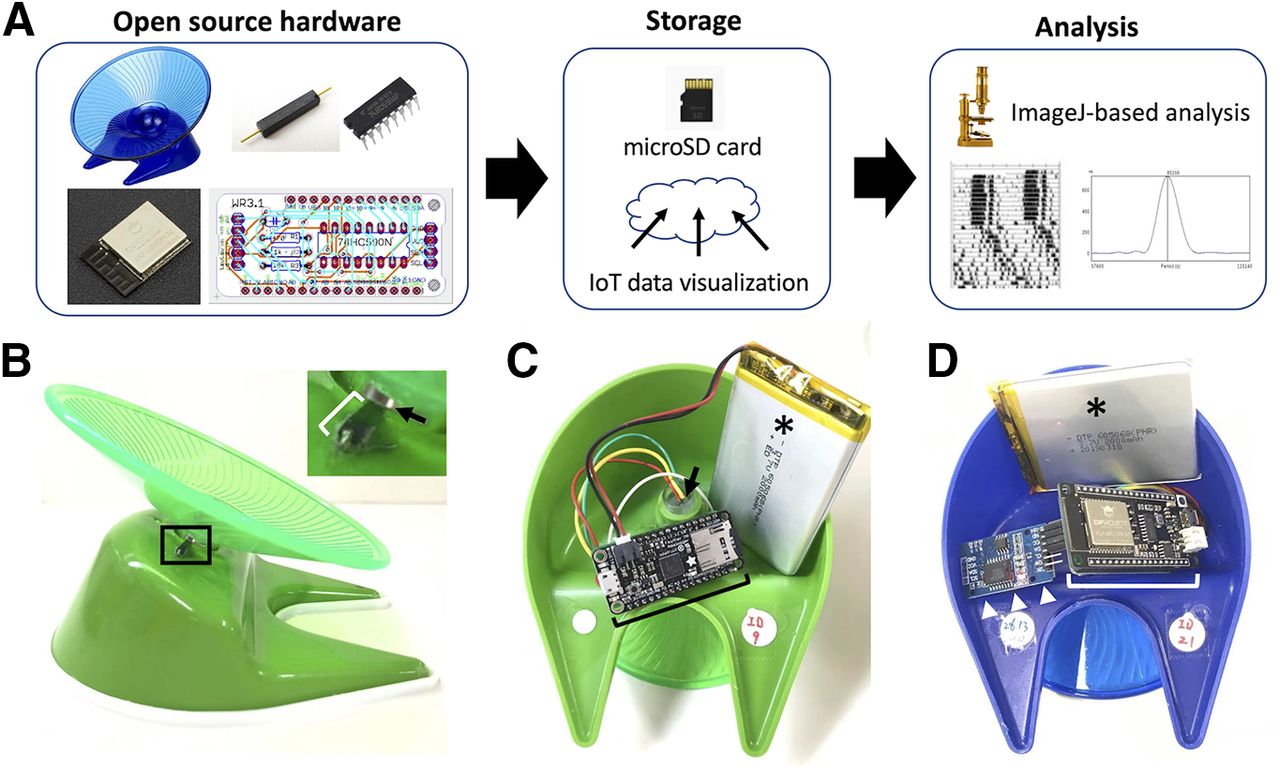
Overview of the WRAQ system. A, Schematic showing the WRAQ system workflow. The WRAQ system acquires data using a low-profile running wheel detecting the number of revolutions and light intensity in the cage using a magnet-reed switch and photodiode sensor, respectively (left). Data are stored either to a microSD card or an online server via WiFi connection (middle). Analyses with actogram and periodogram are conducted offline using a software-based on ImageJ (right). B–D, Side (B) or bottom views (C, D) of the WRAQ (B, C) and WRAQ-WiFi (D) showing the reed switch (bracket in B) on the main body detecting the sweep by a magnet attached to the bottom of the rotating wheel (arrow in B) and microcontrollers (brackets). The WRAQ and WRAQ-WiFi microcontrollers, i.e., Adalogger (bracket in C) and FireBeetle ESP32 (bracket in D), are connected to a lithium polymer battery (asterisks). Note that the photoresistor is encased in a silicon tube and placed at the center of the main body (arrow in C). Inset shows a magnified view of a boxed area in B. White arrowheads, real-time clock module.
- Figure 2.
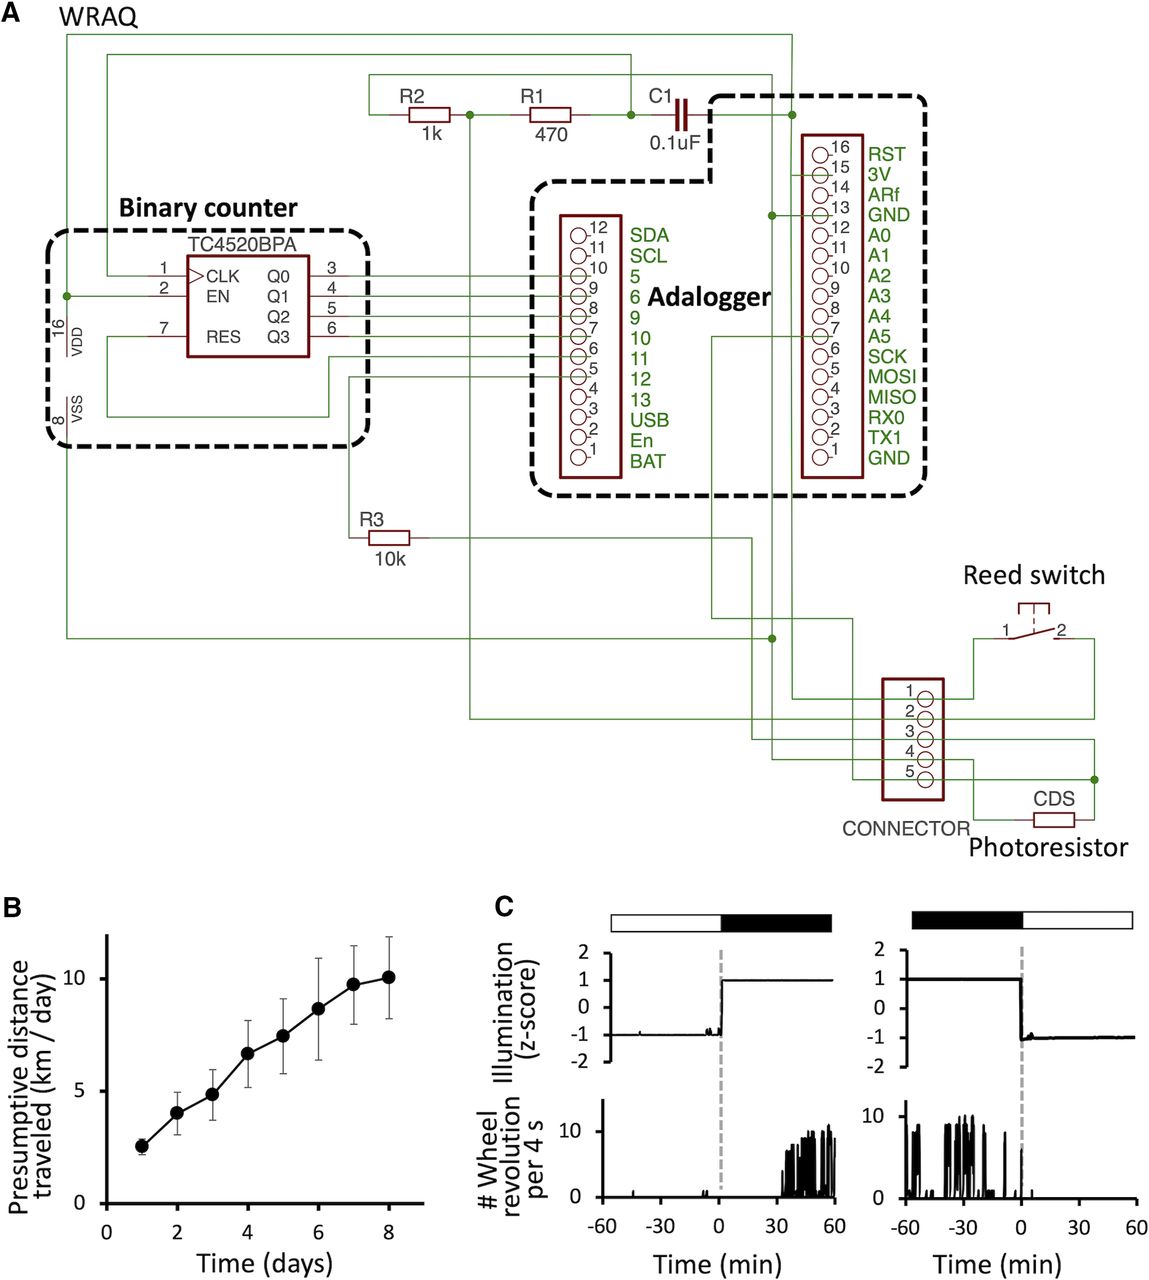
Simultaneous acquisition of the wheel revolution number and illumination data under light-dark light entrainment. A, A schematic showing the hardware part of the WRAQ system primarily consists of a microcontroller for recording and system management (Adalogger) and a 4-bit binary counter which counts the number of wheel revolutions when the Adalogger is in deep sleep mode. B, Line plot of the daily wheel-running activity during habituation to the WRAQ system. Values are represented as mean ± SEM. C, Temporal changes of the normalized illumination (voltage across the photoresistor, upper traces) and the number of wheel revolutions per 4 s (bottom trances) are shown across the transitions between light and dark period (dashed gray lines). A, analog input; C, capacitor; CDS, cadmium sulfide photoresistor; CLK, clock input; EN, enabled; GND, ground; R, resistor; RES, reset; VDD, voltage drain; VSS, voltage source.
- Figure 3.
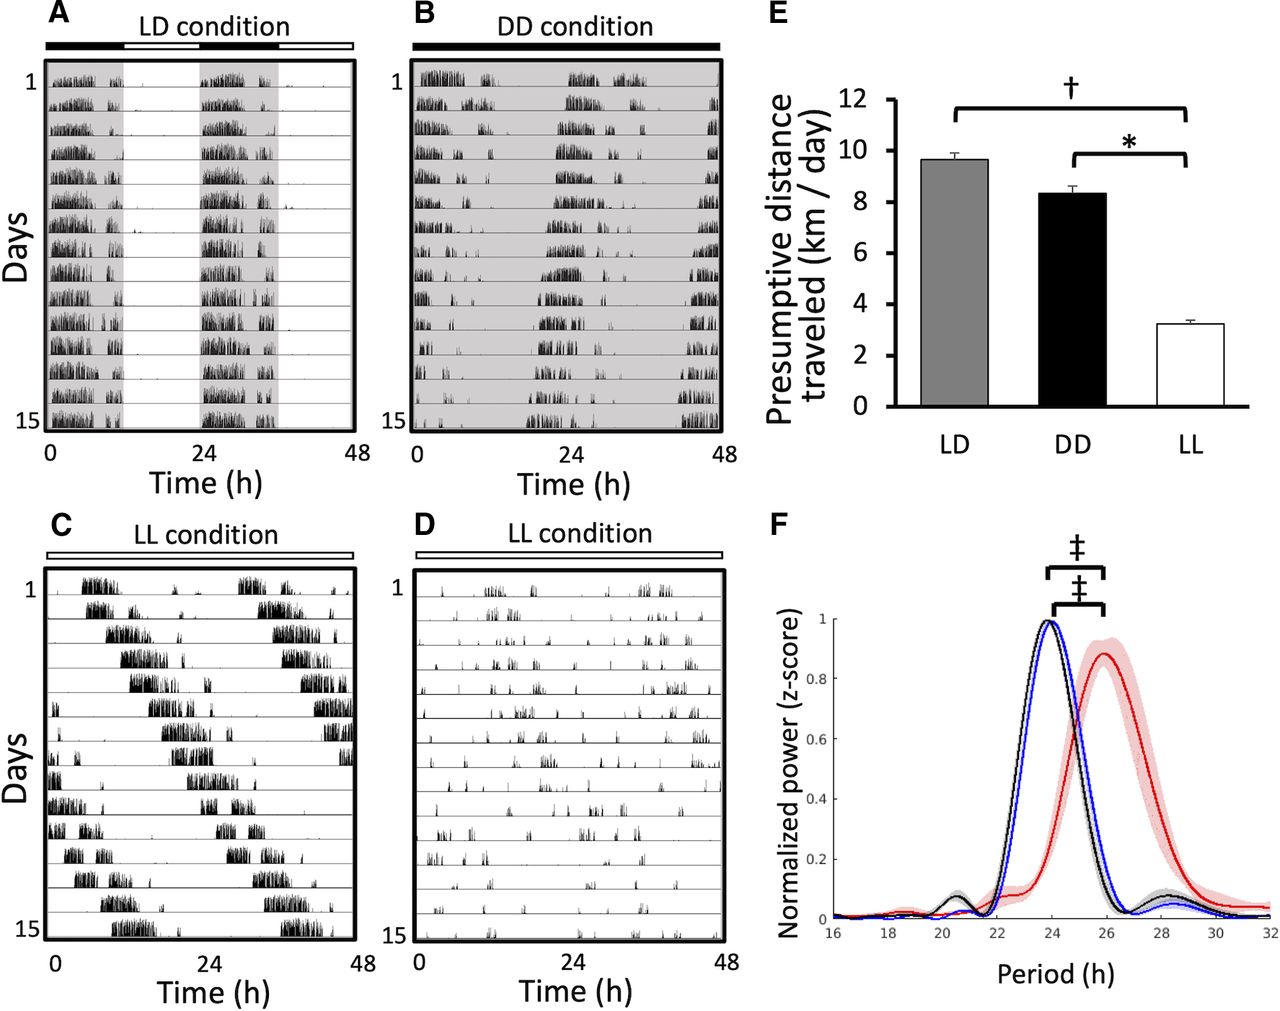
Wheel-running activity acquired by the WRAQ system under different entrainment schedules. A–D, Actograms of mouse wheel-running activity under LD (A), DD (B), and LL (C, D) conditions. E, Bar graph of the presumptive distance traveled on the wheel for mice kept under LD (gray), DD (black), and LL (white) entrainment. F, Line plots of the periodograms analyzing wheel-running activity recorded for 8 d under LD (blue, n = 10), DD (gray, n = 10), and LL (red, n = 7) based on the Lomb–Scargle method. Data are presented as mean (solid lines) ± SEM (error bars and shading). Contrasts are statistically significant differences of mean values between groups (repeated-measures ANOVA followed by Tukey’s post hoc test); *p < 0.05, †p < 0.01, ‡p < 0.001.
- Figure 4.
Transient suppression and recovery of wheel-running activity in a murine endotoxemia model. A, B, Line plots of daily wheel-running activity presented as the presumptive distance traveled (A) and relative body weight change from baseline (B) in mice with (filled circles with dashed lines) or without (triangles with solid lines) LPS treatment. Values are presented as mean ± SEM. Arrows indicate the timing of LPS injection. C, Scatter plot of body weight change and presumptive distance traveled showing a positive correlation with statistical significance (Pearson’s correlation coefficient = 0.745, p < 0.001). Contrasts are statistically significant differences between groups based on a repeated measure two-way ANOVA followed by Tukey’s post hoc test; *p < 0.05, †p < 0.01, ‡p < 0.001.
- Figure 5.
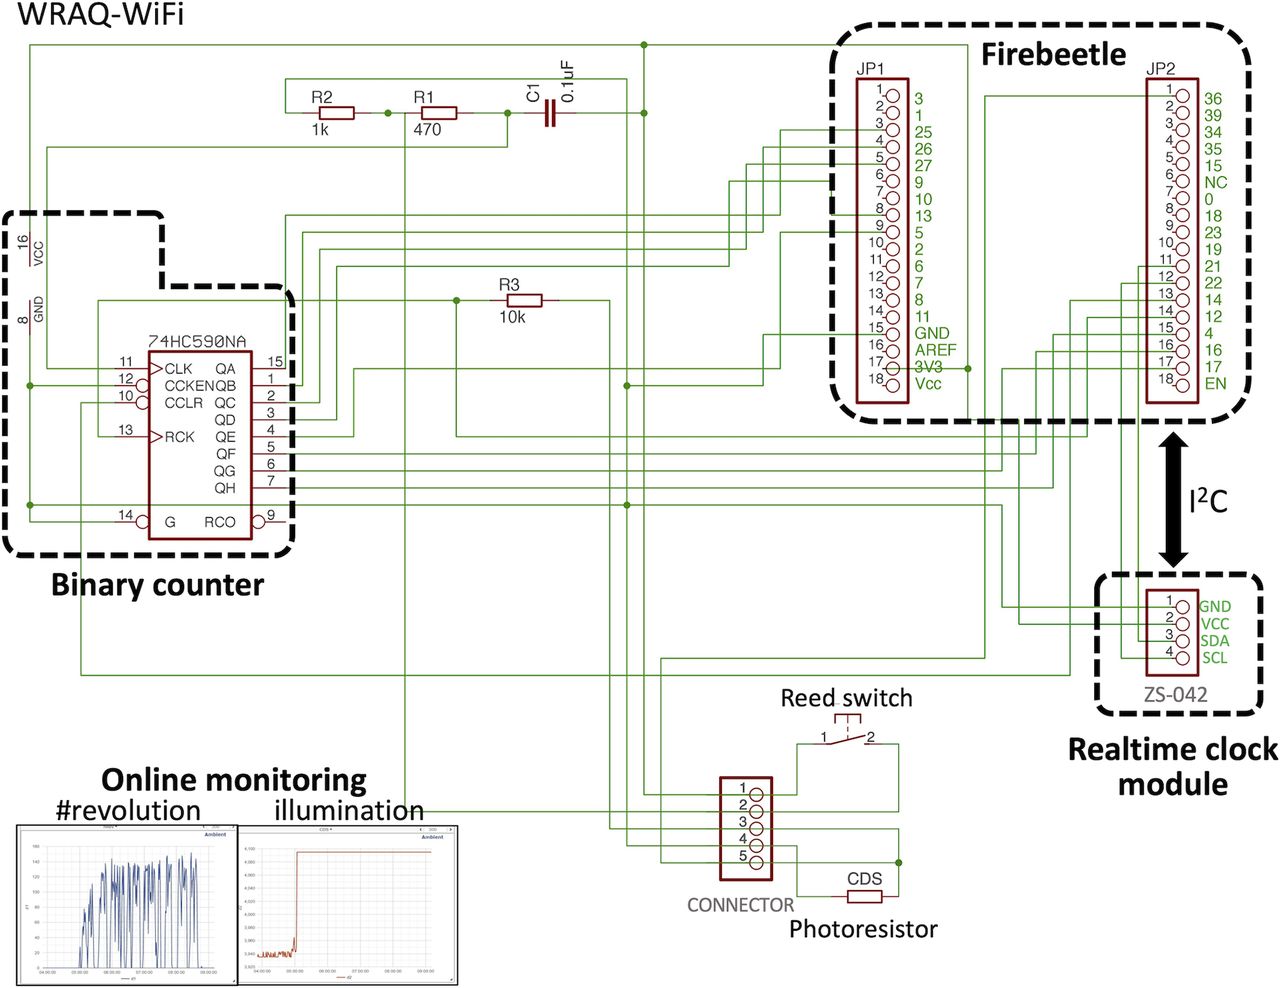
Wiring diagram for the WRAQ-WiFi. WRAQ-WiFi is based on ESP32 microcontroller implemented on a FireBeetle ESP32 board. The number of running wheel revolutions is measured by 8-bit counter 74HC590NA and transmitted to the cloud server and the timestamp (using real-time clock module) and illumination data in the home cage (based on change of photoresistor). Uploaded data are visualized on the online platform for real-time monitoring (panels at the lower-left corner). C, capacitor; CCLR; counter clear; CCKEN, counter clock enabled; CDS, cadmium sulfide photoresistor; CLK, clock input; G, ground; GND, ground; QA-QH, digital outputs from the binary counter; R, resistor; RCK, register clock; RES, reset; SDA, serial data line for I2C; SCL, serial clock line for I2C; VCC, voltage common collector.
- Figure 6.
Temporarily specific neural activation patterns under the guidance of WRAQ-WiFi. A, An actogram of mice receiving an injection of AAV8-Syn-hM3D-mCherry (A) or AAV8-CAG-GFP (B) to the SCN-SPZ under constant dark condition. On day 7, CNO was injected intraperitoneally at CT14, estimated based on the WRAQ-WiFi data available online (red asterisks in A, B). C, D, Coronal brain sections of the mouse used for behavioral analysis (A, B) showing the localization of mCherry (red in C), GFP (pseudocolored red in D), and c-Fos (green in C, D) in the SCN-SPZ. Independent of the behavioral recording in A, B, the mice brains were fixed 2 h after the CNO injection. Sections were counterstained with DAPI (blue in C, D). An inset is a magnified view of the boxed area in C. White arrowheads indicate the cells co-expressing mCherry (red) and c-Fos. Scale bar in C (applies to D): 200 μm.


Extended Data
Extended Data 1
Files used in the study. Download Extended Data 1, ZIP file.
In this issue


