

Article Figures & Data
Figures
- Figure 1.
Execution of RapID and customization of quantification parameters. A, Overview of the RapID pipeline, which includes selection of fluorescence (fluor.) type, setting detection parameters, delineating a region of interest, and automated export of counts as .csv files. B, All parameters can be set via an easy-to-use GUI. C, Parameters including σ [sigma maximum (max) and minimum (min) for cell body size], overlap allowance between cell bodies, fluorescence intensity, and fluorescence type allow the user to customize detection within images. For each parameter (except fluorescence), the same image was processed with varying settings with differences in selected cells highlighted with white arrows. D, A qualitative assessment of time (in min) to quantify with RapID (green) is on average 10% of the time compared with the manual Fiji Cell Counter (red) method. Parameters and image specifications used for all experiments included in this study are shown in Extended Data Figure 1-1.
- Figure 2.
Assessment of neuronal migration in wild-type mice using RapID and Fiji Cell Counter. For wild-type embryos (n = 7) subject to IUE with an EGFP expression construct on E14 and imaged on E18, represented images (A) depicting the original and processed image with RapID including grid placement delineating assigned rows 1–8. B, Plotted are quantification of counts (mean as percentages within the total delineated region) using Fiji Cell Counter (n = 3 users) and RapID (n = 3 users) across all wild-type mice. Error bars represent standard error of the mean (SEM) across the seven biological replicates. C, Two users (#2 and #3) performed quantifications of the same images for both Fiji Cell Counter and RapID with each dot representing images from the same mouse. The correlation of users #2 (blue) and #3 (orange) between methods, respectively, was performed using a regression analysis. Comparisons of the distribution of neuron counts obtained via RapID versus Cell Counter paired by mouse, image, and user grouped by assigned rows are shown in Extended Data Figure 2-1. Regression analysis across users for each method as well as confidence intervals of interrater and intrarater reliability tests of the variance components from the mixed effects models comparing RapID and Cell Counter are shown in Extended Data Figures 2-2, 2-3. Random effects of the linear mixed models were also evaluated in Extended Data Figure 2-4.
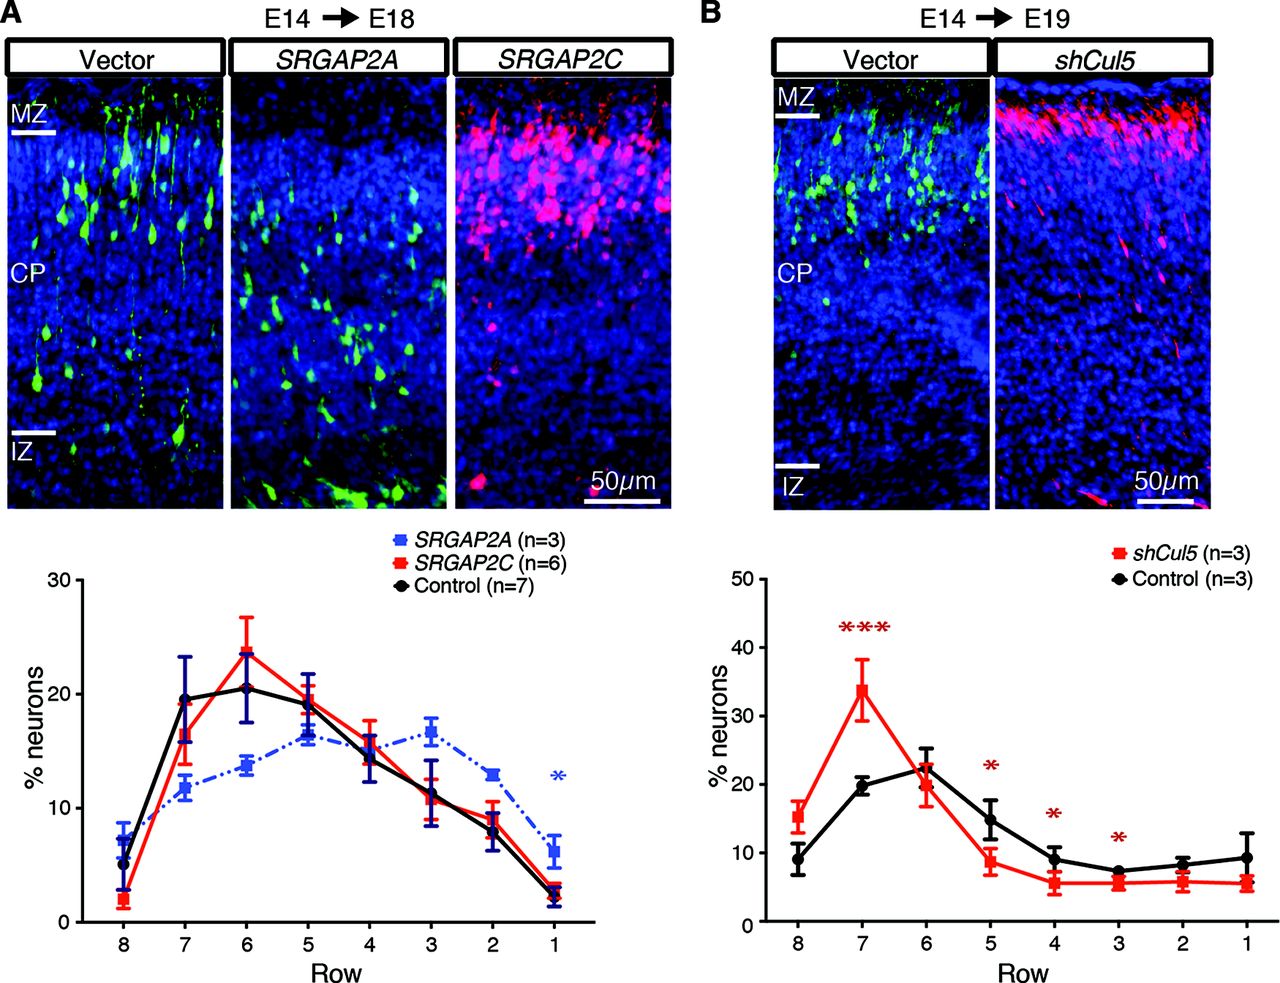
- Figure 3.
RapID quantification of neuronal migration in developing mouse cortices to characterize SRGAP2 and shCul5. Depicted are images of cortical slices for mice subjected to IUE with only the fluorescence-expression vector (“control”) and (A) human-specific duplicated SRGAP2A (co-IUE with EGFP; see also Extended Data Fig. 3-1), or SRGAP2C (co-IUE with ChFP) or (B) short-hairpin (sh)RNA targeted to Cul5 for knock-down from a previously published study (Simó et al., 2010). Depicted on the control images are the positions of cortical layers, including IZ, CP, and MZ. Plots are quantification of counts (mean as percentages within the total delineated region) using RapID with error bars representing SEM across biological replicates. Significant differences in neuronal migration per layer were determined using a Mann–Whitney test; *p < 0.05; ***p < 0.001. An example of RapID grid placement and quantification for SRGAP2 are shown in Extended Data Figure 3-1. Details of summary data and statistical analyses are presented in Extended Data Figures 3-2, 3-3.
- Figure 4.
Quantification of cell density across Rbx2cKO-Nestin cortices via RapID. A, Images of P0 cortical slices from control (Rbx2 floxed/floxed) and cKO Rbx2 mutant (Rbx2 floxed/floxed; Nestin-Cre/+) and stained via IHC for Ctip2 and Cux1 for Layer V and Layer II/III PNs, respectively. B, Percentage of neurons across cortical layers spanning from IZ to MZ between control and Rbx2 mutant mouse, with increased dispersal of Ctip2-stained PNs across multiple assigned rows. Plots are quantification of counts (mean as percentages within the total delineated region) using RapID with error bars representing SEM across biological replicates. Significant differences in neuronal migration per layer were determined using a Mann–Whitney test; *p < 0.05.
- Figure 5.
RapID detection of more complex neuron morphologies and co-localization A, Detection of cortical neurons alongside astrocytes, testing RapID’s ability to detect neurons with bushy morphology alongside less complex neuron cell types. RapID settings: max σ: 14; min σ: 4; overlap: 0.5; threshold: 0.07. B, Dopaminergic neurons labeled with tyrosine hydroxylase, cytoplasmic staining contrasted with hitherto nuclear staining. RapID settings: max σ: 17; min σ: 8; overlap: 0.9; threshold: 0.05. C, Detection of GFP/ChFP+ cells, tissue stained with cortical markers Ctip2+ and Tbr1+. RapID settings: max σ:10; min σ: 2; overlap: 0.5; threshold: 0.1.


Extended Data
Extended Data 1
RapID executable files and code. The following files are included in the Extended Data, which can be found at https://github.com/sanchestm/RapID-cell-counter:
mainQT5.py: executable file to run Qt5 version of the RapID
bycells2v2.ui: auxiliary file for the GUI elements of the RapID
LICENSE: RapID GNU general public license v3
README.md: overview of files and installation guide
example_images: folder of immunofluorescence example images for GFP/RFP and OFP
experimental: folder of test versions of software for future updates
screenshots: images for README.md file
RapID_HowTo.pdf: screenshot of github installation guide (also see README.md)
Download Extended Data 1, ZIP file.
Extended Data Figure 1-1
Parameters and specifications for RapID detection of diverse neuron morphologies and fluorescence/co-localization (Extended Data Table). Parameters (max σ, min σ, overlap, and threshold) used for quantification of all image types analyzed for this article are listed (e.g., cortical neurons, astrocytes, dopaminergic neurons, etc.). Additionally, details on the developmental stage, cortical markers used for specification of neuron types as well as use of cytoplasmic or nuclear staining are listed to aid others to use RapID for their experiments and image specifications. Download Figure 1-1, XLS file.
Extended Data Figure 2-1
Comparison of neuron counts between RapID and Cell Counter. A, Histogram of percentage of neurons counted within cortical slices from wild-type mice (E18.5) by RapID and Cell Counter relative to assigned rows across the cortex. Median of each set of counts quantified by RapID (red) or Cell Counter (blue) denoted by dashed line. B, Marginal histogram comparing distribution of counts across RapID and Cell Counter. Counts are paired across mouse, image, and user and then grouped by assigned row across the cortex (e.g., counts of an image taken from a specific individual mouse as counted by the same user are compared across the different methods of quantification). Download Figure 2-1, TIF file.
Extended Data Figure 2-2
Summary data of neuronal counts in wild-type mice using manual method and RapID program (Extended Data Table). Statistics, including median, median deviation, SD, and SEM for all counts were grouped by image, mouse, and assigned row and analyzed. Interrater and intrarater reliability tests of the variance components of each of the mixed effect models were assessed across each of the assigned rows. Subsequently, the interrater and intrarater reliability for RapID and Cell Counter for each of the assigned rows were compared by calculating 95% confidence intervals (using delta method) and are plotted in Extended Data Figure 2-3C. Download Figure 2-2, XLS file.
Extended Data Figure 2-3
Correlation across users and methods for RapID and Cell Counter. Regression analysis of counts generated using either (A) RapID or (B) Fiji Cell Counter of IUE neurons (EGFP; E14.5) of cortical slices from wild-type mice imaged at E18.5 by three different users (RapID user #1 is independent to Cell Counter user #1). All counts were performed in a blinded fashion. Goodness-of-fit values for linear regression R2 values for RapID (0.49–0.66) and Cell Counter (0.55–0.63). C, Interrater reliability (correlation between counts obtained by two users on the same image) and intrarater reliability (correlation between counts obtained by the same user on two images from the same mouse) were obtained from the variance components of each of the mixed effect models (Extended Data Fig. 2-4); 95% confidence intervals were calculated using the delta method. Download Figure 2-3, TIF file.
Extended Data Figure 2-4
Random effects of the linear mixed models evaluated by maximum likelihood estimators, variance components, and ANOVA (Extended Data Table). Linear mixed models accounting for fixed and random effects (mouse, image, and user) inherent to the quantification process were tested in order to better determine true variability in count outcomes between the two methods, RapID and Cell Counter. Random effects of each model were evaluated by tests of maximum likelihood, SD of variance components, and ANOVA. Download Figure 2-4, XLS file.
Extended Data Figure 3-1
Example application of RapID to quantify neuronal abundances in developing mouse brain subject to IUE with SRGAP2A expression constructs. From left, a grid with a customizable number of subdivisions is placed onto the selected image, delineating different regions of the cortex. On the right, with σ and overlap parameters set to default and an adjusted threshold to detect lower fluorescence intensity, all green fluorescent cells are detected and quantified, with the counts, density, and DAPI-based nuclei count divided by each grid section as well as a total over the area of the grid itself. Download Figure 3-1, TIF file.
Extended Data Figure 3-2
Summary of neuronal migration and density counts using RapID (Extended Data Table). Means and SEM for all absolute counts and percentages of counts for each condition quantified using RapID, including SRGAP2, shCul5, and Rbx2cKO-Nes and corresponding controls. The period from IUE to dissection is indicated (e.g., E14–E18) as well as the numbers of individuals counted per condition (noted as n). Table results are plotted in Figures 2, 3. Download Figure 3-2, XLS file.
Extended Data Figure 3-3
Effects on neuronal migration in SRGAP2 and shCul5 samples quantified via RapID Cell Counter using Mann–Whitney test (Extended Data Table). The statistical significance of the effect on neuronal migration for each condition was determined by Mann–Whitney test (p value) of experimental condition versus control. Summary statistics are included of the median, difference of the medians between the two conditions, 96.67% confidence intervals as well as multiple testing correction (Bonferroni). These significant values (*p < 0.05) are plotted for SRGAP2 and shCul5 in Figure 2 and Rbx2cKO-Nes in Figure 3. Download Figure 3-3, XLS file.
In this issue


