

Article Figures & Data
Figures
- Figure 1.
Experimental setup and data. A, left, Representative scheme of the experimental design. Square-wave 1-Hz alternating gratings at different contrast levels were used for visual stimulation. A linear 16-channels probe (with 50-μm spacing between electrodes) was inserted into the mouse V1. Right, Mean across animals of current source densities (CSDs) aligned by the earliest current sink. B, left, Mean scalogram for contrast equal to 0 (K=0) within −200 to 900 ms around screen onset (for K = 0). The dashed rectangle depicts the frequency bands ranges: narrow band (NB, middle, black) and broad band (BB, gray). Right, Scalogram magnitude comparison between screen OFF (from −200 to 0 ms) and screen ON condition (from 0 to 900 ms) in high NB (top) and BB (bottom). Each dot represents one stimulus presentation for one mouse (n = 12 animals, 70 experimental points overall). Statistical differences were accounted for by the Wilcoxon’s matched pairs signed-rank test. For both γ bands, p values were far less than 0.001. C, Examples of filtered local field potential (LFP) recorded in mice V1 while viewing a uniform gray screen (top), or alternating gratings at contrast K = 30 (middle) and K = 90 (bottom). The examples are reported between [−0.5; 1] s around screen onset. Examples were filtered between (1) 10–100 Hz (black traces) just for representative purposes; (2) 45–65 Hz to display the NB; (3) from 20 to 45 Hz and from 65 to 90 Hz to display the BB range. Dashed lines indicate screen onset (black) and the first contrast reversal (gray). Monitors’ sketches schematically represent visual contrast. D, LFP modulation of minimal contrast (i.e., K = 0; top) and maximal contrast (i.e., K = 90; bottom) with respect to the power spectral density (PSD) at K = 30 (middle). Modulation is defined as the difference between the power of a frequency at a given contrast level (K = 0 or K = 90 in this case) with the power at reference contrast K = 30, normalized to the latter power. Shaded regions indicate standard error of the mean (SEM).
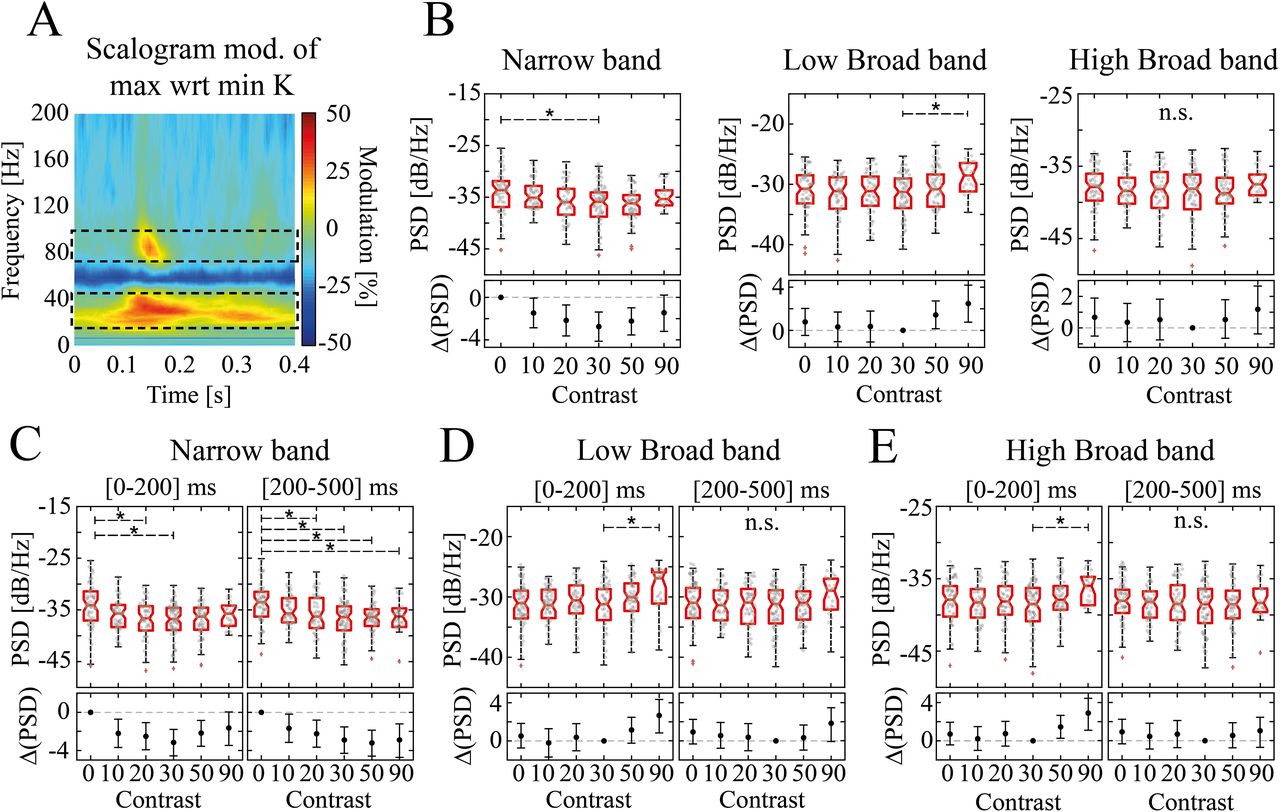
- Figure 2.
Narrow and broad band γ contrast-driven modulation in Layer IV of mouse V1. A, K = 90 versus K = 0 modulation of LFP scalogram, pooled across all animals (n = 12 for all K < 90 and n = 7 for K = 90) and averaged across trials (in this case meaning both contrast reversals and recordings). Dashed black rectangles indicate the broad band (BB) composed of two ranges: low BB ([45–65] Hz) and high BB ([65–90] Hz). These two bands are separated by the narrow band (NB, [45–65] Hz). B, PSD of NB (left), low BB (middle), high BB (right) as a function of visual contrast pooled across all animals and recordings over the whole [0–500] ms stimulation interval. On upper boxes, the horizontal red line indicates the median, bottom and top edge indicate the 25th and 75th percentiles. The whiskers extend to the most extreme data points not considered outliers (which are represented by red pluses). Asterisks indicate significant post hoc pairwise difference (K–W followed by Dunn’s test p < 0.05). n.s. indicates nonsignificant statistical difference across contrasts. Individual experimental data points are indicated as gray circles. Lower boxes display the mean difference in PSD, ΔPSD, between a reference contrast (K = 0 for NB and K = 30 for the BB) and the other contrast levels. Black whiskers indicate the 95% confidence interval obtained through nonparametric bias-corrected bootstrap resampling (Ho et al., 2019). C–E, Same as B for narrow band (C), low broad band (D), and high broad band (E) dividing the response interval in two windows: [0–200] ms (left) and [200–500] ms (right).
- Figure 3.
Information theory analysis reveal complementary encoding of visual contrast ranges. A, Information carried by PSD modulation with respect to K = 30 of narrow band about all contrast levels (all K), low range of contrasts (K < 30), and high range of contrasts (K > 30). PSD modulation was considered for the whole inter-contrast-reversal interval ([0–500] ms). Asterisks indicate mutual information values exceeding the significance threshold (p < 0.05; bootstrap test). B, Same as A but considering only 200 ms following contrast reversal. C, Same as A but considering the time window [200–500] ms following contrast reversal. D–F, Same as A–C for broad band. G, Joint mutual information carried by both narrow and broad band PSD modulation during the whole inter-contrast-reversal interval ([0–500] ms) about all contrast levels (all K), low range of contrasts (K < 30), and high range of contrasts (K > 30). H, Same as G but considering only 200 ms following contrast reversal. I, Same as G but considering a time window [200–500] ms following contrast reversal.
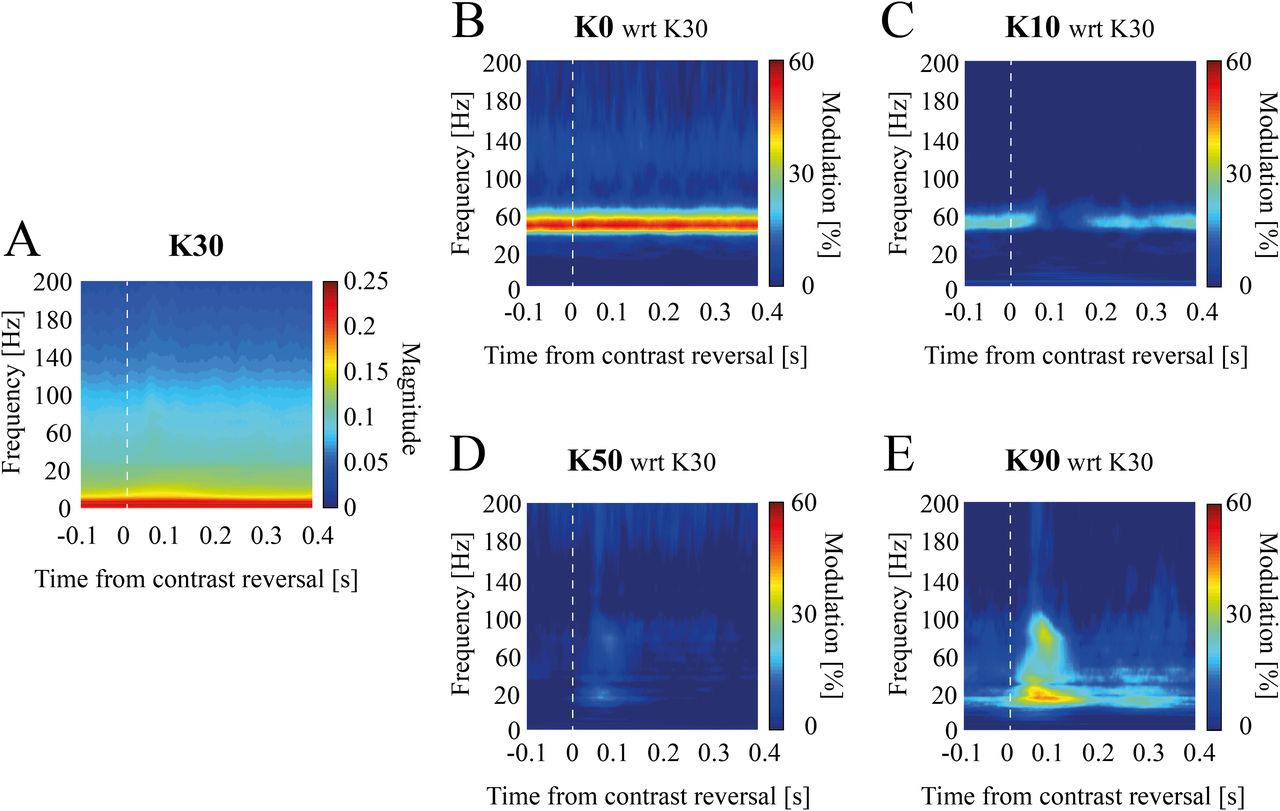
- Figure 4.
Temporal evolution of contrast-dependent spectral modulation in experimental data. Mean scalogram modulation with respect to K = 30 (A) for experimental data at K = 0 (B), K = 10 (C), K = 50 (D), and K = 90 (E). Scalograms were averaged [−100–400] ms around contrast reversal instants (see Materials and Methods).
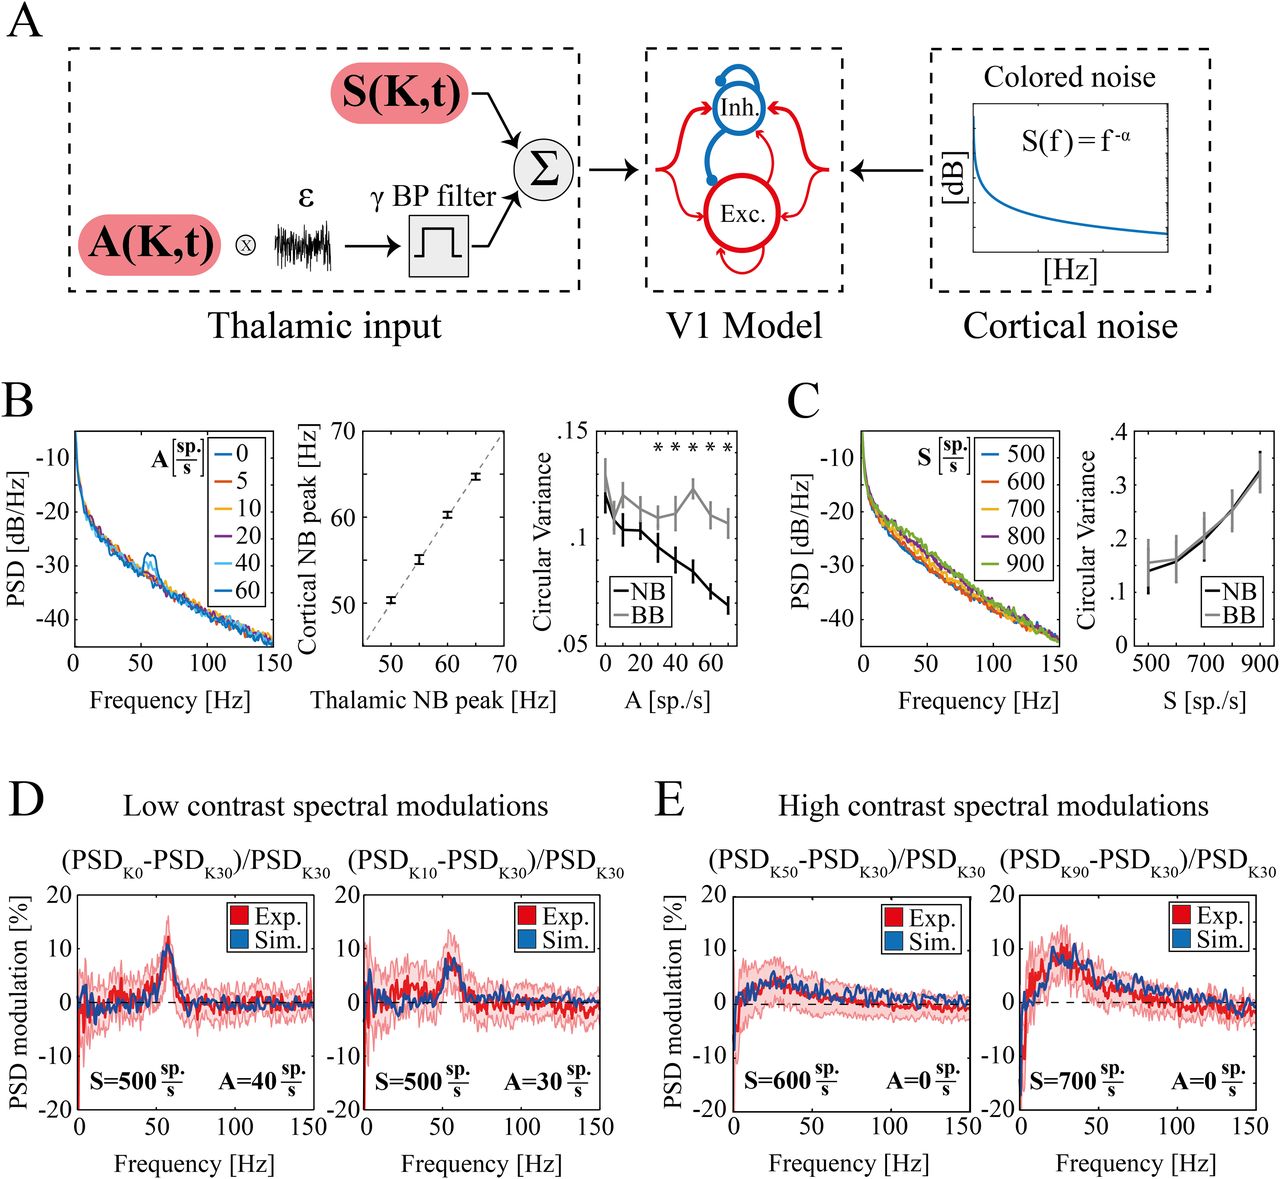
- Figure 5.
Experimental and simulated spectral modulation at different visual contrasts. A, Schematic representation of the primary visual cortex (V1) model network. From left to right, (1) Thalamic inputs; sustained component S(K,t) (top) and periodic component of amplitude A(K,t) (bottom); (2) sparse LIF network of excitatory (n = 4000, red) and inhibitory neurons (n = 1000, blue). The size of the arrows represents schematically the strength of single synapses. In addition to recurrent interactions, both populations receive external excitatory inputs; (3) colored noise (see Materials and Methods) modeling ongoing unstructured cortical inputs. B, left, power spectral density (PSD) of simulated LFPs as a function of the amplitude of periodic thalamic input A (legend in the inset indicate A values). Middle, Cortical NB frequency peak as a function of the corresponding frequency peak of the thalamic NB. Dashed gray line indicates the identity line. Right, Circular variance of the phase difference between the simulated LFP and the thalamic input within the NB (black line) and within the BB (gray line) as a function of the amplitude of periodic thalamic input A. Asterisks indicate levels of input for which NB circular variance is significantly less than BB (p = 0.002). C, left, PSD of simulated LFPs for increasing levels of the sustained component of the thalamic input S (legend in the inset indicate S values). Right, Circular variance as a function of the amplitude of the sustained thalamic input S for the phase difference between the simulated LFP and the thalamic input within the NB (black line) and the BB (gray line). Circular variance was significantly modulated by the sustained component of the thalamic input S both within the NB (K–W test p ≪ 0.001) and the BB (K–W test p ≪ 0.001). Circular variance was likewise modulated within these two bands [two-way ANOVA: p = 0.99 for the interaction between the value of sustained thalamic input (S) and the frequency band (NB or BB)]. D, Modulation of LFP PSD for K = 0 (left) and K = 10 (right) with respect to K = 30 in experimental (red) and simulated (blue) data. The red shaded area represents SEM of experimental data across animals and recordings. In both simulations, sustained thalamic input was set to S = 500 sp./s, while the periodic input was set to A = 40 sp./s for K = 0 (left) and A = 30 sp./s for K = 10 (right). E, Modulation of LFP PSD for K = 50 (left) and K = 90 (right) with respect to K = 30 in experimental (red) and simulated (blue) data. The red shaded area represents SEM of experimental data across animals and recordings. In both simulations, periodic thalamic input was set to A = 0 sp./s, while the sustained input was S = 600 sp./s for K = 50 (left) and S = 700 sp./s for K = 90 (right).
- Figure 6.
Simulation of NB and BB γ over the whole contrast range. A, B, Optimal amplitude of periodic (A) and sustained (B) thalamic input amplitude for each value of contrast K (blue markers) and corresponding fit (dashed orange line). C, PSD30 modulation (see Materials and Methods) of NB (top) and BB (bottom) with fixed sustained input S = 500 sp./s and individual A(K) values shown in (A; blue line) and overall fit (orange line). Error bars indicate mean ± SEM here and in the following panels. D, PSD30 modulation (see Materials and Methods) of NB (top) and BB (bottom) with sustained input S(K) values shown in B (blue line) or associated fit (orange line) and no periodic input. E, Comparison of PSD30 modulation in NB (top) and BB (bottom) for experiments (red) and simulations with A(K) and S(K) values determined by local optimization (blue) or associated fit (orange).
- Figure 7.
Temporal evolution of contrast-dependent modulation in simulated data. A, left, Time course of thalamic input model parameters for K = 0. Middle, Scalogram mean modulation at K = 0 with respect to K = 30 for simulated data. Right, Time evolution of narrow band modulation for experimental (red) and simulated (blue) data (shading reflects SEM). B, Same as A for K = 10. C, left, Time course of thalamic input model parameters for K = 50. Middle, Scalogram mean modulation at K = 50 with respect to K = 30 for simulated data. Right, Time evolution of broad band modulation for experimental (red) and simulated (blue) data (shading reflects SEM). D, Same as C for K = 90.


Tables
GABA on
inhibitoryGABA on
excitatoryAMPArecurrent on
inhibitoryAMPArecurrent on
excitatoryAMPAexternal on
inhibitoryAMPAexternal on
excitatorygsyn (nS) 2.700 2.010 0.233 0.178 0.317 0.234 τl (ms) 1 1 2 2 2 2 τr (ms) 1 1 0.2 0.4 0.2 0.4 τd (ms) 5 5 1.25 2.25 1.25 2.25 K = 0 K = 10 K = 20 K = 30 K = 50 K = 90 A(K) (sp./s) 40 30 20 0 0 0 S(K) (sp./s) 500 500 500 500 600 700 A0(K) (sp./s) 40 30 20 0 0 0 α(K) (sp./s) 0 30 20 0 0 0 S0(K) (sp./s) 500 500 500 500 500 600 β(K) (sp./s) 0 0 0 0 250 200
Extended Data 1
Python code for running the simulations. The simulations employ the Brian2 simulation environment. Download Extended Data 1, TXT file.
In this issue


