
Main menu

  • HOME
  • CONTENT
    • Early Release
    • Featured
    • Current Issue
    • Issue Archive
    • Blog
    • Collections
    • Podcast
  • TOPICS
    • Cognition and Behavior
    • Development
    • Disorders of the Nervous System
    • History, Teaching and Public Awareness
    • Integrative Systems
    • Neuronal Excitability
    • Novel Tools and Methods
    • Sensory and Motor Systems
  • ALERTS
  • FOR AUTHORS
  • ABOUT
    • Overview
    • Editorial Board
    • For the Media
    • Privacy Policy
    • Contact Us
    • Feedback
  • SUBMIT

User menu

Search

  • Advanced search
eNeuro
eNeuro

Advanced Search


  • HOME
  • CONTENT
    • Early Release
    • Featured
    • Current Issue
    • Issue Archive
    • Blog
    • Collections
    • Podcast
  • TOPICS
    • Cognition and Behavior
    • Development
    • Disorders of the Nervous System
    • History, Teaching and Public Awareness
    • Integrative Systems
    • Neuronal Excitability
    • Novel Tools and Methods
    • Sensory and Motor Systems
  • ALERTS
  • FOR AUTHORS
  • ABOUT
    • Overview
    • Editorial Board
    • For the Media
    • Privacy Policy
    • Contact Us
    • Feedback
  • SUBMIT
PreviousNext
Research ArticleResearch Article: Confirmation, History, Teaching, and Public Awareness

Perceptual Fading of a Stabilized Cortical Image: Replication in the Undergraduate Classroom

Nicole B. Massa, Jacob H. Deck and Michael A. Grubb
eNeuro 16 September 2021, 8 (5) ENEURO.0323-21.2021; https://doi.org/10.1523/ENEURO.0323-21.2021
Nicole B. Massa
Department of Psychology and Neuroscience Program, Trinity College, Hartford, CT 06106
  • Find this author on Google Scholar
  • Find this author on PubMed
  • Search for this author on this site
Jacob H. Deck
Department of Psychology and Neuroscience Program, Trinity College, Hartford, CT 06106
  • Find this author on Google Scholar
  • Find this author on PubMed
  • Search for this author on this site
Michael A. Grubb
Department of Psychology and Neuroscience Program, Trinity College, Hartford, CT 06106
  • Find this author on Google Scholar
  • Find this author on PubMed
  • Search for this author on this site
  • Article
  • Figures & Data
  • Info & Metrics
  • eLetters
  • PDF
Loading

Article Figures & Data

Figures

  • Tables
  • Extended Data
  • Figure 1.
    • Download figure
    • Open in new tab
    • Download powerpoint
    Figure 1.

    Blakemore et al. (1971) replication procedure. The adaptation condition began with 180 s of adaptation. Between each trial was a pause of 10 s, during which a high contrast grating was presented at the upper location in the adaptation condition; no such grating was shown between trials in the control condition. The contrast of the upper grating was randomly determined on each trial; 20 contrast matches were made for each contrast level within each condition. ISI, inter-stimulus interval.

  • Figure 2.
    • Download figure
    • Open in new tab
    • Download powerpoint
    Figure 2.

    Active learning exercise procedure. The adaptation condition began with 180 s of adaptation. Between each trial was a pause of 10 s, during which a high contrast grating was presented at the upper location in the adaptation condition; no such grating was shown between trials in the control condition. The contrast of the upper grating was randomly determined on each trial; 10 contrast matches were made for each contrast level within each condition. ISI, inter-stimulus interval.

  • Figure 3.
    • Download figure
    • Open in new tab
    • Download powerpoint
    Figure 3.

    Sliding scale. A visual representation of the change to the sliding scale (top numbers, contrast levels; bottom numbers, position values). At a random position value, the logarithmic scale was cut. The contrast of 0.1, which corresponded to the cut position value became the beginning of the sliding scale. All contrasts before this cut were added to the end of the scale.

  • Figure 4.
    • Download figure
    • Open in new tab
    • Download powerpoint
    Figure 4.

    Blakemore et al. (1971) replication results. Perceived contrast as a function of physical contrast. Each point represents the average of 20 matches (open triangles, control condition; red triangles, adaptation condition). Error bars, standard error of the mean.
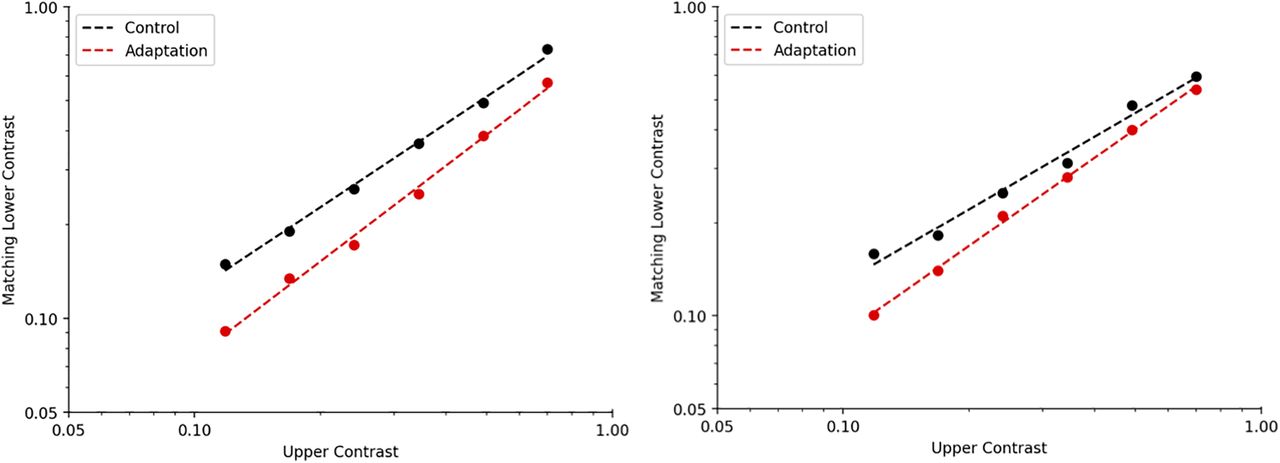
  • Figure 5.
    • Download figure
    • Open in new tab
    • Download powerpoint
    Figure 5.

    Active learning exercise results. Perceived contrast as a function of physical contrast for two example observers. Each point represents the average of ten matches (black dots, control condition; red dots, adaptation condition).
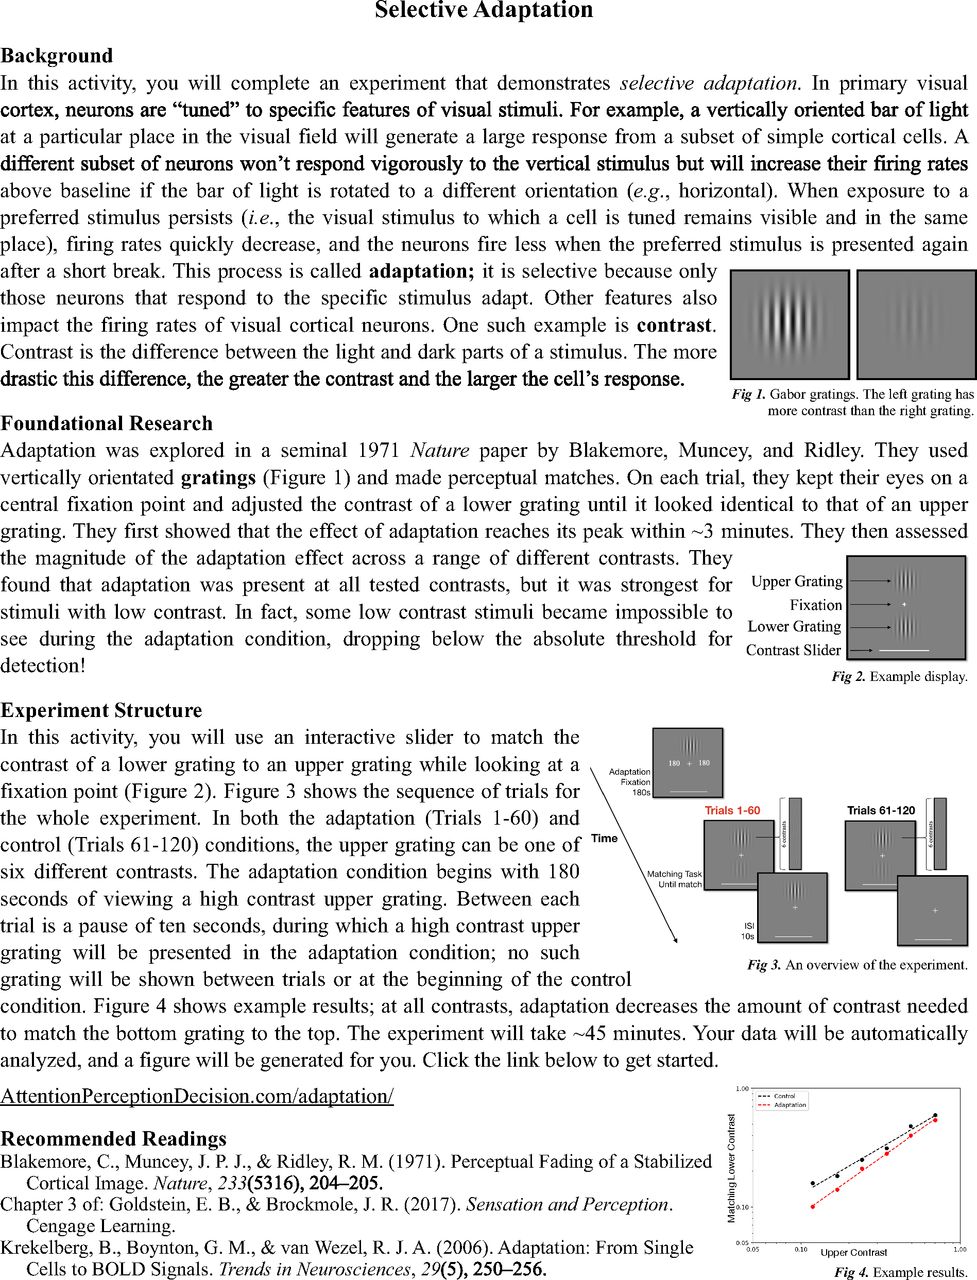
  • Figure 6.
    • Download figure
    • Open in new tab
    • Download powerpoint
    Figure 6.

    Active learning exercise handout. Experiment code and download instructions available as Extended Data 1.

Tables

  • Figures
  • Extended Data
    • View popup
    Table 1

    Statistical summary

    Data structureType of testPower
    Normal distributionLinear mixed effects model95% CIs
    • View popup
    Table 2

    Simple linear models

    Model
    information
    Number of
    observations
    Error degrees
    of freedom
    Root mean
    squared error
    R2Adjusted
    R2
    F statistic vs
    constant model
    p value
    Control condition22200.08530.9940.9943.61E + 034.52E-24
    Adaptation condition12100.1370.9780.9764451.27E-09
    Estimated coefficientsEstimateSE95% CIt statisticsp value
    Control condition
     Intercept−0.078420.039006[−0.1598, 0.0029]−2.01050.05806
     log(upperContrast)0.971740.016167[0.9380, 1.0055]60.1064.5188E-24
    Adaptation condition
     Intercept−0.0398060.090256[−0.2409, 0.1613]−0.441040.66857
     log(upperContrast)1.37460.065132[1.2295, 1.5197]21.1051.2679E-09
    • Full results. Data and analysis code are available as Extended Data 1. SE, standard error; CI, confidence interval; DF, degrees of freedom.

    • View popup
    Table 3

    Contrast match data

    Upper contrastObserver 1 contrast matchesObserver 2 contrast matches
    Control
    condition
    Adaptation
    condition
    Control
    condition
    Adaptation
    condition
    0.02000.0248(0.0046)0.0198(0.0064)
    0.02850.0316(0.0081)0.0249(0.0074)
    0.04070.0438(0.0137)0.0382(0.0124)
    0.05810.0618(0.0136)0.0610(0.0174)
    0.08290.0839(0.0230)0.0707(0.0238)
    0.11830.1105(0.0198)0.0622(0.0264)0.1061(0.0249)0.0585(0.0324)
    0.16880.1614(0.0422)0.0775(0.0314)0.1734(0.0512)0.0641(0.0245)
    0.24090.2251(0.0536)0.1457(0.0461)0.2510(0.0399)0.1247(0.044)
    0.34380.3088(0.0438)0.2013(0.0718)0.3186(0.0438)0.2059(0.0531)
    0.49060.4746(0.0535)0.3906(0.1204)0.4467(0.0563)0.3563(0.0579)
    0.70000.7282(0.0601)0.6866(0.0798)0.6638(0.1069)0.5698(0.1082)
    • Each observer’s mean (SD in parentheses) of 20 matches for each upper contrast in the control and adaptation conditions.

    • View popup
    Table 4

    Linear mixed effects model

    Model
    information
    Number of
    observations
    Fixed effects
    coefficients
    Random effects
    coefficients
    Covariance
    parameters
    680422
    Model fit statisticsAICBICLogLikelihoodDeviance
    250.85277.98−119.42238.85
    EffectEstimateSE95% CIt statisticsDFp value
    Fixed effects
     Intercept−0.0840.042[−0.167, −0.002]−2.00196760.045699
     Condition (0 = control, 1 = adaptation)0.0520.052[−0.049, 0.153]1.00366760.31595
     log(upperContrast)0.9820.012[0.958, 1.006]80.5236760
     Condition:log(upperContrast)0.4430.033[0.378, 0.507]13.4536761.0013E-36
    Random effects
    ID0.0424[0.013955, 0.12908]
    Error0.2875[0.27262, 0.30324]
    • Full results. Data and analysis code are available as Extended Data 1.

Extended Data

  • Figures
  • Tables
  • Extended Data 1

    Replication analysis code and data. Download Extended Data 1, ZIP file.

  • Extended Data 2

    Active learning exercise code and instructions. Download Extended Data 2, ZIP file.

Back to top

In this issue

eneuro: 8 (5)
eNeuro
Vol. 8, Issue 5
September/October 2021
  • Table of Contents
  • Index by author
  • Ed Board (PDF)
Email

Thank you for sharing this eNeuro article.

NOTE: We request your email address only to inform the recipient that it was you who recommended this article, and that it is not junk mail. We do not retain these email addresses.

Enter multiple addresses on separate lines or separate them with commas.
Perceptual Fading of a Stabilized Cortical Image: Replication in the Undergraduate Classroom
(Your Name) has forwarded a page to you from eNeuro
(Your Name) thought you would be interested in this article in eNeuro.
CAPTCHA
This question is for testing whether or not you are a human visitor and to prevent automated spam submissions.
Print
View Full Page PDF
Citation Tools
Perceptual Fading of a Stabilized Cortical Image: Replication in the Undergraduate Classroom
Nicole B. Massa, Jacob H. Deck, Michael A. Grubb
eNeuro 16 September 2021, 8 (5) ENEURO.0323-21.2021; DOI: 10.1523/ENEURO.0323-21.2021

Citation Manager Formats

  • BibTeX
  • Bookends
  • EasyBib
  • EndNote (tagged)
  • EndNote 8 (xml)
  • Medlars
  • Mendeley
  • Papers
  • RefWorks Tagged
  • Ref Manager
  • RIS
  • Zotero
Respond to this article
Share
Perceptual Fading of a Stabilized Cortical Image: Replication in the Undergraduate Classroom
Nicole B. Massa, Jacob H. Deck, Michael A. Grubb
eNeuro 16 September 2021, 8 (5) ENEURO.0323-21.2021; DOI: 10.1523/ENEURO.0323-21.2021
Twitter logo Facebook logo Mendeley logo
  • Tweet Widget
  • Facebook Like
  • Google Plus One

Jump to section

  • Article
    • Abstract
    • Significance Statement
    • Introduction
    • Materials and Methods
    • Results
    • Discussion
    • Acknowledgments
    • Footnotes
    • References
    • Synthesis
  • Figures & Data
  • Info & Metrics
  • eLetters
  • PDF

Keywords

  • active learning
  • adaptation
  • contrast
  • undergraduate teaching

Responses to this article

Respond to this article

Jump to comment:

No eLetters have been published for this article.

Related Articles

Cited By...

More in this TOC Section

Research Article: Confirmation

  • Evidence That Dmrta2 Acts through Repression of Pax6 in Cortical Patterning and Identification of a Mutation Impairing DNA Recognition Associated with Microcephaly in Human
  • Nucleus Accumbens Dopamine Encodes the Trace Period during Appetitive Pavlovian Conditioning
  • Dissociating Frontal Lobe Lesion Induced Deficits in Rule Value Learning Using Reinforcement Learning Models and a WCST Analog
Show more Research Article: Confirmation

History, Teaching, and Public Awareness

  • Incorporating Quantitative Literacy into a T32 Retreat: Lessons and Considerations from Experience
  • Illuminating the Shadows of Neuroscience: How Curiosity and Courage Redefine Research Models and Mentorship
  • My 50 Year Odyssey to Develop Behavioral Methods to Let Me See Quickly How Well Kittens See
Show more History, Teaching, and Public Awareness

Subjects

  • History, Teaching, and Public Awareness
  • Home
  • Alerts
  • Follow SFN on BlueSky
  • Visit Society for Neuroscience on Facebook
  • Follow Society for Neuroscience on Twitter
  • Follow Society for Neuroscience on LinkedIn
  • Visit Society for Neuroscience on Youtube
  • Follow our RSS feeds

Content

  • Early Release
  • Current Issue
  • Latest Articles
  • Issue Archive
  • Blog
  • Browse by Topic

Information

  • For Authors
  • For the Media

About

  • About the Journal
  • Editorial Board
  • Privacy Notice
  • Contact
  • Feedback
(eNeuro logo)
(SfN logo)

Copyright © 2025 by the Society for Neuroscience.
eNeuro eISSN: 2373-2822

The ideas and opinions expressed in eNeuro do not necessarily reflect those of SfN or the eNeuro Editorial Board. Publication of an advertisement or other product mention in eNeuro should not be construed as an endorsement of the manufacturer’s claims. SfN does not assume any responsibility for any injury and/or damage to persons or property arising from or related to any use of any material contained in eNeuro.