

Article Figures & Data
Figures
- Figure 1.
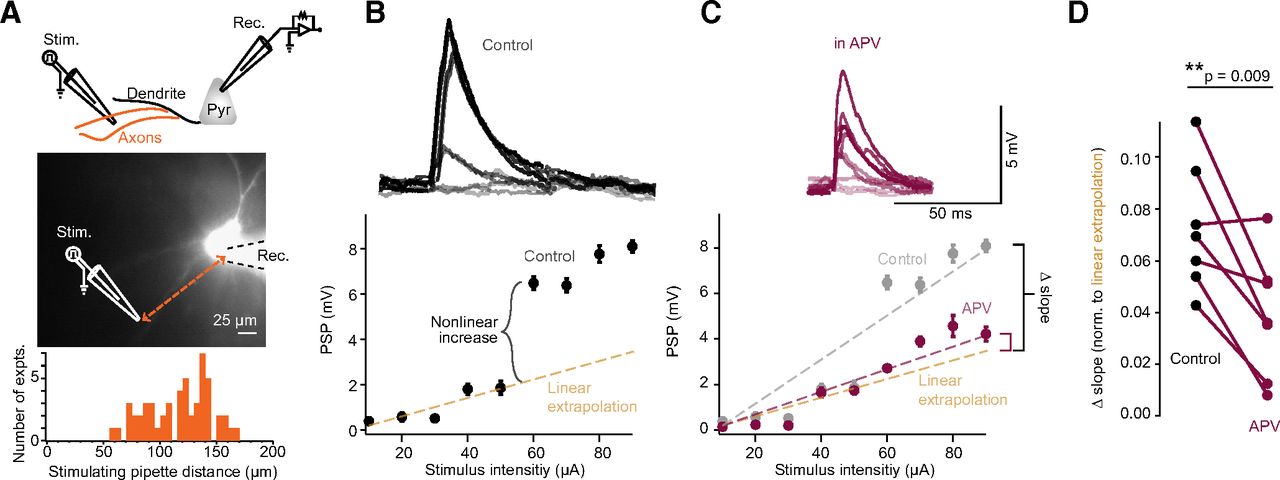
Electrical stimulation of afferent axons in layer 2/3 resulted in NMDAR-dependent dendritic supralinearities. A, Top, Diagram of recording configuration. Middle, Example infrared image of layer 2/3 pyramidal cell filled with fluorescent Alexa Fluor 594 dye. Recording patch pipette is outlined for illustrative purposes. Approximate location of theta glass stimulating pipette, which was placed within layer 2/3, is also indicated. Bottom, Distribution of distance between stimulating pipette and the recorded cell soma. B, Example I–O curve showing suprathreshold excitatory response to linearly increasing stimulus pulses (100 μs duration). Dashed line indicates linear extrapolation of mean PSP values before responses become supralinear. Inset, example voltage trace responses. Error bars indicate the mean ± SEM. The order in which different stimulus intensities were presented did not affect PSP magnitudes (Extended Data Fig. 1-1). One cell exhibited a sublinear response curve (Extended Data Fig. 1-2). A minority of cells exhibited a linear response (Extended Data Fig. 1-3), while a few other cells responded with multiple instances of nonlinear increases in their PSPs (Extended Data Fig. 1-4). C, Same as in B in the presence of 100 μm APV. Color-coded dashed lines indicate a linear fit of the entire I–O function. D, Change in slope (in millivolts per microampere) for the entire I–O function in control aCSF (n = 8) and in the presence of APV (n = 8). The application of APV also significantly shortened the duration of PSPs (Extended Data Fig. 1-5). **p ≤ 0.01.
- Figure 2.
ChR2-expressing SST and PV neurons responded reliably to light activation. A, Top left, Diagram indicating the recording configuration for a tdTom-expressing and ChR2-expressing SST neuron. Immunohistochemistry confirmed that the majority of tdTom+/ChR2+ cells were SST+ (Extended Data Fig. 2-1). Right, Example cell response to a 500-ms-long current step of +175 pA showing the accommodation expected for SST neurons. B, Spike raster of the response of the same cell to increasing steps of depolarizing current, again showing accommodation. C, Response of the cell to a 100-ms-long light pulse of 450 nm light. D, Spike raster for the response of a cell to the light pulse. E, Peristimulus time histogram over trials. F, Same as A for a tdTom-expressing and ChR2-expressing PV neuron. As expected for PV neurons, the spike response does not accommodate (in contrast to SST neurons). G, Spike raster of the response of the same cell to increasing steps of depolarizing current. H, Response of a cell to a 100-ms-long light pulse of 450 nm light. I, Spike raster for the response of a cell to the light pulse. J, Peristimulus time histogram over trials. Blocking inhibition with PTX resulted in an increase of spike response to light in SST cells but not in PV cells (Extended Data Fig. 2-2).
- Figure 3.
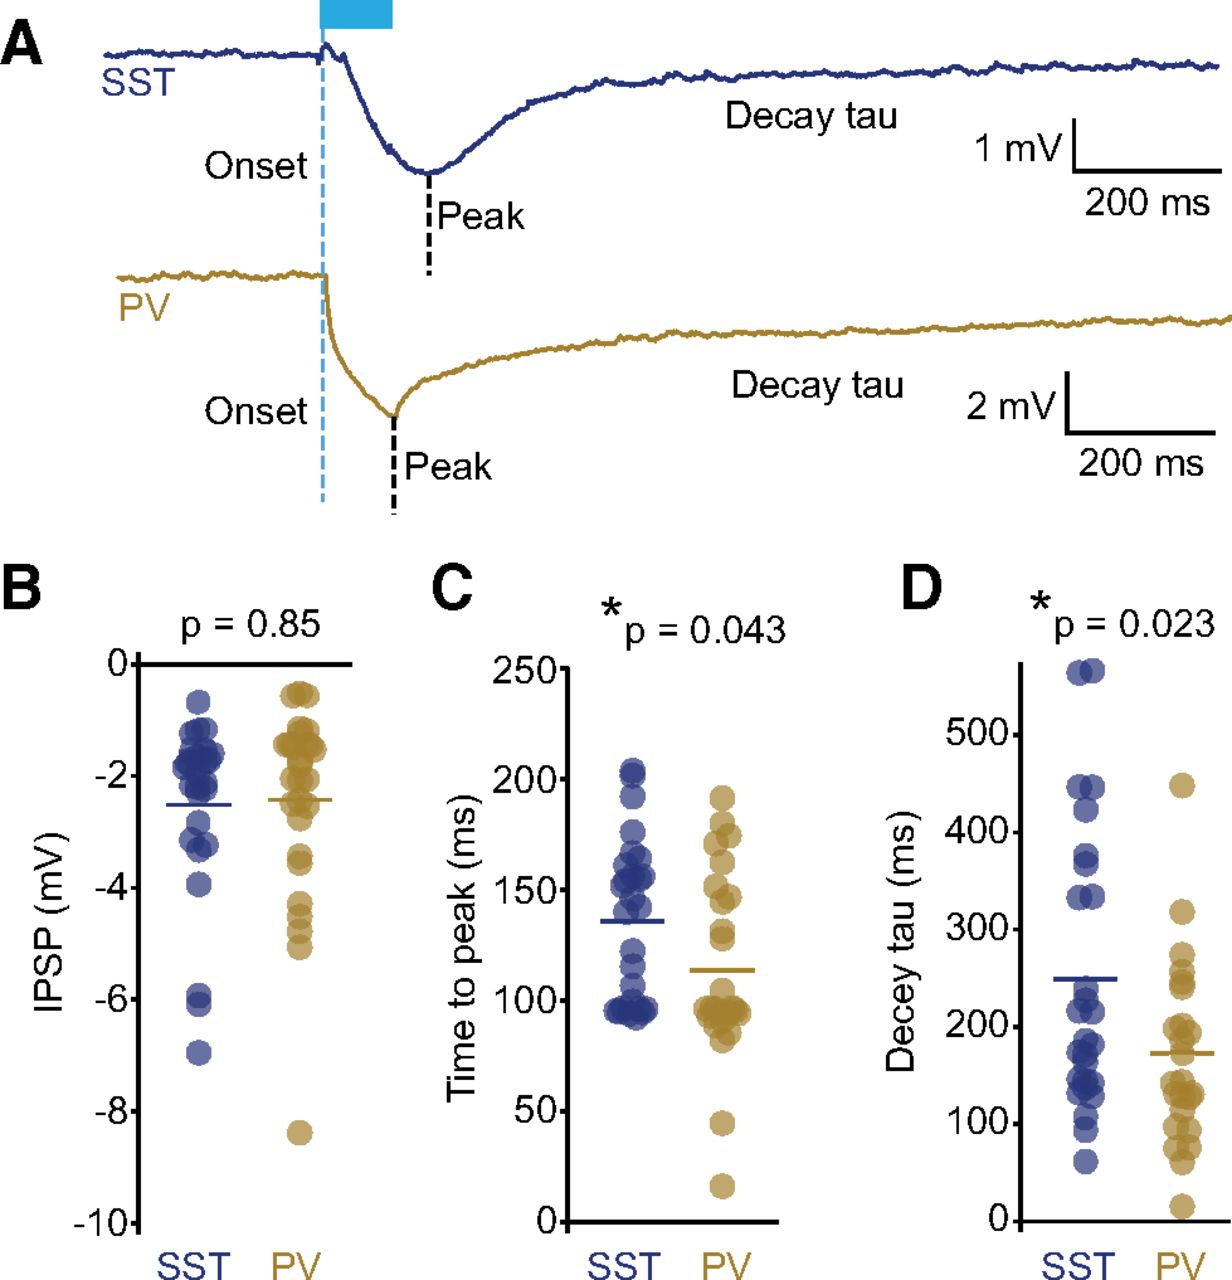
Similar IPSPs were recorded in pyramidal neurons when ChR2-expressing SST or PV neurons were activated with a light pulse. A, Example traces of IPSP responses in recorded pyramidal cells following optogenetic activation of either SST (blue; n = 27) or PV (gold; n = 28) cells. B, IPSP peak magnitudes were similar in both experiments. C, D, SST cell-mediated evoked IPSPs (C) peaked later and decayed with longer time constants than PV cell-mediated evoked IPSPs (D). **p ≤ 0.05.
- Figure 4.
SST cell activation reduced the magnitude of nonlinear responses. A, Left, Diagram depicting recording and optogenetic activation of SST cells. Right, Example pyramidal cell response to electrical stimulation (hash marks) and 100 ms optogenetic stimulation of SST cells (light blue). B, Same as in A, with the activation of PV cells in gold. C, Top, Example PSP response to electrical stimulation alone (black) or in combination with the optogenetic activation of SST cells (blue). Bottom, Example I–O curve during control stimulation (black) and optogenetic activation of SST cells (blue). Dashed line indicates linear extrapolation of PSP amplitudes based on the first four SIs. Error bars indicate the mean ± SEM. The Δ PSP indicated is the supralinear jump in PSP size in the I–O curve. D, Comparison of PSP jump under control conditions (black) and during optogenetic activation of SST cells (blue; n = 27). E, Same as in D with PV cell activation in gold (n = 28). The I–O curve was linearized by optogenetic activation of interneurons in a minority subset of cells (6 of 27 SST cells; 2 of 28 PV cells; Extended Data Fig. 4-1). ***p ≤ 0.001.
- Figure 5.
SST cells predominantly mediated divisive gain control, while PV cell activation resulted in subtractive inhibition. A, Left, Example I–O, fitted with a sigmoidal curve, in the absence (black) or presence (blue) of optogenetic activation of SST cells. Dashed line indicates linear extrapolation from first four data points. Error bars indicate the mean ± SEM. Middle, Comparison of the slope of sigmoidal fit during the control and optogenetic activation of SST cells. A logarithmic plot of the same data is shown in the inset. Right, Comparison of the x-half (offset) of sigmoidal fit during control and optogenetic activation of SST cells (n = 27). B, Same as in A, with the activation of PV cells in gold (n = 28). *p ≤ 0.05, ***p ≤ 0.001.


Extended Data
Figure 1-1
Order of stimulus intensity presentation did not influence PSP magnitude. A, Diagram of recording configuration. B, Example PSP response to linearly increasing (black) or decreasing (green) stimulus intensities. Inset, sample voltage traces. Download Figure 1-1, EPS file.
Figure 1-2
Quantification of a pyramidal cell that exhibited a sublinear response to electrical stimulation. A, Top, Cartoon schematic of recording configuration. Bottom, Example infrared image of layer 2/3 pyramidal cell filled with fluorescent Alexa Fluor 594 dye. B, I–O plot showing the sublinear response to linearly increasing current stimulations in control aCSF (black) or aCSF containing 100 μm APV (purple). Download Figure 1-2, EPS file.
Figure 1-3
A minority of cells did not exhibit a nonlinear response to stimulation. A, Example linear I–O plot to increasing levels of electrical stimulation in the absence (black) or presence (blue) of optogenetic activation of SST cells. Inset, Sample voltage traces at maximal stimulus intensity. Dashed line (purple) indicates linear extrapolation. Error bars indicate the mean ± SEM. B, Same as in A, with PV cell activation in gold. Download Figure 1-3, EPS file.
Figure 1-4
A minority of cells exhibited multiple instances of nonlinear increases in response to stimulation. A, Top, Diagram depicting recording and optogenetic activation of an SST cell. Bottom, Example I–O curve with increasing electrical stimulation in the absence (black) or presence (blue) of optogenetic activation of SST cells (blue). B, Same as A, with the activation of PV cells in gold. Download Figure 1-4, EPS file.
Figure 1-5
NMDA receptor blockade with APV affected PSP kinetics. A, Top, Example voltage traces. Bottom, Comparison of the FWHM of induced PSP at maximal stimulus intensities in control aCSF (black) or aCSF containing 100 μm APV (purple). B, Same as in A with the comparison of the decay constant tau in control (black) and APV-containing (purple) aCSF (n = 8). Download Figure 1-5, EPS file.
Figure 2-1
The majority of tdTom+/ChR2+ cells were SST+. A, Left, Representative image of coronal section of mouse visual cortex stained for somatostatin. Middle left, Enlarged section of leftmost image showing cells positive for somatostatin expression. Middle right, Same region, showing cells positive for tdTomato expression. Right, Merged image. B, Quantification of cell expression, mean ± SEM (six sections, two mice). Download Figure 2-1, EPS file.
Figure 2-2
Spike responses in SST cells were increased by blocking inhibition using PTX. A, Diagram indicating recording configuration and PTX blocking of inhibition. B, Top, Example responses of SST cell to 10 Hz trains of 450 nm light pulses (20 ms pulse width) in control aCSF (black) and aCSF containing 50 μm PTX (blue). Bottom, Comparison of spike probability to all pulses in a 10 Hz train of light in control aCSF and PTX (n = 14). C, Same as B showing SST cell response to 20 Hz trains of 450 nm light pulses (n = 13). D, Same as A with recording/activation of PV cells in gold. E, Same as B with recording/activation of PV cells in gold (n = 10). F, Same as in E, showing PV cell response to 20 Hz trains of 450 nm light pulses in gold (n = 10). Download Figure 2-2, EPS file.
Figure 4-1
A minority of cells exhibited nonlinear increases during control stimulation that were linearized during optogenetic stimulation. A, Top, Diagram depicting the recording and optogenetic activation of SST cells. Bottom, Example input–output trace during control stimulations (black) or stimulations during optogenetic activation of SST cells (blue). Dashed line (purple) indicates linear extrapolation. B, Same as A with activation of PV cells in gold. Download Figure 4-1, EPS file.
In this issue


