

Article Figures & Data
Figures
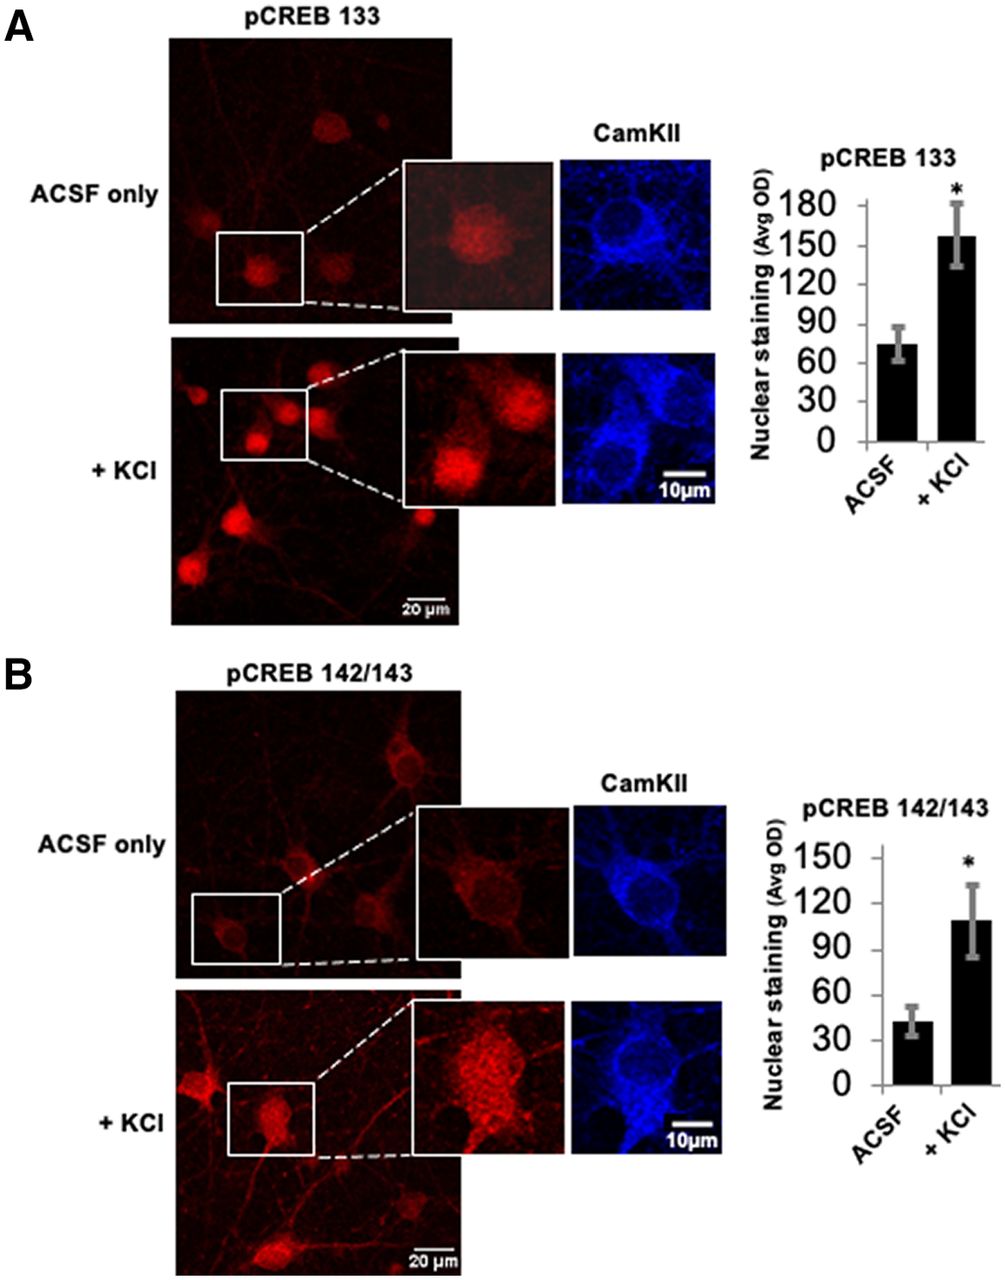
- Figure 1.
Phosphorylation of CREB at Ser133 and Ser142/143 is activity dependent. A, Cells exposed to either regular ACSF or KCl-rich ACSF for 20 min show an increase in staining intensity of pCREB 133 (red). The inset shows a higher-magnification image where nuclear staining of pCREB133 is increased after depolarization with KCl. CaMKII staining (blue) is not in the nucleus under either stimulus condition. The histogram on the right displays the average optical density (Avg OD), quantifying the change in nuclear intensity of pCREB133 (n = 3 experiments, 12 coverslips, 137 cells for the ACSF group and 3 experiments, 13 coverslips, 141 cells for the +KCl group; *p < 0.0001, independent t test). B, Cells stained for pCREB 142/143 (red) also show KCl-induced increase in nuclear staining, whereas CaMKII (blue) in the same cells does not. The inset shows a higher-magnification image and the corresponding histogram represents pCREB142/143 nuclear staining (n = 3 experiments, 15 coverslips, 176 cells for the ACSF group and 3 experiments, 9 coverslips, 87 cells for the +KCl group; *p < 0.0001, independent t test). All error bars indicate standard error of the mean (SEM).
- Figure 2.
Viral constructs and functional validation. A, Diagrams of HSV constructs used in this study, as described in Materials and Methods. The different domains of the CREB protein are shown in blue, with the dominant negative mutation indicated. The fluorescent tag (GFP) is in the green box. The yellow arrows are the promoters for each gene (IE 4/5 for CREB, and CMV for GFP). B, Western blots showing that phosphorylation at Ser133 is not affected by S142A/S143A mutations. Left, pCREB133 is significantly reduced in tissue from CREBdn-S133A-injected mice versus mice injected with the control virus (p = 0.02, independent t test). Right, pCREB133 levels do not change in tissue from CREBdn-S142A/S143A-injected mice versus mice injected with the control virus (n.s. = not significant, p = 0.49, independent t test). The data in the gray box were previously published in J Neurosci (Pulimood et al., 2017). All error bars indicate standard error of the mean (SEM).
- Figure 3.
Activity-dependent Arc expression is blocked in the absence of CREB phosphorylation at Ser133 as well as at Ser142/143. A, Stimulus and virus infection conditions are as follows (from left): ACSF control media in cells infected with HSV-GFP control virus (n = 105 cells on 12 coverslips from 3 independent experiments), KCl-rich ACSF to depolarize cells infected with HSV-GFP control virus (n = 128 cells on 15 coverslips from 3 independent experiments), KCl-rich ACSF in cells infected with CREBdn-S133A (n = 51 cells on 20 coverslips from 3 independent experiments), and KCl-rich ACSF in cells infected with CREBdn-S142A/S143A (n = 63 cells on 15 coverslips from 3 independent experiments). Top panels show Arc staining in red and bottom panels show HSV infection in green. B, A cumulative distribution plot showing all analyzed cells in each condition clearly displays the activity-dependent increase in Arc expression that is blocked by the CREBdn viruses [one-way ANOVA, F(3,333) = 53.1, p < 0.0001; Tukey’s post hoc test GFP(+KCl) vs all other groups p < 0.0001]. C, Representative case of Arc expression in mice injected with CREBdn-S142A/S143A or control GFP. Cyclophilin B (CyB) was used as a loading control. D, Quantification shows a significant reduction in Arc expression after blocked phosphorylation of CREB at Ser142/143 (t = 2.32, *p = 0.04; df = 8, t test for unequal variances). All error bars indicate standard error of the mean (SEM). OD = optical density.
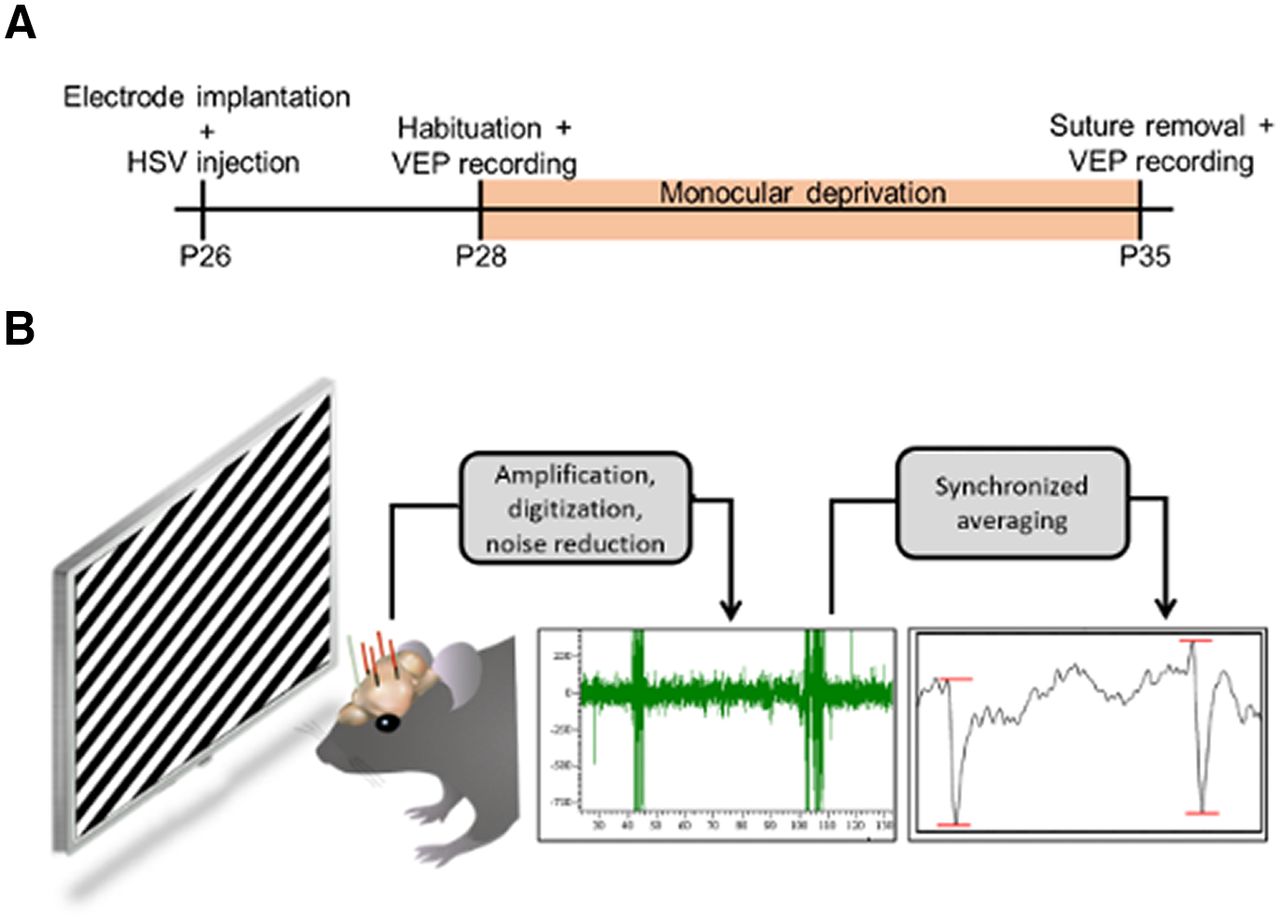
- Figure 4.
VEP recordings: schematics of the experimental timeline and spike analysis. A, Electrode implantation and virus injection were done together at P26. After recovery from surgery, habituation followed by a pre-MD baseline recording was performed. The animal was then monocularly deprived by eyelid suture for a 7-d period, after which the deprived eye was reopened and a post-MD recording was conducted. VEP = visually evoked potential; HSV = herpes simplex virus; P = post-natal day. B, As the implanted mouse views the visual stimulus, electrical signals are transmitted through an amplifier, noise eliminator, and digitizer, and are recorded as the EEG signal shown in green. The amplitude of the VEP response (after synchronized averaging) is measured in microvolts (μV) from peak to trough as marked by the red lines.
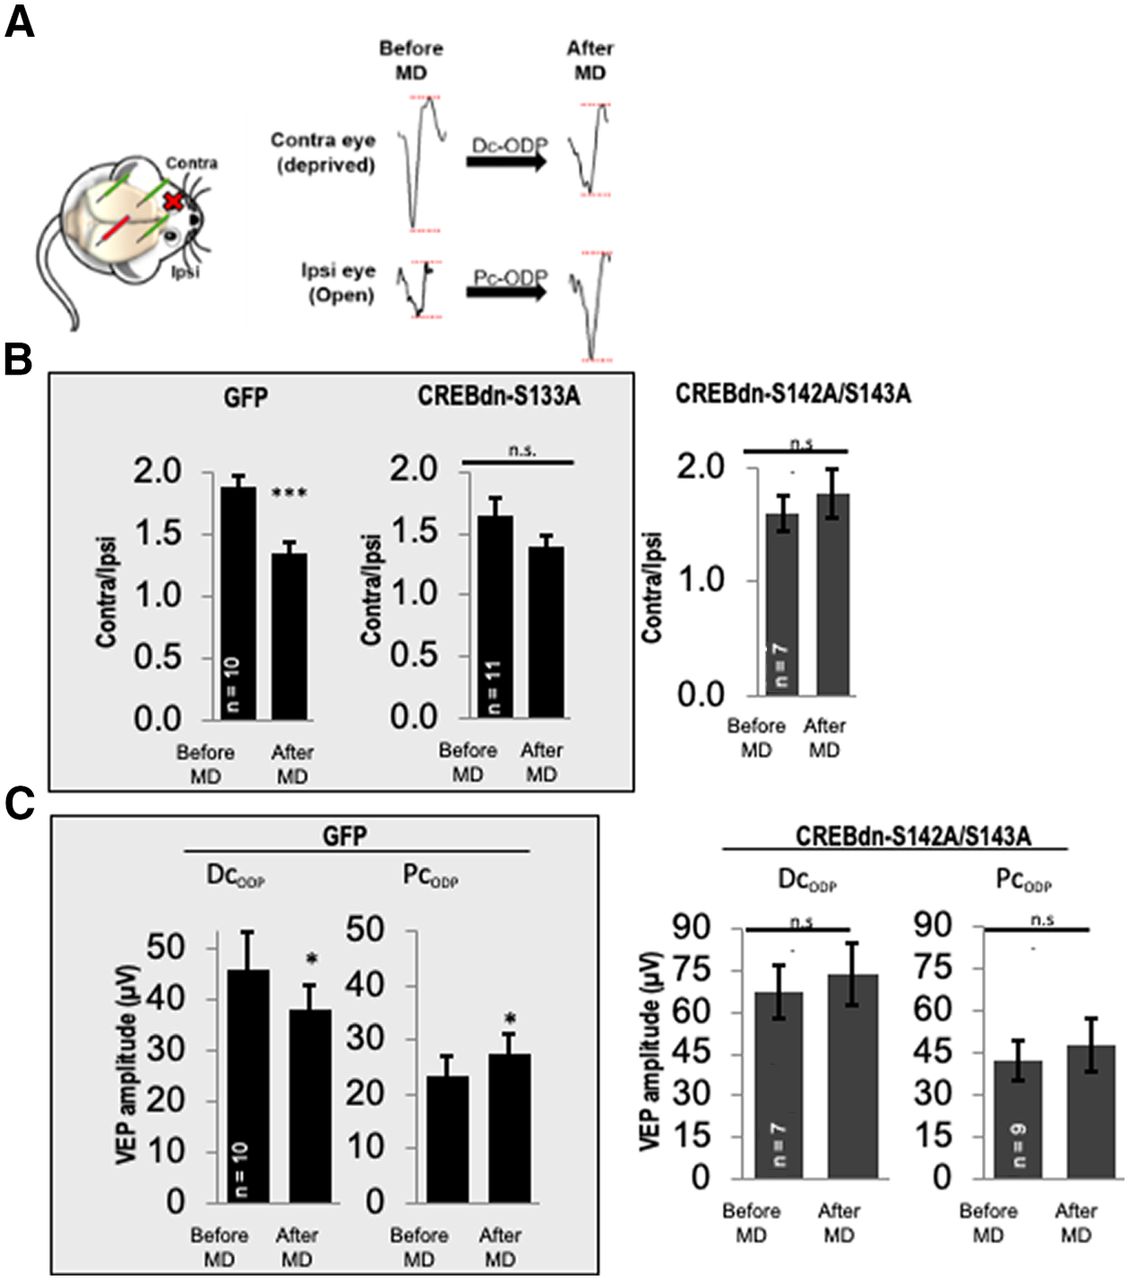
- Figure 5.
Blocking CREB phosphorylation at Ser142/143 blocks both components of ODP. A, left, An implanted mouse with two recording electrodes and two reference electrodes. The red cross on the mouse’s eye represents the MD, and VEPs are recorded from the hemisphere contralateral to the MD (contra eye deprived; red recording electrode) during stimulation of each eye individually. Right, Representative VEP traces before and after MD, with red lines indicating peak to trough amplitude of the VEP from the deprived eye (sutured closed during MD period) and open eye (remained open during MD period). Comparing responses before and after MD, Dc-ODP represents a decrease in VEP amplitude from stimulation of the deprived-eye stimulation, and Pc-ODP represents an increase in VEP amplitude from open-eye stimulation. A, left, Histogram showing that mice injected with HSV-GFP show the expected downward shift in OD after MD (p = 0.0004), whereas mice injected with CREBdn-S133A do not (n.s. = not significant, p = 0.07). Right, Mice injected with CREBdn-S142A/S143A also do not exhibit any OD shift (p = 0.40). C, left, Histogram showing Dc-ODP and Pc-ODP as expected in control mice (p = 0.04 and p = 0.01, respectively). Right, Both Dc-ODP and Pc-ODP are blocked in mice injected with CREBdn-S142A/S143A (p = 0.45 and p = 0.28, respectively). The data in the gray boxes were previously published in J Neurosci (Pulimood et al., 2017). Sample sizes (n) are specified in the histogram for each group. Data in B, C were statistically analyzed using paired t tests. All error bars indicate standard error of the mean (SEM). Contra = contralateral; Ipsi = ipsilateral; MD = monocular deprivation; Dc-ODP = depression component of ocular dominance plasticity; Pc-ODP = potentiation component of ocular dominance plasticity.


In this issue


