

Article Figures & Data
Figures
- Figure 1.
Behavioral establishment of team flow. A, Diagram of the finger-tapping music rhythm game. Participants must tap when animated cues moving from the top of the screen reach the tapping area. B, Manipulations: team flow is predicted when the participants are playing the unmodified song and they can see the partner’s positive feedback (Team Flow). The flow state is disrupted through scrambling the music (Team Only). Team interaction is disrupted by hiding the partner’s positive feedback using an occlusion board (Flow Only). See Table 1 for details. C, Sequence of the trials, showing which song and condition per trial was assigned during the main experiment. D, Trial analysis: participants were sitting still while listening to a background music during the resting phase and played the game in the playing phase. The electroencephalogram was epoched for objective assessment of flow i.e., the AEP analysis of the task-irrelevant beeps (orange bar) and for the NCs analysis (green bar). After each trial, participants answered the questionnaire for the subjective assessment of flow. Extended Data Figure 1-1 shows detailed analysis pipeline.
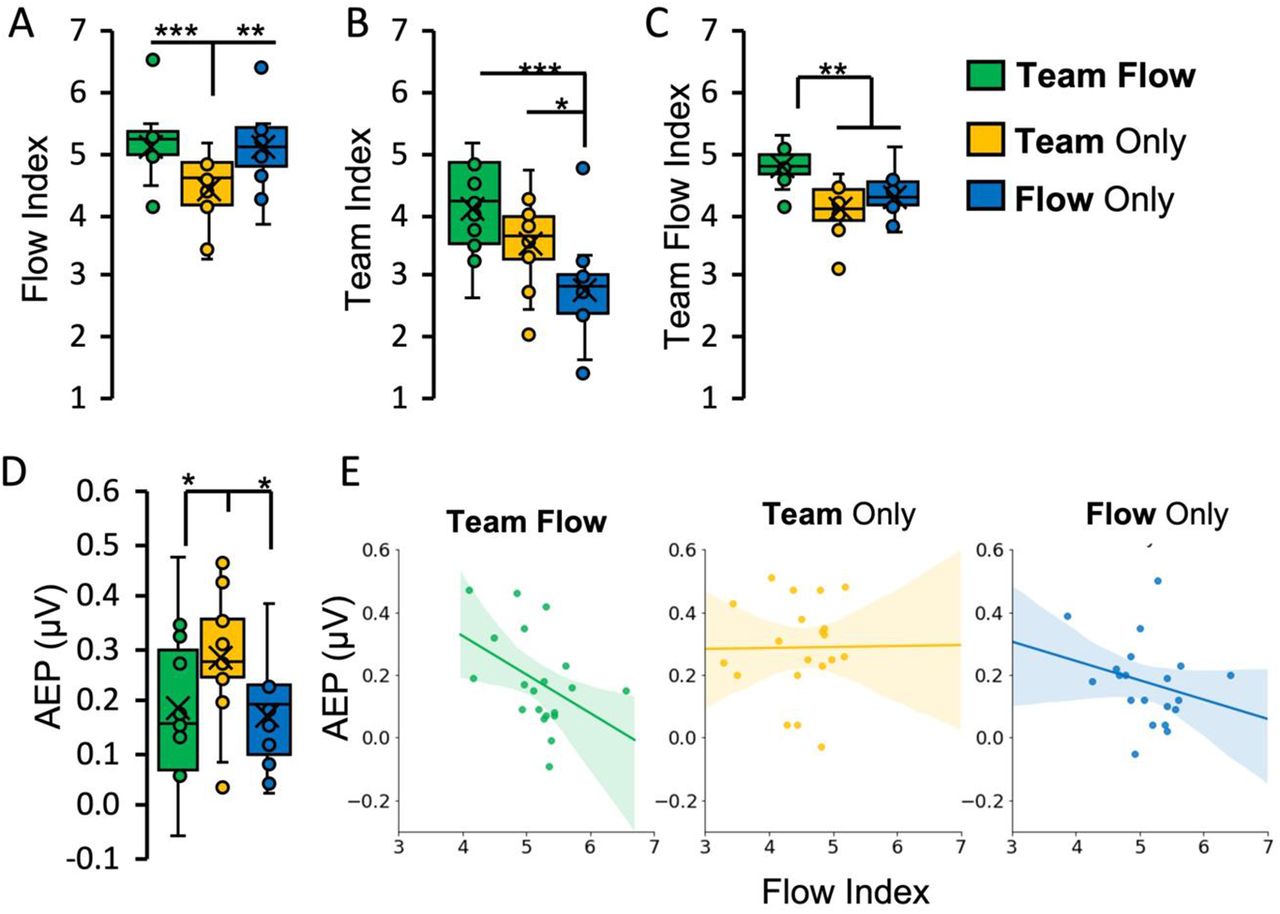
- Figure 2.
Assessment of the flow state. A–C, Subjective assessment of flow: psychometric rating indices as a measure of subjective flow (flow index; A), team interaction (team index; B), or team flow (team flow index; C) experiences (Extended Data Fig. 2-1 shows the detailed psychometric ratings for each question). Friedman test with Conover’s post hoc test; *p < 0.05, **p < 0.01, ***p < 0.001. Error bars represent mean ± SEM; n = 15. D, E, Objective assessment of flow. D, The mean AEP calculated by averaging the following time windows: N1 (110–150 ms), P1 (210–250 ms), and N2 (310–350 ms), considering polarity. The non-flow condition (Team Only) showed statistically significant higher AEP than the flow conditions. One-way repeated measures ANOVA with Bonferroni post hoc test; *p < 0.05. Error bars represent mean ± SEM; n = 15. E, Spearman’s correlation between AEP and flow index. AEP is negatively correlated with the flow index in the team flow condition (Spearman’s Rho = −0.48, p = 0.03), showing a negative correlation trend in the flow only condition (Spearman’s Rho = −0.29, p = 0.22), and no correlation in the team only condition (Spearman’s Rho = 0.11, p = 0.64). The lines indicate the regression lines. Shaded areas indicate a 95% confidence interval; n = 20. Extended Data Figure 2-2 shows the detailed AEP analysis.
- Figure 3.
Higher β-γ power at the L-MTC revealed as a unique neural signature for team flow. A, The topographies of the β and γ frequencies (13–120 Hz) computed as the average over normalized power. B, Permutation statistical significance across conditions with Bonferroni multiple comparison corrections. The black crosses indicate channels with p < 0.05. C, The normalized power spectral analysis averaged from the four channels in the left temporal area identified in B. Shaded area represent mean ± SEM; n = 20. Extended Data Figure 3-1 shows the power difference spectral analysis grand averaged across all the 128 channels. D, Averaged normalized power for the β-γ (13–50 Hz) frequency band showing power enhancement in the team flow condition. One-way repeated measures ANOVA with Bonferroni post hoc test; *p < 0.05. Error bars represent mean ± SEM; n = 15. E, The brain regions (highlighted in green), as defined by the Destrieux atlas and showing significant β-γ normalized power difference across conditions. Extended Data Figure 3-2 shows the average normalized β-γ power for each significant region. F, The average normalized β-γ power at the L-MTG. One-way repeated measures ANOVA with Bonferroni post hoc test; **p < 0.01. Error bars represent mean ± SEM; n = 15. G, Condition-specific Spearman’s correlations between β-γ power and team flow index at L-MTG as a representative region. Positive correlation was found in the team flow condition (Spearman’s Rho = 0.56, p = 0.006), but not in the team only condition (Spearman’s Rho = −0.19, p = 0.43) or in the flow only condition (Spearman’s Rho = −0.02, p = 0.95). The lines indicate the regression lines. Shaded areas indicate a 95% confidence interval; n = 20.
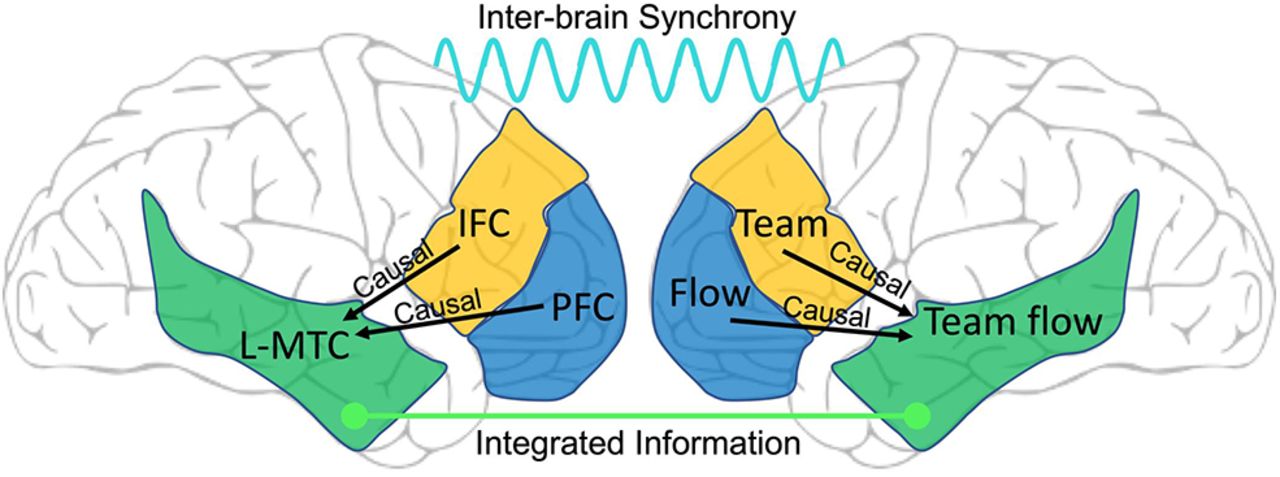
- Figure 4.
Causality and II analyses during team flow. A, Causality analysis showing the top information senders among all RG-RG causal interactions. For each RG-RG connection, the line color matches the color of the RG name which sends the information. Notably, only in the team flow condition, L-MTC receives information from R-PFC and R-IFC. Extended Data Figures 4-1, 4-3, 4-4 show the method for grouping of ROIs. Extended Data Figure 4-2 shows detailed causality analysis. B, The mean normalized II value (Norm II) connectivity matrix for the brain regions (RG1–RG7). Normalized II is calculated by subtracting the mean per condition from the average II across conditions for each RG-RG connection across conditions. C, The mean global Norm II averaged across all RG-RG connections showing significantly higher interbrain (left panel) and intrabrain (right panel) mean during team flow condition. One-way repeated measures ANOVA with Bonferroni post hoc test; **p < 0.01. Error bars represent mean ± SEM; n = 15. D, RG-RG connections that shows significant (p < 0.05) Norm II in the team flow condition compared with other conditions. Three-way repeated measures ANOVA with Bonferroni post hoc test. Black lines indicate intrabrain and green line indicates interbrain RG-RG connections. D-L, dorsal-left.
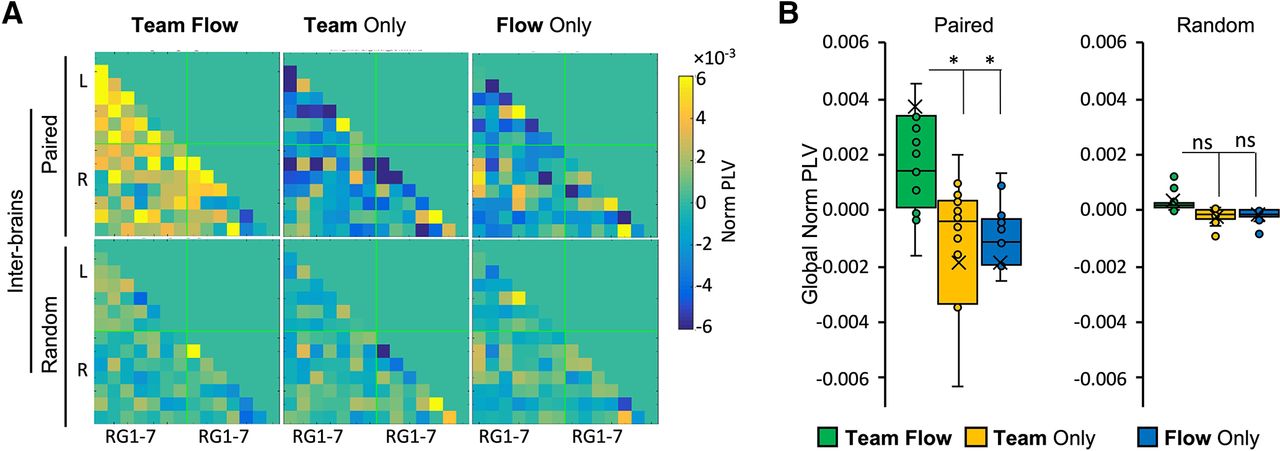
- Figure 5.
PLVs show enhanced interbrain synchrony during team flow. A, The mean PLV connectivity matrix for the brain regions (RG1–RG7). Normalized PLV is calculated by subtracting the mean per condition from the average PLV across conditions for each RG-RG connection across conditions. “Paired” indicates the actual experimental pair, “random” indicates randomly selected pairs. B, The mean global normalized PLV averaged across all RG-RG connections showing significantly higher interbrains during the team flow condition. Two-way repeated measures ANOVA for interbrain comparison with Bonferroni post hoc test; *p < 0.05. Error bars represent mean ± SEM; n = 15. ns, not significant.


Tables
Conditions Team Flow Team Only Flow Only Cues sequence (visual stimulus) Self Constant (visible to both participants) Partner Constant (visible to both participants) Positive Feedback Self Visible (performance dependent) Partner Visible Visible Not visible Song (auditory stimulus) Original Scrambled Original Beeps (task-irrelevant stimulus) Constant Constant Constant
Movies
- Movie 1.
A few seconds of game-play in the Team Flow and Team Only conditions. The “beeps” word at the bottom right indicates the timing of the task-irrelevant beep sound presentation. These words are overlaid in the video for illustration and were not present during the experiment. The scores and other indicators at the center and at the top right and left corners were hidden from the participants.
Extended Data Figure 1-1
Experimental design. A, A screenshot of the game showing feedback and position of the card board. The first type of feedback was invisible to participants. The second type of feedback was visible to participants in the Inter-SyncA and Inter-ScrA conditions. The cardboard (red dashed line) occluded the tapping area, the second type of feedback, and the whole bodies of participants including fingers. The cardboard kept the visual cues visible to participants (green dashed rectangle). B, Trial and analyses details: participants were sitting still while listening to a background music during the resting phase. The electroencephalogram was epoched for the AEP analysis of the task-irrelevant beep sound (AEP epochs; orange) and for the NCs analysis (NC epochs; green). All NC analyses, with the corresponding figure or table, are summarized in steps 3–6. Download Figure 1-1, TIF file.
Extended Data Figure 2-1
Summary of subjective ratings for assessing the flow state and team interaction. The flow index was calculated by averaging responses for 1–6, the team index was calculated by averaging 7–9, and the team flow index was calculated by averaging 1–9. Psychometric ratings description: (1) “I had the necessary skill to play this trial successfully”; (2) “I will enjoy this trial more if it has less/more notes”; (3) “I felt in control while playing this trial”; (4) “I made correct movements automatically without thinking”; (5) “I love the feeling of this trial and want to play it again”; (6) “How time flies during this trial”; (7) “I was aware of the other player’s actions”; (8) “I felt like I was playing with the other person as a team”; (9) “I was coordinating my fingers with the other player’s fingers”; (10) “I felt like I was competing with the other player”; (11) “I was distracted by the other player’s actions” [for (2), rating 7 = more notes and 1 = less notes; for (6), rating 7 = fast and 1 = slow; for the rest, rating 7 = strongly agree and 1 = strongly disagree]. Error bars represent mean ± SEM; n = 20. Download Figure 2-1, TIF file.
Extended Data Figure 2-2
A, B, Time-frequency analysis of the AEP locked to the task-irrelevant beep onsets, presented as the ERSP in A and the IEC analysis in B. Both ERSP and ITC showed changes in θ activity at 100–350 ms postonset (upper panel). An increase in θ activity (3–7 Hz) was prominent at 150–250 ms postonset (lower panel). C, Topographies of the event-related potential (ERP), bandpass-filtered in the θ range (3–7 Hz), at the indicated time points (ms) from the task-irrelevant beeps showing enhanced potential at the central channels. D, E, The potential, pass-filtered in the θ range (3–7 Hz), at central channels locked to the task-irrelevant beep onsets during the resting (D) and playing (E) phases. Download Figure 2-2, TIF file.
Extended Data Figure 3-1
A, The power difference spectral analysis for the three conditions grand averaged for all the 128 channels. B, Averaged individual power difference for the α (8–12 Hz), the β (13–30 Hz), and γ (31–120 Hz) frequency bands. One-way repeated measures ANOVA with Bonferroni post hoc test; *p < 0.05. Error bars represent mean ± SEM; n = 20. Download Figure 3-1, TIF file.
Extended Data Figure 3-2
Localization of the higher β-γ power during team flow. A, The brain regions (highlighted in green), as defined by the Destrieux atlas and showing significant β-γ normalized power difference across conditions. B, The average normalized β-γ power at the significant ROIs. Bonferroni-corrected critical value one-way ANOVA with Bonferroni post hoc test. C, D, Unsupervised hierarchical vertices clustering based on β-γ power difference between conditions. C, Clustered-vertices projected to a standard brain to visualize cluster localization. The black lines indicate the boundaries of the ROIs shown in B. D, The cluster-averaged normalized power of the β-γ power at each cluster. One-way repeated measures ANOVA with Tukey–Kramer’s post hoc test. Flow-related (cl 1–1–2), social-related (cls 3–4), or team flow-related (cls 5–7) clusters are indicated in the same color scheme as in D; *p < 0.05, **p < 0.01, #p = 0.077. Error bars represent mean ± SEM; n = 20. B, bottom view; R, right; L, left; AOS, anterior occipital sulcus; PLF, posterior lateral fissure; ITS, inferior temporal sulcus; MTG, middle temporal gyrus; STS, superior temporal sulcus; PT, superior plannar-temporal gyrus; TPJ, temporal parietal junction, LTS, lateral temporal sulcus; ITG, inferior temporal gyrus; CLS, collateral and lingual sulcus. Download Figure 3-2, TIF file.
Extended Data Figure 4-1
Activity-dependent anatomically-defined grouping of ROIs (RGs). A, A medial view of the left superior frontal cortex (area inside the red boundary/transparent contour) before (left panel) and after (right panel) subdivision. B, The cumulative cluster composition curve for the left superior frontal cortex. The subdivision thresholds are shown as two vertical black lines subdividing this ROI into three subdivisions: flow-related subdivision (cls 1–2), team-related subdivision (cls 3–4), and team flow-related subdivision (cls 5–7). C, Transparent contours showing the brain regions which are also summarized in Extended Data Table 4-2. B, bottom; D, dorsal; L, left; R, right; T, top; V, ventral. Download Figure 4-1, TIF file.
Extended Data Figure 4-2
Information causality analysis showing the MTC receives information from other brain regions. A, The mean causal interaction matrix for the brain regions (RGs). “To” indicates sending information; “from” indicates receiving information. The GGC (top), dDTF (middle), and the dDTF (bottom). L, left hemisphere; R, right hemisphere. B, The mean causal to/from ratio for GGC (top), dDTF (middle), and nPDC(bottom). In all GC measure, L-MTC (L-RG7) is a significant information receiver. Two-way repeated measures ANOVA with Tukey’s post hoc test; *p < 0.05, ***p < 0.001, ****p < 0.0001. Dashed line indicates p > 0.05. Error bars represent mean ± SEM; n = 20. Download Figure 4-2, TIF file.
Extended Data Figure 4-3
Cluster composition (percentage) of the activity-dependent anatomically-defined groups (RGs). Download Figure 4-3, DOCX file.
Extended Data Figure 4-4
Anatomical composition of the activity-dependent anatomically-defined groups (RGs). Download Figure 4-4, DOCX file.
In this issue


