

Article Figures & Data
Figures
- Figure 1.
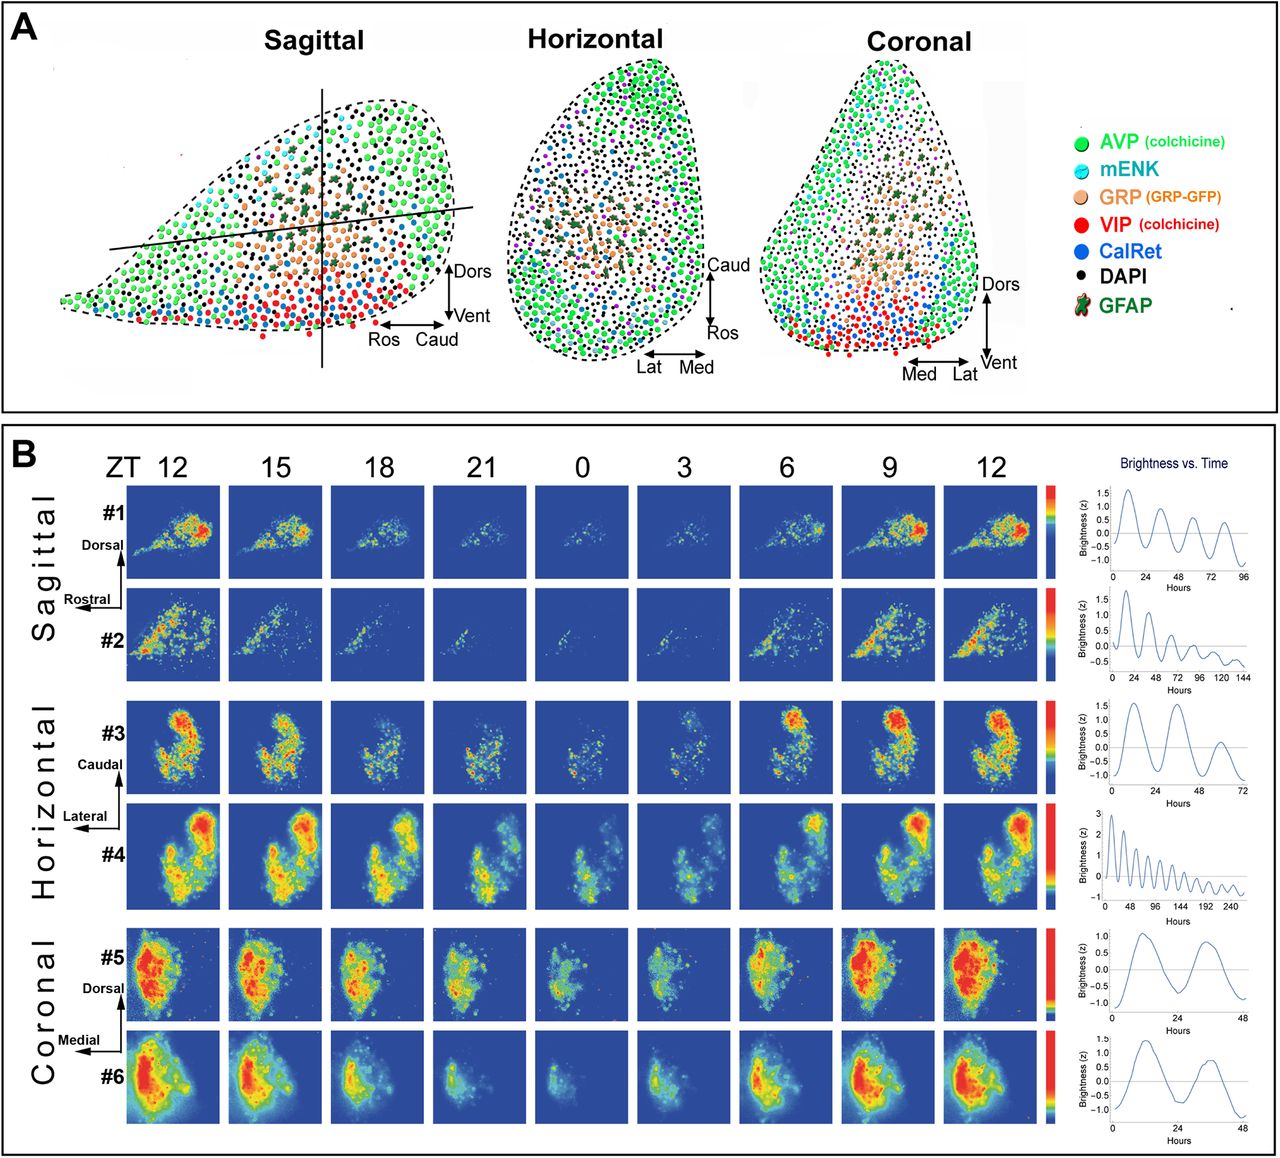
Architecture and PER2 expression of the SCN and bioluminescence heat maps and brightness time series. A, Depiction of the peptidergic architecture by analysis of single-labeled SCN peptides in sagittal, horizontal, and coronal planes. The vertical and horizontal lines in the sagittal section indicates the plane shown in the adjacent cartoons of horizontal and coronal sections. DAPI label represents cells that are not positive for any of the markers used. VIP-containing neurons lie in the ventral core area. AVP neurons lie in the rostral protrusions and in much but not all of the outer borders of the nucleus. A GRP-rich area, along with nearby GFAP-positive elements, lies between the VIP core and AVP shell. In horizontal sections, the precise peptidergic content of an SCN slice differs markedly depending on the angle and depth at which the SCN is cut; if the ventral aspect is included in a slice, then both the core and shell are represented. In coronal sections, the localization of core (VIP- and GRP-rich) and shell (AVP-rich) regions are seen. B, The spatiotemporal pattern in PER2::LUC bioluminescence in SCN slices is shown at 3-h intervals for representative sagittal, coronal, and horizontal slices. Time zero was defined as the time point with the lowest bioluminescent intensity (for details, see Materials and Methods). The pseudocolored images are normalized to the brightest image of each slice. The rainbow scale (blue, low and red, high expression) for each slice lies on the right side of the last panel. The SCN slices are numbered consistently to correspond on all figures. All slices were recorded for the same 6-d duration, starting immediately after harvesting the tissue. Mean circadian oscillation used in further analysis is shown in the right column. Explanation of differences among slices in the durations of data used for analysis is provided in Materials and Methods. PER2 expression in perfused tissue from animals killed at controlled times of day is shown in Extended Data Figure 1-1 and further information on methods is given in (Riddle et al., 2017).
- Figure 2.
Global phase maps and phaseoids. A, Phaseoids in the SCN. The top panel is a raw image of a bioluminescent recording near the trough of PER2::LUC expression in a sagittal section. Red asterisks highlight the location of phaseoids. The inset shows a magnification of the phaseoid indicated by the arrow. The middle panels are bioluminescent images of a phaseoid in a sagittal section taken at two time points. At time 23, PER2::LUC expression is higher in the center cell compared with its neighbors. Five hours later, PER2::LUC expression is higher in surrounding cells compared with the center cell. The bottom panel shows the PER2::LUC oscillation over ∼72 h in the center cell (red circle), surround cell (green circle), and the whole SCN for the phaseoid in the middle panel. B, Mathematically assessed phase maps for sagittal, horizontal, and coronal slices of the SCN. Phase is represented by color, ranging from regions that are phase advanced (red) or phase delayed (blue) with respect to the tissue mean (yellow). The color of the 12-h advanced regions matches to those with 12-h delayed regions, as these will be in phase with one another in a 24-h oscillation. All sections exhibit areas that are phase advanced and others that are phase delayed often intermingled with one another. The analysis of immunohistochemical staining of SCN slices after imaging is shown in Extended Data Figure 2-1 using methods previously reported in (Yoshikawa et al., 2015). Phaseoids in fixed SCN tissue are shown in Extended Data Figure 2-2.
- Figure 3.
Local phase comparisons reveal phaseoids. A, Center-surround filter is superimposed on a magnified view of a phase map. Upper panel, In the center, there is a cell-sized region that is phase leading the mean signal. In the annular region, several cell-sized areas are phase lagging the mean signal. This is consistent with evidence (Fig. 2) showing that neighboring areas have different levels of expression in similar local spatial arrangements. Middle panel, Cross-section of the center-surround filter used to compute the local phase differences. Lower panel, Results of the local phase difference computation on the same region and with the same center circle and surround annulus as the upper panel. The computation isolates the cell-sized regions and identifies them as phase leading or phase lagging the neighboring pixels, allowing a full slice analysis of local phase differences. The example shown here is the same phaseoid as that shown in Figure 2A. Note that the original observation of the phaseoid was by visual identification in the movie, and it is well captured by the filter (shown in Extended Data Fig. 3-1). B, Local phase differences as computed using the center-surround filter show numerous portions of the SCN that are out of phase with their neighboring tissue. Sagittal and horizontal slices show a gradient along the rostro-caudal axis where phase differences are smaller at the caudal than the rostral aspect. The colors in this figure have been truncated to emphasize differences in values close to zero. The green border around the edge of each SCN is the result of “padding” to fill the kernel. C, Plot of the global phase against the local phase difference to examine the relationship between the two. Each point represents a single pixel. On the horizontal axis (global phase estimate of the tissue), positive values indicate oscillation that lags the mean oscillation while negative values indicate leading the mean oscillation. Linear regression lines (red) have high statistical significance and support the hypothesis that areas with larger local differences are more strongly leading or lagging the mean.
- Figure 4.
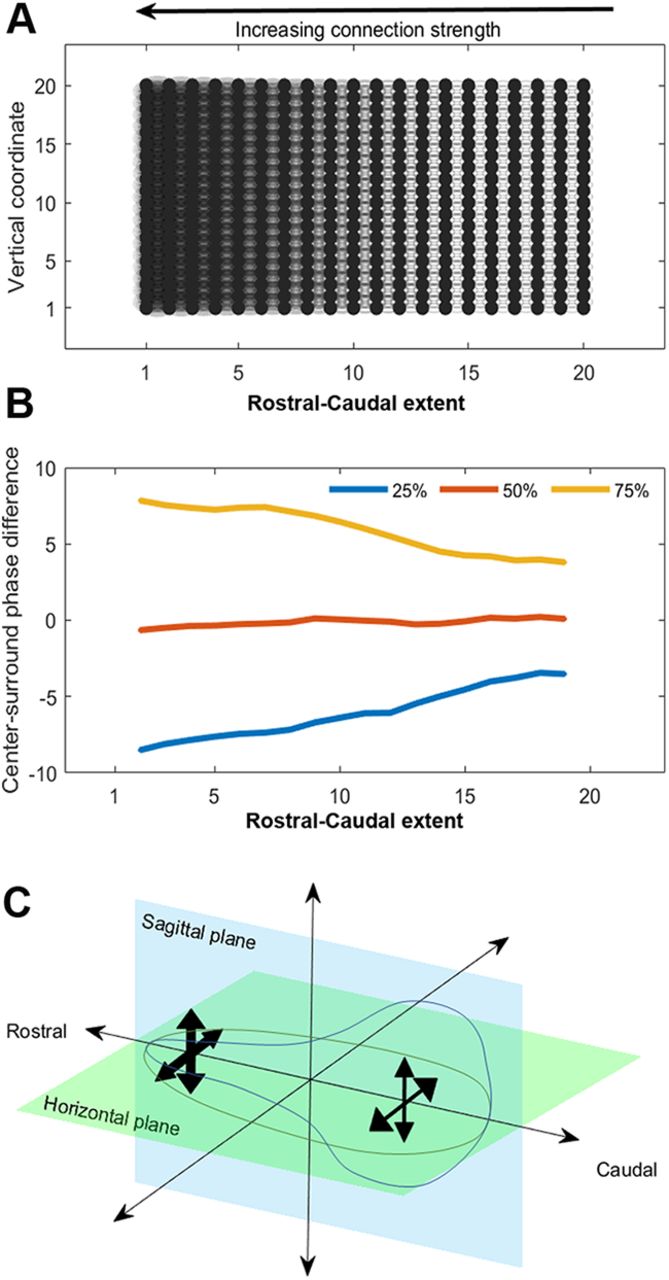
Kuramoto models connect the magnitude of local phase differences with the strength of local connectivity. A, A schematic of the network connectivity we use in simulations using the Kuramoto coupled oscillator model. The differences in shading from right to left indicate quadratically growing strength of the nearest neighbor coupling in the model. B, Results of applying the center-surround filter to simulated data over 500 trials. We report the quartiles of the distribution of local phase differences for each column of oscillators (as in A) as we move from right to left, showing that as the connectivity grows, so does the magnitude of the local phase differences. C, A schematic summarizing the interpretation of the local phase differences in the context of simulation results. Comparing to simulation results provides evidence that connection strength is weaker at the caudal edge of sagittal and horizontal sections and grows as we move toward the rostral tip.


Extended Data
Extended data Figure 1-1
PER2 expression at 2-h intervals in medial, mid and lateral SCN. To localize changes in PER2 expression so as to have a baseline against which to compare the ex vivo sagittal slices in the real-time imaging experiments, we assessed expression of the protein through the entire SCN in fixed tissue at 2-h intervals. Female (N = 11) and male (N = 25) mice were perfused and brains were processed to stain for PER2 (as in Riddle et al., 2017; rabbit anti-PER2 antibody used at 1:500; catalog #AB2202; RRID:AB_1587380, EMD Millipore Corporation). Sagittal sections of the SCN allowed visualization of the full rostro-caudal extent of the nucleus. Each dot represents the number and location of the PER2 nuclei observed in two to three brains at each time point. PER2-positive neurons can be seen at the trough of PER2 at ZT24/ZT0 to ZT4 in the mid and lateral SCN in the mid SCN. The rostral SCN expresses PER2 from ZT4 to ZT22. The photomicrographs in row 4 and 8 show the mid SCN. The implication of regionally localized PER2 expression is that the observed network architectures will depend on the precise orientation of the slice. Maintaining the rostral and caudal poles of the SCN may preserve important circuit components that are lost in coronal sections. Download Figure 1-1, TIF file.
Extended data Figure 2-1
Postimaging immunohistochemical analysis of histology. After imaging, sagittal slices (n = 22 slices, 100 μm, from 6 mice) were fixed with 4% PFA after the bioluminescence recording, and immunohistochemically labeled with a cocktail of antibodies against AVP (AVP-NP, PS419) and VIP (Peptide Institute, 14110). Immunohistochemical staining was examined by fluorescent microscopy (BZ9000; Keyence) as previously reported (Yoshikawa et al., 2015). A, Schematic drawing of the SCN. The blue lines indicate the plane of 100-μm sagittal slices that were made. Numbers (–2 ∼ +2) indicate position of the sagittal slices with respect to the midline. B, Images of bioluminescence, immunohistochemical staining for AVP, VIP, and overlay of AVP and VIP. C, Chart comparing robustness of oscillation and expression of AVP and VIP in each slice. Slice IDs indicate good (black) and poor (grey) rhythms. Number of immunopositive cell bodies for VIP and AVP are expressed in symbols. ++, high; +, medium; ±, low; –, none. Robust oscillation requires both AVP and VIP expression. Slices bearing a large number of AVP neurons but lacking VIP showed poor rhythm. The one slice that had both peptides could not classified with respect to rhythmicity due to technical equipment problems. Anatomical analysis of peptide expression was conducted independently and prior to classification of rhythmicity. The number of positive cell bodies were scored as follows. For VIP: >10 cells = ++, 5–9 cells = +, 1–4 cells = ±, no cells = –. For AVP: >20 cells = ++, 5–20 cells = +, 1–5 cells = ±, no cell = –. Download Figure 2-1, TIF file.
Extended data Figure 2-2
Phaseomes in fixed SCN tissue: photomicrograph of a 50-μm sagittal SCN section immunostained for PER2 (red) at ZT20. White asterisks show the location of phaseomes. The inset is a magnification of the phaseome indicated by the white arrow. Slices were processed for immunocytochemistry as in Riddle et al. (2017). Download Figure 2-2, TIF file.
Extended data Figure 3-1
This figure gives a comparison between manual identification of neurons that are possibly out of phase with their surroundings and the results of the local phase difference computations. The left panel shows a region of the SCN in a movie frame near the trough of the mean oscillation of the tissue. In observing the movie, we could identify several neurons (marked with a red asterisk) that seemed to be out of phase with much of the surrounding tissue. In the middle panel, different intensities of green indicate the results of the local phase computations, with the more negative phase differences shown in brighter green. The locations of the neurons from the first panel are marked with blue asterisks where the color scale indicates that they are oscillating between 2 and 3 h behind the surrounding annular region. The right panel shows a merging of the two other panels, demonstrating that the higher intensity areas from the first panel coincides with more negative local phase differences from the second panel. The overlay creates magenta asterisks showing that the placement of the images coincides. Download Figure 3-1, TIF file.
In this issue


