

Abstract
Neuroscience has been transformed by the ability to genetically modify inbred mice, including the ability to express fluorescent markers specific to cell types or activation states. This approach has been put to particularly good effect in the study of the innate immune cells of the brain, microglia. These specialized macrophages are exceedingly small and complex, but also highly motile and mobile. To date, there have been no tools similar to those in mice available for studying these fundamental cells in the rat brain, and we seek to fill that gap with the generation of the genetically modified Sprague Dawley rat line: SD-Tg(Iba1-EGFP)Mmmc. Using CRISPR-Cas/9 technology, we knocked in EGFP to the promoter of the gene Iba1. With four male and three female founders confirmed by quantitative PCR analysis to have appropriate and specific insertion, we established a breeding colony with at least three generations of backcrosses to obtain stable and reliable Iba1-EGFP expression. The specificity of EGFP expression to microglia was established by flow cytometry for CD45low/CD11b+ cells and by immunohistochemistry. Microglial EGFP expression was detected in neonates and persisted into adulthood. Blood macrophages and monocytes were found to express low levels of EGFP, as expected. Last, we show that EGFP expression is suitable for live imaging of microglia processes in acute brain slices and via intravital two-photon microscopy.
Significance Statement
Neuroscience research in rat models has lagged compared with the mouse because of limitations in the ability to generate genetic modifications. To fill part of that gap, we have generated a transgenic rat in which the innate immune cells of the brain, microglia, express EGFP. This modification allows for isolation of microglia from other cells by flow cytometry or FACS for detailed transcriptomic and proteomic analysis. The visualization of EGFP in acute brain slices or by in vivo imaging further enhances the ability to interrogate the role of these critical cells across the life span and in health and disease.
Introduction
Microglia are the resident macrophages of the brain. Despite comprising only 10–15% of the total number of cells (Lawson et al., 1990), microglia have a drastic impact on the brain throughout the life span (Bilbo and Schwarz, 2012). During development, these specialized phagocytes act as “sculptors” of the brain by regulating cell number, coordinating synaptic connectivity, and facilitating myelination (Sierra et al., 2010; Paolicelli et al., 2011; Schafer et al., 2012; Lenz et al., 2013; Parkhurst et al., 2013; Ueno et al., 2013; Hagemeyer et al., 2017; VanRyzin et al., 2019). As the brain matures, microglia function and phenotype shift; by adulthood, microglia are tiled throughout the brain where they can effectively survey their local environment, facilitate synaptic transmission, and respond to injury (Davalos et al., 2005; Nimmerjahn et al., 2005; Wake et al., 2009; Rogers et al., 2011; Nikodemova et al., 2015).
Given the variable functional repertoire and the dynamic nature of these cells, the ability to faithfully identify and label microglia is of upmost importance to researchers. Changes in microglia function are often reflected as changes in morphology or the number at a given point in time and are often studied by examining aspects of microglia morphology in relation to other end points of interest (i.e., phagocytic cups, synaptic contacts, process motility). Identifying microglia morphology is usually accomplished by using antibody labeling for immunohistochemical analysis. Microglia express a number of proteins that can distinguish them from surrounding neural tissue, the most common being ionized calcium-binding adapter molecule 1 [Iba1; also called allograft inflammatory factor-1 (Aif1)], which provides robust histologic labeling and has been widely used to good effect for many years. However, immunohistochemical analysis is severely limited as it is a postmortem method of analysis and does not allow for direct assessments of microglia function in real time.
The tools and techniques for microglia analysis have rapidly evolved for researchers using the mouse as a model organism (Guttenplan and Liddelow, 2019). These include several knock-in models such as CX3CR1 (the fractalkine receptor) being replaced with EGFP (Jung et al., 2000), EGFP driven by the endogenous Iba1 promoter (Hirasawa et al., 2005), and, more recently, EGFP driven by the microglia-specific Tmem119 gene (Kaiser and Feng, 2019). These tools have revealed unexpected roles for microglia in regulating synapses (Paolicelli et al., 2011; Schafer et al., 2012; Parkhurst et al., 2013), astroglial transitioning in the subventricular proliferative zone (Xavier et al., 2015), and distinguishing infiltration of peripheral macrophages from endogenous microglia following brain injury (Tanaka et al., 2003), to name very few. The development of comparable resources for rats has been minimal and thereby hampered progress in this valuable animal model.
Rats provide some distinct advantages over the mouse, not the least of which is physical size, which can be a limiting factor when working with very young animals or collecting small tissue samples for downstream processing [e.g., flow cytometry, fluorescence activated cell sorting (FACS), proteomics]. Many laude the rat for superior cognitive ability and social behavior complexity (Ellenbroek and Youn, 2016), and, although this notion has been challenged (Jaramillo and Zador, 2014), there is still much to understand given the importance of microglia in regulating these behavioral domains (Frost and Schafer, 2016). Rats also exhibit some behaviors not readily apparent in the mouse, for example, juvenile rough-and-tumble play (VanRyzin et al., 2019). Many sex differences in the rat brain are determined by the developmental actions of microglia (Lenz and Nelson, 2018), but a similar relationship has not yet been established in the mouse.
To address this shortcoming and provide a resource for investigators wishing to study microglia while capitalizing on the advantages of using a rat model, we contracted the design and development of a novel Iba1-EGFP transgenic rat. We show that EGFP expression is robust, highly specific to microglia in the brain, and is suitable for cell-sorting and live-imaging studies.
Materials and Methods
Generation and validation of SD-Tg (Iba1-EGFP)Mmmc transgenic rats
Applied StemCell was contracted to generate the Iba1-EGFP knock-in rat model using CRISPR/Cas9 technology in the Sprague Dawley rat strain. The donor construct inserted consisted of the EGFP coding sequence (minus the first ATG), followed by the 22 aa sequence of the porcine teschovirus-1 2A (P2A) self-cleaving peptide and then the first exon of the rat Iba1 gene immediately downstream of the translational start site. Guide RNA candidates targeting the Iba1 gene just downstream of the translational start site were prepared via in vitro transcription from a T7 promoter and individually tested for efficiency in Sprague Dawley embryos. The guide RNA that was used demonstrated 100% efficiency and had the following sequence: 5′-TACCCTGCAAATCCTTGCTCTGG-3′. Microinjected embryos were implanted into Sprague Dawley surrogate dams and the resulting pups were screened for site-specific insertion of EGFP sequence via PCR. Of 34 pups screened, 7 were positive for EGFP sequence with the correct 5′ and 3′ insertion sites at the endogenous Iba1 sequence. PCR products from these animals were sequenced to further confirm site-specific insertion of EGFP downstream of the Iba1 translational start site, the formation of correct junctions, and the fidelity of the sequence contained within the insertion. Two heterozygous male and three heterozygous female founder animals were shipped to the University of Maryland School of Medicine and were maintained on a 12 h reverse light/dark cycle with ad libitum access food and water. Animals were mated in our facility, and pregnant females allowed to deliver naturally with the day of birth designated as postnatal day 0 (P0). Male and female F2 and F3 offspring of founder animals were used in these studies. All animal procedures were performed in accordance with the regulations of the Animal Care and Use Committee at the University of Maryland School of Medicine. This transgenic line has been registered with the Medical College of Wisconsin Rat Resource Center as SD-Tg(Iba1-EGFP)Mmmc.
Genotyping
Genotyping of Iba1-EGFP offspring was performed using MyTaq Extract-PCR reagents (Meridian Bioscience). Tail snips taken from pups during the first 5 postnatal days or ear clips from adult animals were used to provide DNA for genotyping. Tissue homogenates were diluted 1:100 in double-distilled H2O and were used in a PCR containing 200 nm each primer, and thermocycled through 95°C for 60 min, 55°C for 30 s, and 72°C for 90 s for 34 cycles. PCR primers for genotyping were designed to target the 5′ upstream regulatory sequence of the endogenous Iba1 gene and the Iba1 coding sequence, and span the insertion site of the EGFP sequence (Integrated DNA Technologies; Table 1). Thus, both the wild-type Iba1 allele and the EGFP insertion were detected as bands of 334 and 1114 bp, respectively. Genotyping was confirmed and is commercially available from TransnetYX.
List of RNA sequences and primers
Western blot
Total protein was isolated from cortical tissue of EGFP+/+, EGFP–/+, and EGFP−/− (wild-type) rats at P18 by homogenizing in 10 mm Tris-HCl, pH 7.6/150 mm NaCl/1% Nonidet P-40/1% sodium deoxycholate, with protease and phosphatase inhibitors (Sigma-Aldrich). For each sample, 30 μg of cortical protein homogenate was resolved on a 12% Bis-Tris polyacrylamide gel (NuPage, Thermo Fisher Scientific) under reducing and denaturing conditions, and transferred to PVDF membrane. Membranes were blocked with Odyssey Blocking Buffer (LI-COR) diluted 1:1 with Tris-buffered saline (TBS), pH 7.4, and incubated overnight at 4°C with primary antibodies diluted in a 1:1 solution of Blocking Buffer/TBS-0.01% Tween. The primary antibodies used were chicken-anti-GFP (1:4000; Thermo Fisher Scientific) and mouse anti-Gapdh (1:5000; Abcam). After washing in TBS-0.1% Tween, membranes were incubated in 1:1 Blocking Buffer–TBS-Tween/0.02% SDS containing secondary antibodies (both diluted 1:10,000; IRDye 800 donkey-anti-chicken and IRDye 680 goat-anti-mouse IgG, LI-COR). Membranes were imaged on an Odyssey CLx Infrared Imaging System (LI-COR).
Flow cytometry
Animals were deeply anesthetized with Fatal Plus (Vortech Pharmaceuticals) and were transcardially perfused with ice-cold PBS, 0.1 m, pH 7.4, until the perfusate was clear. Intracardiac blood was collected, washed with PBS, resuspended in an ammonium chloride red blood cell lysis buffer for 10 min, and centrifuged to obtain a clear cell pellet before antibody labeling. Neonatal (P7) brains, spinal cords, and dorsal root ganglia were removed and dissociated with the Neural Tissue Dissociation Kit P (Miltenyi Biotec). Adult (P60+) brains were dissociated with 1 mg/ml collagenase-D (Sigma-Aldrich) and 0.25 mg/ml DNase I (Sigma-Aldrich) in RPMI solution (Thermo Fisher Scientific) for 20 min. Cells were washed in RPMI solution, resuspended in 37% Percoll (Sigma-Aldrich), and centrifuged at 1200 × g for 15 min to separate the myelin debris layer. Both neonatal and adult brain homogenates were washed with ice-cold FACS buffer (2% bovine serum albumin, 2 mm EDTA in PBS) before antibody labeling.
Blood and brain samples were blocked with anti-CD32 (1:100; clone D34-485, BD Biosciences) and stained with Fixable Viability Dye eFluor 780 (Thermo Fisher Scientific). To identify microglia, cells were labeled with anti-CD11b-PE (1:200; clone WT.5, BD Biosciences) and anti-CD45-AF700 (1:200; clone OX-1, BD Biosciences) antibodies in FACS buffer. Cells were washed and analyzed on an LSRII flow cytometer (BD Biosciences) with FACSDiva software.
To characterize peripheral immune cells, cells were labeled with anti-RT1B BV421 (1:200; clone OX-6, BD Biosciences), anti-CD3 PE (1:200; clone 1F4, BD Biosciences), anti-CD45R Pe-Cy7 (1:200; clone HIS24, Thermo Fisher Scientific), anti-CD11b APC (1:200; clone WT.5, BD Biosciences), anti-CD45 AL700 (1:200; clone OX-1, BD Biosciences), and anti-rat granulocyte biotin (1:200; clone His48, Thermo Fisher Scientific) followed by streptavidin PerCp-Cy5.5 (1:500; Thermo Fisher Scientific) in FACS buffer. Cells were washed and analyzed on a Cytek Aurora flow cytometer (CYTEK). Data were analyzed using FCS Express 6 (De Novo Software) and FlowJo X (FlowJo) software.
Cell sorting
Samples were prepared as described for flow cytometry, without the addition of antibody or dye labeling and sorted using an Aria II Cell Sorter (BD Biosciences) with a 100 μm pore size. Samples were gated for EGFP expression and run until 50,000 EGFP+ cells were collected. Cells were then resuspended in Qiazol (Qiagen) and stored at −80°C until processed.
RNA isolation, cDNA synthesis, and quantitative PCR
Total RNA was extracted using the protocol for fatty tissues from the RNeasy Handbook for Mini Kit (Qiagen). Single-stranded cDNA synthesis was performed with 200 ng of RNA input using the high-capacity cDNA Reverse Transcription Kit (Thermo Fisher Scientific), and samples were stored at −20°C until use. Quantitative PCR (qPCR) was performed using an Applied Biosystems ViiA7 PCR System (Thermo Fisher Scientific) with the following cycling parameters: 50°C for 2 min, 95°C for 10 min, followed by 40 cycles of 95°C for 15 s and 60°C for 1 min. Primers (Integrated DNA Technologies; Table 1) were designed using Primer3 software, and primer efficiency was determined through the use of serial dilutions. Samples were run in triplicate, cycle threshold (Ct) values for the gene of interest were normalized to the Ct for Gapdh (Δ-Ct), and relative data were determined by the ΔΔ-Ct method (Schmittgen and Livak, 2008).
Immunohistochemistry
Animals were deeply anesthetized with Fatal Plus (Vortech Pharmaceuticals) and transcardially perfused with PBS, 0.1 m, pH 7.4, followed by 4% paraformaldehyde (PFA; 4% in PBS), pH 7.2. Brains were removed and postfixed for 24 h in 4% PFA at 4°C, then kept in 30% sucrose at 4°C until fully submerged. Coronal sections (45 μm thick) were cut on a cryostat (model CM2050S, Leica) and directly mounted onto slides. Slide-mounted sections were washed in PBS, blocked with 5% normal goat serum (NGS) in PBS + 0.4% Triton X-100 (PBS-T) for 1 h, and incubated with anti-GFP (1:1000; catalog #ab13970, Abcam) and anti-Iba1 (1:1000; catalog #019–19 741, Wako) in 2% NGS in PBS-T overnight. The next day, slides were incubated with Alexa Fluor 488 (1:500; Thermo Fisher Scientific) and Alexa Fluor 594 (1:500; Thermo Fisher Scientific) in PBS-T for 2 h, washed and stained with Hoechst 33342 (1:3000; catalog #H3570, Thermo Fisher Scientific) for 10 min, and coverslipped with ProLong Diamond Antifade (Thermo Fisher Scientific).
Microscopy and colocalization analysis
Wide-field fluorescence images were captured on a Keyence BZ-X700 microscope using a 10× objective [0.45 numerical aperture (NA)] and 20× objective (0.75 NA) and BZ-X Viewer software. For colocalization analysis, single field-of-view images were taken at 20× magnification using 0.4 μm z-steps through the entire tissue thickness. Subsequent maximum intensity projections were used to quantify microglia as Iba1+ and EGFP+ using the cell counter plugin in Fiji (Schindelin et al., 2012).
Slice preparation and live imaging
The brain was rapidly dissected out from a P7 rat pup following decapitation and immediately placed in ice-cold artificial CSF (aCSF) containing (in mm) 125 NaCl, 2.5 KCl, 1 MgCl2, 1.25 NaH2PO4, 2 CaCl2, 25 NaHCO3, 25 glucose, and 75 sucrose, pH 7.4 (Dailey et al., 2013; Huang et al., 2018). Coronal sections (∼0.5 mm) were cut using a Zivic Brain Slicer Matrix on ice. A section was transferred to a MaTek glass bottom microwell dish (35 mm dish, no. 1.5 coverslip) containing room temperature aCSF (in mm: 125 NaCl, 2.5 KCl, 1 MgCl2, 1.25 NaH2PO4, 2 CaCl2, 25 NaHCO3, and 10 glucose, pH 7.4). Confocal fluorescent images using a 1 μm z-step across 10 μm of tissue for a single field of view were acquired once per minute for a total of 20 min with a Nikon A1 microscope equipped with a 488 laser using an Apo 60× Oil objective (1.4 NA). ATP (Sigma-Aldrich) was bath applied (1 mm in aCSF) after 4 min of baseline imaging. The motion of 10 microglial processes from five microglia was analyzed using the MTrackJ plugin (https://imagej.net/MTrackJ) for ImageJ (Meijering et al., 2012).
Intravital two-photon microscopy
Neonatal (P14) Iba1-EGFP+/+ rats and adult B6.129P-CX3CR1tm1Litt/J (CX3CR1gfp/+ mice; gift from Bogdan Stoica, Department of Anesthesiology, University of Maryland School of Medicine, Baltimore, MD) were anesthetized with ketamine (85 mg/kg) and xylazine (13 mg/kg), and maintained on a heating pad. A thin skull preparation was performed as previously described (Roth et al., 2014). A metal bracket was secured over the parietal lobe, and the skull bone was thinned to ∼30–60 μm. Intravital two-photon microscopy was performed using a two-photon microscope (SP5 II, Leica) equipped with a 20× water-dipping objective (1.0 NA), a PMT-ready Objective Inverter (LSM TECH), and a Coherent Chameleon Laser tuned to 880 nm for GFP (provided by Alan Faden, the University of Maryland Center for Shock Trauma and Anesthesiology Research, Baltimore, MD). 3D time-lapse movies were captured in z-stacks of 10–15 planes (step size, 3 μm; 3× zoom) at ∼30 s intervals. Image analysis was performed using Imaris (Oxford Instruments) and ImageJ.
Quantification and statistical analysis
Statistical analysis was performed using R (version 3.4.4; R Core Team, 2018) or GraphPad Prism 8. See Table 2 for details regarding specific data or comparisons (e.g., descriptive statistics, test used, n, which are referenced in text using superscript letters). Analyses were considered significant at p ≤ 0.05.
Summary of descriptive statistics and statistical analyses
Results
Generation of SD-Tg (Iba1-EGFP)Mmmc transgenic rats
We sought to generate a model in which EGFP was expressed under control of the endogenous Iba1 promoter without altering the endogenous Iba1 protein. To this end, the EGFP coding sequence and P2A linker sequence were inserted immediately following the translation start codon in the first exon of rat Iba1 and upstream of the remainder of the endogenous Iba1 gene (Fig. 1A). This results in the expression of both EGFP and Iba1 in a single mRNA transcript under control of the endogenous regulatory sequence of the Iba1 gene. Ribosomal skipping at the P2A sequence results in a modified EGFP that contains 17 aa of the P2A peptide at the C terminus and Iba1 as the translation products. For genotyping, we designed forward and reverse primers for PCR that spanned exon 1. The resulting PCR products confirmed the presence of the EGFP/P2A insertion in homozygous (EGFP+/+) and heterozygous (EGFP+/−) offspring, while the insert was absent in wild-type (EGFP−/−) littermates (Fig. 1B). To verify whether the EGFP/P2A insertion altered expression of the Iba1 gene, we first used Western blot to determine the presence of unspliced EGFP-P2A-Iba1 fusion proteins in cortical tissue homogenates. As expected anti-GFP antibody detected a band of ∼35 kDa, which corresponds to the EGFP protein with the 17 aa P2A peptide on the C terminus that was present in EGFP+/+ rats, but not in EGFP−/− rats. Higher-molecular-weight bands corresponding to EGFP-P2A-Iba1 fusion protein, which is predicted at ∼52 kDa, were not detected. We then quantified Iba1 protein and found no difference in Iba1 levels across genotypes, demonstrating that the expression of Iba1 protein in transgenic animals is comparable to endogenous Iba1 expression in WT rats (Fig. 1Da). Finally, we quantified Iba1 and EGFP mRNA by qPCR at both P7 and P60 to determine whether the gene expression varied with age. The mRNA levels of both Iba1 and eGFP were comparable at both ages (p = 0.08b for Iba1; p = 0.16c for EGFP; Fig. 1E), indicating that the transgene is robustly expressed into early adulthood.

Generation of Iba1-EGFP knock-in rat. A, Schematic of exon 1 of the Iba1 gene (top) and the EGFP-P2A insertion (bottom). The black bar indicates the transcription start site (ATG), and the gray region represents the protein-coding region of the exon. The EGFP (green) and P2A (red) sequences were inserted at the transcription start site of exon 1. B, Representative image of a genotyping gel showing the presence of two distinct bands. The lower band (334 bp) is the amplification of the wild-type allele, while the upper band (1114 bp) is the amplification of the EGFP-P2A-containing allele. C, Representative Western blot image for GAPDH protein (top band; red) and EGFP protein (bottom band; green). Lane M, Protein marker (various sizes labeled on the left); lane P, 30 ng of purified recombinant EGFP protein; lane −/−, 30 μg of total protein from cortical homogenates of EGFP−/− rats; lane +/+, 30 μg of total protein from cortical homogenates of EGFP+/+ rats. D, Quantification of Iba1 protein expression in wild-type, EGFP+/−, and EGFP+/+ littermates. E, qPCR quantification of Iba1 and EGFP transcripts in EGFP+/+ rats at various time points during development. Open symbols in D represent individual animal datapoints.
Flow cytometry validation of EGFP+ cells
To determine whether EGFP+ cells expressed markers commonly associated with microglia, we used flow cytometry to analyze the expression of CD45 and CD11b in cells acutely isolated from the brains of P7 EGFP+/+ or EGFP−/− (wild-type) littermates (Fig. 2A,B). In whole-brain homogenates, ∼9.8% of cells were EGFP+ from EGFP+/+ animals compared with 0.1% of cells from wild-type animals (Table 3). Furthermore, 95.3% of the EGFP+ cells were identified as CD11b+/CD45int, consistent with microglia-like patterns of expression (Fig. 2A, Table 3).
Iba1-EGFP Flow cytometry results

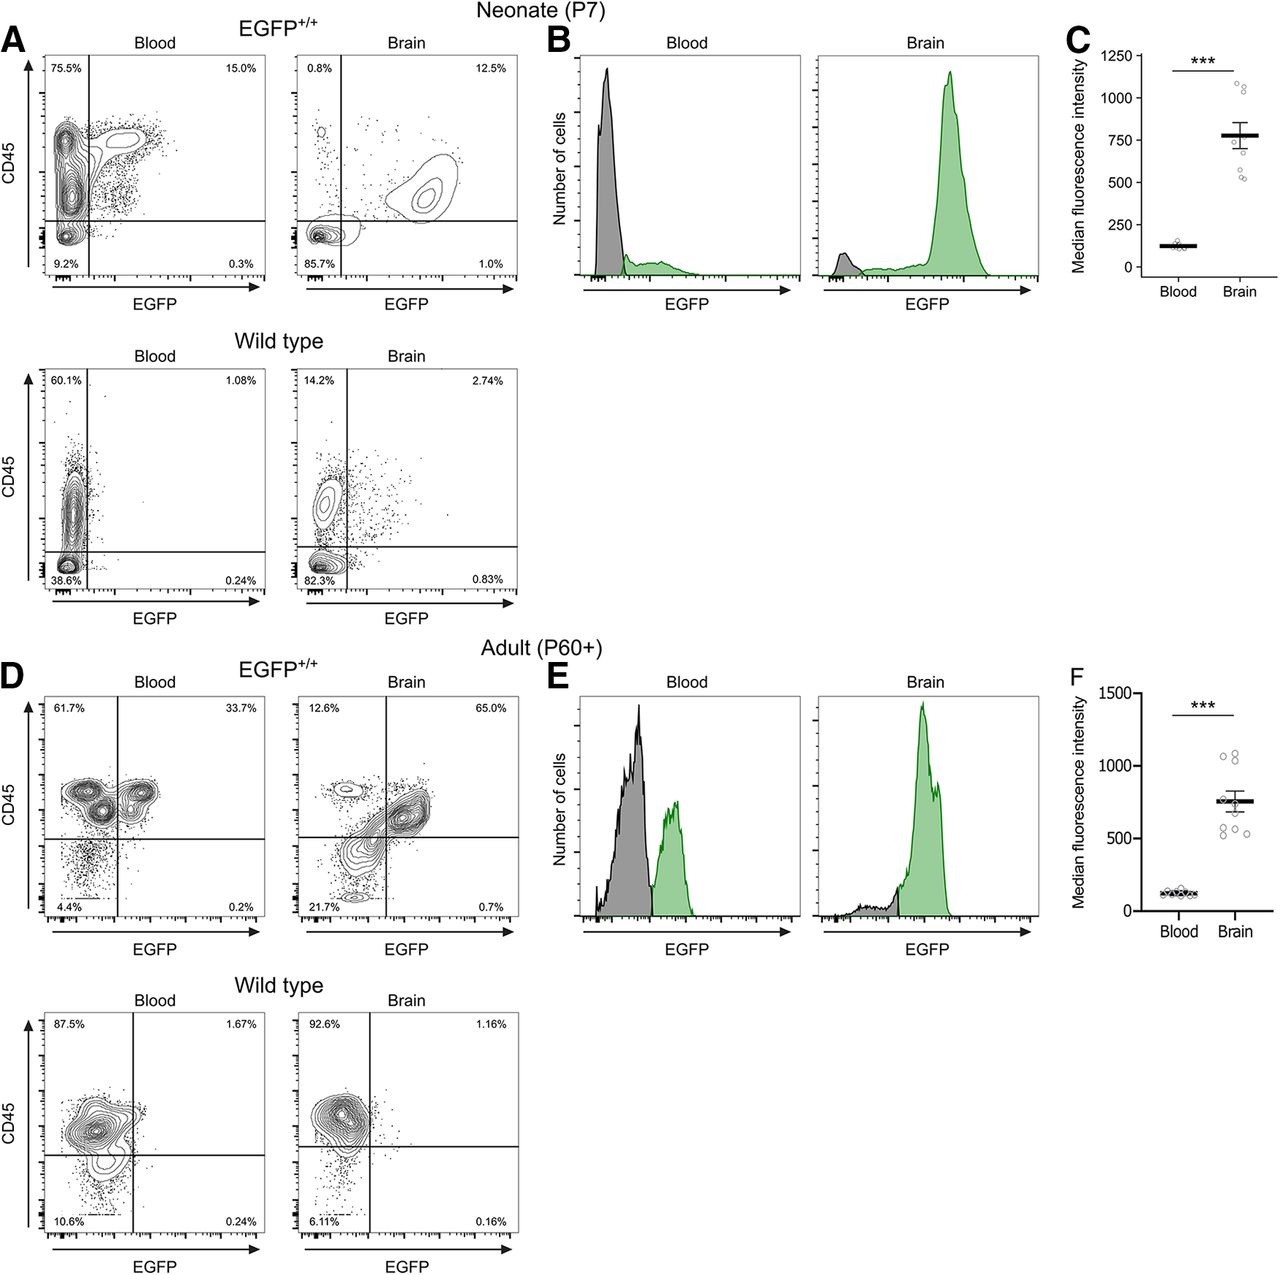
Flow cytometry validation of microglial Iba1-EGFP expression in neonates and adults. A, Brain cells isolated from either EGFP+/+ (top) or wild-type littermates (bottom) at P7 were gated as EGFP+ and analyzed for their expression as CD11b+/CD45int (right). Gated on forward scatter (FSC)/side scatter (SSC), singlets, live, CD45int, CD11b+. B, The same samples from A were reanalyzed, gated as CD11b+/CD45int (left) and analyzed for their expression as EGFP+ (right). In B and C, the black boxes indicate gates, and the percentage of cells within each gate are shown. C, Quantification of the median fluorescence intensity of EGFP+ cells isolated from heterozygous or homozygous littermates at P7. D, Brain cells isolated from either EGFP+/+ (top) or wild-type littermates (bottom) at P60 or later were gated as CD11b+/CD45int (left) and analyzed for their expression as EGFP+ (right). E, qPCR quantification of microglial genes (Iba1, CX3CR1) and nonmicroglial genes (Nes, Gfap, Olig2, NeuN) from EGFP+ sorted cells or whole-brain homogenates from EGFP+/+ animals at P7. E, Brain cells from adult EGFP+/+ and WT animals gated on CD11b+/CD45int were analyzed for their expression as EGFP+. Histogram reflects a shift in EGFP fluorescence intensity in adult microglia-like cells in the Iba1-EGFP rat (green) compared with WT control (gray). Contour lines in A, B, and D represent 95% of the data at 5% intervals. Black boxes in A, B, and D indicate gates, and the percentage of cells within each gate are shown. Bars in C represent the mean ± SEM. Bars in E represent the mean ± SD. Open circles in C represent individual animal datapoints. *p < 0.05; **p < 0.01; ***p < 0.001.
We then analyzed the data in reverse, first gating for CD11b+/CD45int cells and then by EGFP revealing that ∼10% of all cells were CD11b+/CD45int in EGFP+/+ animals similar to age-matched wild types (8.3% of cells). Further analysis of the CD11b+/CD45int fraction found that 94.9% were EGFP+ in EGFP+/+ compared with 0.7% in wild-type animals (Fig. 2B, Table 3). As the EGFP gene dosage may affect the relative fluorescence intensity between EGFP+/+ and EGFP+/− animals, we compared the median fluorescence intensity (MFI) of heterozygous and homozygous littermates at P7. Overall, the MFI values were not significantly different between the two genotypes (p = 0.1d; Fig. 2C). In adult rats (>P60), 94.8% of CD11b+/CD45int cells were EGFP+ in EGFP+/+ animals compared with 0.97% in age-matched wild types, consistent with our findings in neonates and demonstrating that transgene expression is robust and maintained into early adulthood (Fig. 2D, Table 3). Together, these data demonstrate that nearly all of the EGFP+ cells in the brain express microglial markers, and of all the possible microglial cells, the vast majority are EGFP+ in both neonates and adults.
To further verify the identity of EGFP+ cells as microglia, we isolated EGFP+ cells from EGFP+/+ animals by FACS and used PCR to compare the relative expression of microglia-enriched genes (Iba1, CX3CR1) and nonmicroglial genes (Nes, Gfap, Olig2, NeuN) between EGFP+ sorted cells and whole-brain homogenates from EGFP+/+ littermates. Both Iba1 (p = 0.008e) and CX3CR1 (p < 0.001f) were greatly enriched in the EGFP+ sorted cell population, while markers for progenitors (Nes; p = 0.02g), astrocytes (Gfap; p < 0.001h), oligodendrocytes (Olig2; p = 0.007i), and neurons (NeuN; p = 0.09j) had far lower expression in EGFP+ sorted cells compared with unsorted whole-brain homogenates (Fig. 2E). These data confirm EGFP expression is highly specific to microglia in the brain.
As both microglia and peripheral myeloid cells express Iba1, we compared EGFP expression in blood and brain samples from EGFP+/+ and wild-type neonates and adults using flow cytometry. We gated based on CD45 and EGFP expression and detected a distinct EGFP+ population in the blood of EGFP+/+ animals in both ages (Fig. 3A,D). EGFP+ cells in the blood were mostly CD45high, whereas in the brain, EGFP+ cells were CD45int; and directly comparing the fluorescence intensity between the two populations found that brain EGFP+ cells had a significantly greater MFI than EGFP+ cells in the blood at both ages [neonates, p < 0.001k (Fig. 3B,C); adults, p < 0.001l (Fig. 3E,F)].

Comparison of EGFP signal in blood and brain. A, Representative contour plots showing the gating strategy for median fluorescence intensity analysis in B and C. Cells were gated as EGFP+ and CD45+ in samples from blood (left) or brain (right) at P7 from either EGFP+/+ (top) or wild-type littermates (bottom). B, Representative histograms showing the distribution of EGFP fluorescence intensity of all CD45+ cells at P7 in the EGFP+/+ rat (green) compared with wild-type controls (gray) in the blood and brain. C, Quantification of median fluorescence intensity at P7. D, Representative contour plots showing the gating strategy for median fluorescence intensity analysis in E and F. Cells were gated as EGFP+ and CD45+ in samples from blood (left) or brain (right) in adults >P60 from either EGFP+/+ (top) or wild-type littermates (bottom). E, Representative histogram showing the distribution of EGFP+ fluorescence intensity of all CD45+ cells in the adult EGFP+/+ rat (green) compared with wild-type controls (gray) in the blood and brain. F, Quantification of median fluorescence intensity in adults at P60 or later. Contour lines in A represent 95% of the data at 5% intervals. Bars in C and F represent the mean ± SEM. Open circles represent individual animal datapoints.
Next, we examined EGFP expression in the spinal cord and dorsal root ganglion to determine the extent of EGFP expression in other neural tissues. We used flow cytometry to analyze the expression of CD45 and CD11b of acutely isolated cells from the spinal cord (Fig. 4A,B) and dorsal root ganglion (Fig. 4C,D) of P7 EGFP+/+ or wild-type littermates. In the spinal cord, ∼59.8% of cells were EGFP+ from EGFP+/+ animals compared with 0.2% of cells from wild-type animals (Tables 2, 4). Of the EGFP+ cells, 99.2% were identified as CD11b+/CD45+ (Fig. 4A, Table 3). In the dorsal root ganglion, 6.2% of cells were EGFP+ in EGFP+/+ animals (compared with 0.8% in wild-type animals), of which 97.6% were CD11b+/CD45+ (Fig. 4C, Table 4).
Iba1-EGFP Spinal cord and dorsal root ganglion flow cytometry results

Comparison of EGFP signal in spinal cord and dorsal root ganglion. A, Spinal cord cells isolated from either EGFP+/+ (top) or wild-type littermates (bottom) at P7 were gated as EGFP+ (left) and then gated as CD11b+/CD45+ (right). B, The same samples from A were reanalyzed, gated as CD11b+/CD45+ (left), then gated for EGFP expression (right). C, Dorsal root ganglion cells isolated from either EGFP+/+ (top) or wild-type littermates (bottom) at P7 were gated as EGFP+ (left) and then gated as CD11b+/CD45+ (right). D, The same samples from C were reanalyzed, gated as CD11b+/CD45+ (left), then gated for EGFP expression (right). Contour lines in A–C represent 95% of the data at 5% intervals. Black boxes in A–D indicate gates, and the percentage of cells within each gate are shown.
We again analyzed the data in reverse, first gating for CD11b+/CD45+ myeloid cells and then by EGFP. In the spinal cord, 73.9% of cells were CD11b+/CD45+ and 80.0% of those cells were EGFP+ (Fig. 4B, Table 4), while 18.3% of cells in the dorsal root ganglion were CD11b+/CD45+ with 32.4% of those cells being EGFP+ (Fig. 4D, Table 4).
To further characterize the CD45high hematopoietic cells (i.e., nonmicroglia cells) that express EGFP, we performed flow cytometry to analyze blood and brain samples from adults. In the brain, 52.2% of CD45high cells were EGFP+, while in the blood only 15.9% of CD45high cells were EGFP+ (p = 0.0072m; Fig. 5A). Other than microglia, myeloid cells/macrophages (CD45high/CD11b+/RT1B+) were the most prevalent EGFP-expressing cell type in the brain, comprising 61.7% of EGFP+ cells compared with 2.9% in the blood (p < 0.001p; Fig. 5B,C) and were consistent with known Iba1 expression in myeloid cells (Imai and Kohsaka, 2002; Ji et al., 2007; Jeong et al., 2013). Moreover, 85.4% of all myeloid cells/macrophages were EGFP+ in the brain, while 62.2% were EGFP+ in the blood (p = 0.016s; Fig. 5D). In the blood, EGFP+ cells were mostly monocytes (CD45high/CD11b+/His48+; 52.0%) and were much less prevalent in the brain (19.0%, p = 0.025q; Fig. 5B,C); of the total monocyte population, 40% were EGFP+ in the blood and 69.4% were EGFP+ in the brain (p = 0.062t; Fig. 5E). Both T cells (0.1% in blood vs 1.0% in braino) and B cells (11.8% in blood vs 0.1% in brainn) were far less frequent in the EGFP+ population of both tissue types. Finally, our antibody panel failed to label a population of EGFP+ cells (termed “other”; Fig. 5B,C) that represented 28.1% of cells in the blood and 15.0% in the brainr. Given the design of our antibody panel, these cells are most likely nonclassical monocytes as His48 mostly labels classical monocytes and neutrophils, and that would explain the increased prevalence of this population in the blood compared with the brain (Barnett-Vanes et al., 2016).

Flow cytometric characterization of EGFP+ peripheral cells in the adult. A, Quantification of the percentage of CD45high peripheral immune cells expressing EGFP in the brain compared with the blood. B, Graph depicting the population subsets of CD45high/EGFP+ cells in the brain and blood. (B cells = CD45high, CD45R+; T cells = CD45high, CD3+; myeloid cells/macrophages = CD45high, CD11b+, RT1B+; monocytes = CD45high, CD11b+, His48+; other = CD45high, additional immune cells not determined by this panel). C, Pie charts showing the relative distribution of CD45high/EGFP+ immune cells in the blood (left) and brain (right). D, Contour plots depicting the gating strategy for myeloid cells/macrophages in the brain (top) and blood (bottom). Quantification of the percentage of myeloid cells/macrophages expressing EGFP in the blood and brain. E, Contour plots showing the gating strategy for monocytes in the brain (top) and blood (bottom). Quantification of the percentage of monocytes expressing EGFP in the blood and brain. Contour lines (D, E) represent 95% of the data at 5% intervals. Bars represent the mean ± SD. Open circles and solid shapes represent individual animal datapoints. *p < 0.05; **p < 0.01; ***p < 0.001.
Histologic validation of EGFP+ cells
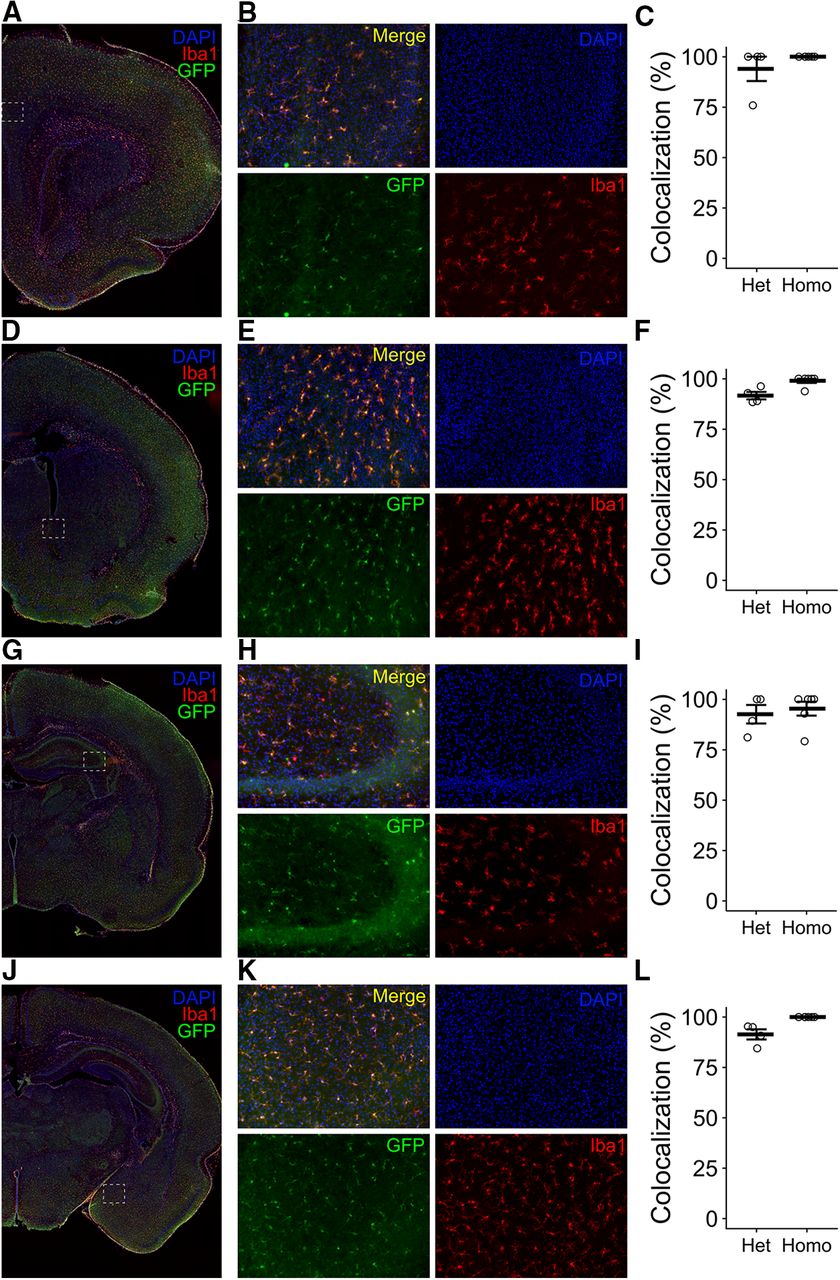
To determine whether EGFP expression could be reliably detected in all microglia throughout the brain, we used histology to assess the colocalization of Iba1 and GFP by immunolabeling for both proteins. We quantified microglia in several regions on P7, as follows: the prefrontal cortex (PFC; Fig. 6A–C), nucleus accumbens (NAc; Fig. 6D–F), hippocampus (Hipp; Fig. 6G–I), and amygdala (Amyg; Fig. 6J–L). We found that across all regions, >90% of all Iba1+ cells colabeled as GFP+ in EGFP+/− animals (93.97% in PFCu, 91.59% in NAcv, 92.59% in Hippw, 91.39% in Amygx) and ∼98% of Iba1+ cells were GFP+ in EGFP+/+ animals (100% in PFCu; 98.96% in NAcv; 95.34% in Hippw; 100% in Amygx).

Histologic validation of knock-in efficiency. A, D, G, J, Representative coronal images from EGFP+/− animals antibody labeled for Iba1 (red), GFP (green), and colabeled with DAPI (blue). White box shows the region analyzed for the prefrontal cortex (A–C), nucleus accumbens (D–F), hippocampus (G–I), and amygdala (J–L). B, E, H, K, Representative single-channel and merged images at 20× magnification. C, F, I, L, Quantification of the percentage of colocalization between GFP and Iba1 in heterozygous and homozygous animals. Bars represent the mean ± SEM. Open circles represent individual animal datapoints.
Ex vivo and in vivo imaging of EGFP+ cells
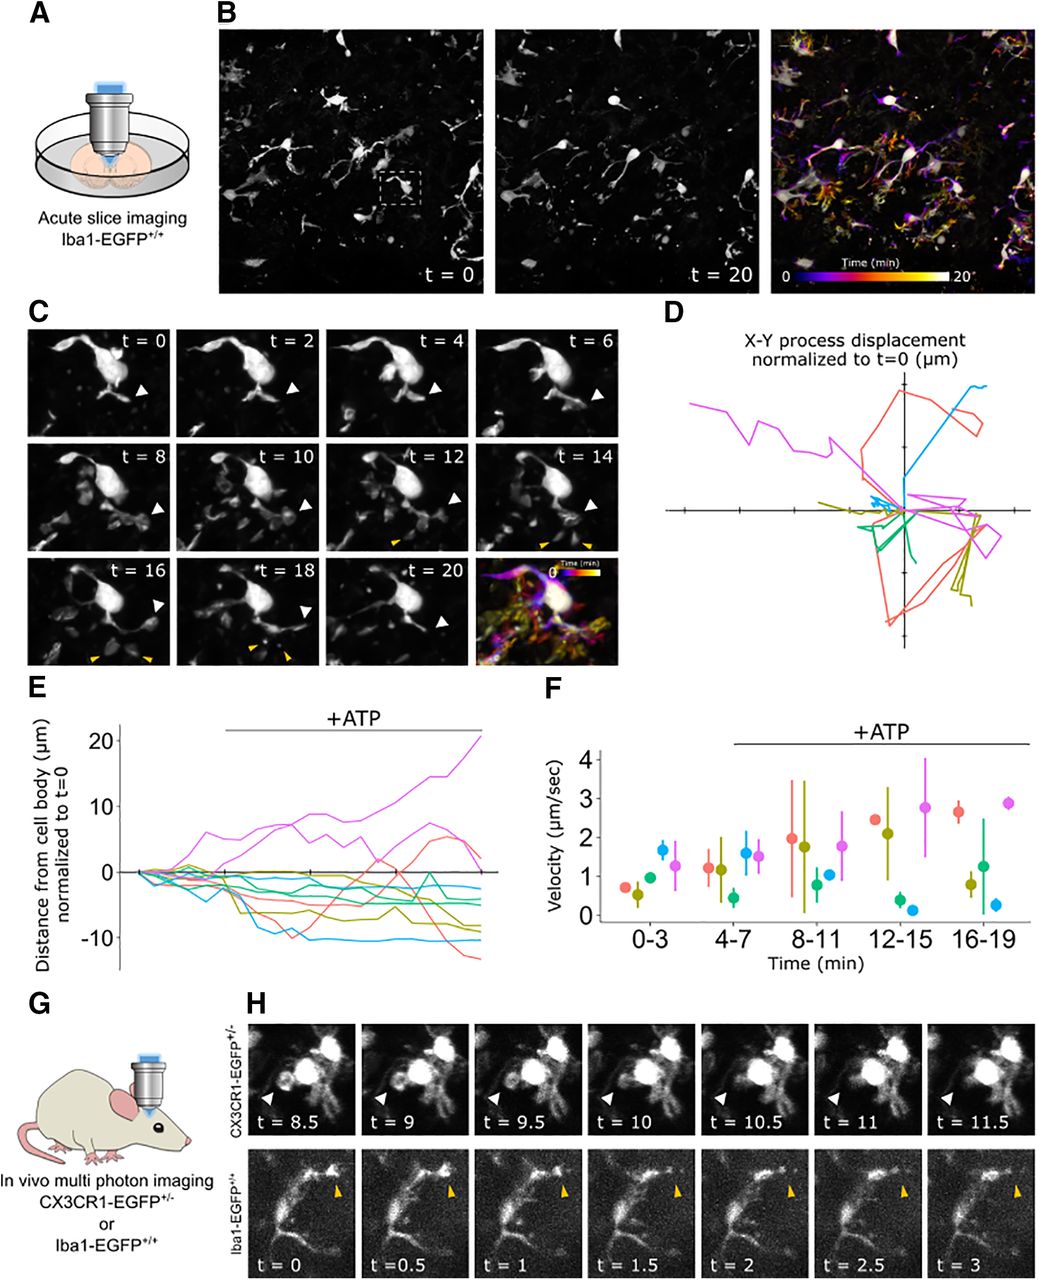
One of the most significant advantages of microglia reporter mice has been the ability to monitor microglia dynamics in real time. To determine whether the Iba1-EGFP rat was suitable for live imaging studies, we first used confocal microscopy to image EGFP+ cells in acute brain slices from P7 EGFP+/+ animals. We imaged for 4 min to measure microglia dynamics under baseline conditions, then applied 1 mm ATP to the bath solution for the remainder of the 20 min assay. The EGFP signal was sufficient to image multiple cells across a large field of view and track microglial process dynamics over time (Fig. 7A,B, Movie 1). Moreover, we were able to identify filopodia formation in response to ATP application (Fig. 7C) and quantify measures of microglia movement such as x–y displacement (Fig. 7D), process retraction/extension (Fig. 7E), and process velocity (Fig. 7F).

Ex vivo and in vivo time-lapse imaging of EGFP+ microglia. A, Experimental setup; an acute brain slice was prepared from an Iba1-EGFP+/+ rat pup and placed under a confocal microscope for imaging. B, Representative field of view of microglia from an EGFP+/+ animal at the start (0 min; left) and end (20 min; middle) of the assay. The same field of view is pseudocolored to represent the microglia position throughout the duration of the assay (right). The white box shows the cell represented in C. C, Depiction of a single microglia at 2 min intervals throughout the assay with the corresponding time pseudocolor image. White arrows track a single major process through time. Yellow arrows indicate process bifurcations that extend and retract in response to ATP application, which was bath applied at a concentration of 1 mm in aCSF after 4 min of baseline imaging. D, Quantification of microglia process displacement throughout the duration of the assay. The x- and y-axes represent the x- and y-coordinates relative to the microscope image. Individual traces show process movement from t = 0 (x/y origin) to t = 20. Axis tick marks represent 5 μm. E, Quantification of the microglia process retraction and extension throughout the duration of the assay. The x-axis tick marks represent 5 min intervals. F, Quantification of the microglia process velocity throughout the duration of the assay. G, Experimental setup; an anesthetized Iba1-EGFP+/+ rat or CX3CR1-GFP+/− mouse was head fixed for two-photon imaging through the skull. H, Depiction of a single microglia from a CX3CR1-EGFP+/− mouse (top) and an Ib1-EGFP+/+ rat (bottom) imaged in vivo with two-photon microscopy at ∼30 s intervals. White arrows track the internalization of a phagocytic cup and yellow arrows track the retraction of a microglial process. In C, D, and E, each color represents a different cell; same color traces represent different processes from the same cell. In D and E, black bar indicates the time and duration of ATP application. In F, data are represented as the mean ± range.
Time-lapse video of EGFP+ microglia in acute slices. Representative field of view of microglia from an EGFP+/+ animal. Confocal z-stacks were acquired in 1 min intervals. ATP (1 mm in aCSF) was bath applied after the fourth frame, as denoted by “+ATP” in the video. Scale bar, 20 μm.
To determine whether this model is equally suitable for in vivo studies, we used multiphoton imaging to visualize microglia dynamics through a thinned skull preparation in P14 Iba1-EGFP+/+ rats. In parallel and as a positive control, we used the same procedure to image adult CX3CR1-EGFP+/− mice, which are widely used to study microglia in vivo (Jung et al., 2000; Guttenplan and Liddelow, 2019; Moseman et al., 2020). Though CX3CR1-EGFP+/− microglia exhibited brighter fluorescence, Iba1-EGFP+/+ microglia were dynamic from frame to frame (Fig. 7H), matching the activity observed in the CX3CR1-EGFP mice.
Discussion
Described here is a novel transgenic rat, SD-Tg(Iba1-EGFP)Mmmc, that leverages EGFP expression under the control of the Iba1 promoter. Utilization of a 2A self-splicing peptide as a linker between the EGFP and Iba1 coding sequence expressed in series from the same gene locus enables the expression of EGFP with the same specificity, timing, and abundance of endogenous Iba1. Cleavage at the P2A peptide in particular has been shown to be highly efficient, both in vitro and in vivo, and in mice <10% of translational products are uncleaved fusion protein (Kim et al., 2011; Liu et al., 2017). Our SD-Tg(Iba1-EGFP)Mmmc rats show the same high-efficiency splicing, as we were unable to detect any EGFP-P2A-Iba1 fusion protein using Western blotting. This system also preserves endogenous levels of Iba1 protein in our transgenic rats. Using a combination of flow cytometry, PCR, and immunohistochemistry, we show that EGFP expression faithfully identifies microglia in the brain. We further demonstrate the utility of this model in expanding the repertoire of microglia techniques in the rat, by live imaging microglia process motility in acute slice and in vivo preparations.
Iba1 protein, while traditionally held as the “gold standard” for identifying microglia in the brain, is also expressed by a variety of monocytes/macrophages throughout the body and is robustly expressed in the spermatids of the testis (Köhler, 2007). While we did not perform a comprehensive analysis across tissue types, in the brains of our transgenic model EGFP expression was almost entirely limited to microglia as >95% of EGFP+ cells colabeled as CD11b+/CD45int by flow cytometry and between 95% and 100% of EGFP+ cells colabeled as Iba1+ by histology depending on genotype. Moreover, EGFP expression was robust in both neonates and adults, demonstrating that the transgene is expressed early and is stable into early adulthood. By using flow cytometry, we detected EGFP+ cells in the blood and a small population of EGFP+ nonmicroglial cells in the brain. EGFP+ cells in the blood were largely monocytes, while nonmicroglial EGFP+ cells in the brain were largely myeloid cells/macrophages. A significantly larger percentage of myeloid cells/macrophages expressed EGFP in the brain compared with the blood, which is consistent with an upregulation of Iba1 in myeloid cells on entering the brain and establishing tissue residence (Imai and Kohsaka, 2002; Kishimoto et al., 2019; Swanson et al., 2020). Moreover, the percentage of monocytes expressing EGFP was not different between the blood and brain, which is expected in a naive, nonactivated state where circulating monocytes are not actively recruited to the brain.
Outside of the brain, we were able to detect EGFP expression in other neural tissues, for example the spinal cord and dorsal root ganglion. The spinal cord was enriched with EGFP+ cells, whereas the dorsal root ganglion had far fewer EGFP+ cells, which is to be expected given the distributions of microglia and macrophages in CNS and peripheral nervous system tissue, respectively (Xuan et al., 2019; Kolter et al., 2020). In both tissues, the vast majority of EGFP+ cells were CD11b+/CD45+, further demonstrating that EGFP expression is highly specific to select immune cell populations.
The SD-Tg(Iba1-EGFP) rat that we describe here presents several significant advancements over traditional methods. First, endogenous fluorescent reporters greatly facilitate the analysis and purification of Iba1+ cells, without the need for multiple antibody-labeling steps or complicated antibody panels. By minimizing tissue processing, microglia can be quickly isolated from the brain and analyzed by flow cytometry or FACS, and from much smaller starting volumes or brain regions. The ability to use FACS to sort and then sequence single-cell RNA using microglia from genetically modified mice expressing EGFP has considerably expanded our understanding of these critical cells in the mature and developing brain and in response to disease or injury (Hammond et al., 2019; Li et al., 2019). To date, this level of analysis has been out of reach for researchers using the rat model.
Second, endogenous reporters drastically improve the quality and capabilities of both live and ex vivo imaging studies. Compared with previous methodology, which largely relied on the application of fluorescent labels that bind to microglia membrane receptors (e.g., ib4 labeling), the GFP signal in this rat acts as a cell fill, which allows detailed imaging of microglia processes and dynamics over time. This can be exploited for multiple purposes, including imaging of microglia motility in acute slices, as was done here. There is also the potential for in vivo imaging for longitudinal studies of particular brain regions after stroke, traumatic brain injury (TBI), or other manipulations, as was done in the mouse (Pernici et al., 2019), and is now feasible in the rat, as demonstrated here. Given the importance of microglia function during early brain development (Frost and Schafer, 2016), the larger size of rats may allow for in vivo imaging during developmental ages that would not be feasible in mice. Last, the celebrated and impactful observations that microglia can engulf microstructures such as synapses and thereby prune them to sculpt neural circuit development, was achieved with the use of a mouse model in which microglia expressed GFP (Schafer and Stevens, 2013). This transformative finding can now be corroborated and expanded on in the rat model.
Third, given the fidelity of EGFP expression in blood monocytes and macrophages, this rat may be beneficial for studying immune responses in models of ischemic stroke, infection, or TBI where peripheral monocytes infiltrate the brain (Yang et al., 2019). Iba1 is a marker of peripheral tissue-resident macrophages, so using this rat may be useful in studying an array of other myeloid cell-driven responses throughout the body (Wijesundera et al., 2013; Suenaga et al., 2016; Ma et al., 2017). A further hidden benefit of this feature is the ability to screen animals for EGFP expression in the brain by first screening the blood. Although brain EGFP expression was higher than that in blood, the blood CD45 compartment still showed a one-log shift in EGFP expression, indicating a potential for flow cytometric analysis of the blood as a screening tool for transgene positivity. Our recommended panel for blood screening (Fig. 3A,D) would include only a CD45 antibody and require analysis of only two fluorescent channels, making this screening adaptable to most, if not all, flow cytometers. We found that at P7 and in adults, Iba1-EGFP+ cells are present in the blood and comparable to expression in the brain.
In summary, we report here the generation of a novel transgenic rat, SD-Tg(Iba1-EGFP)Mmmc, in which microglia and some peripheral immune cells express EGFP protein in sufficient quantity to allow for flow sorting and FACS, and in vivo and ex vivo visualization. The rat has long been a favored animal model in neuroscience, but the inability to readily genetically modify them has diminished use over the past 2 decades. With the advent of CRISPR technology, this is likely to change, and we offer this model as one such example of the changes to come.
Acknowledgments
Acknowledgements: We thank the Confocal Microscopy Core Facility at the University of Maryland School of Medicine for use of confocal microscopy. We also thank the University of Maryland Marlene and Stewart Greenebaum Comprehensive Cancer Center Flow Cytometry Shared Service for flow cytometry analyses.
Footnotes
The authors declare no competing financial interests.
This research was funded by the Dean’s Office, University of Maryland School of Medicine; and by Department of Health and Human Services | National Institutes of Health National Institute of Mental Health Grants R01-MH-52716 and R01-MH-091424, National Institute on Drug Abuse Grant R01-DA-039062, and Eunice Kennedy Shriver National Institute of Child Health and Human Development Grant P01-HD-085928 to M.M.M.
This is an open-access article distributed under the terms of the Creative Commons Attribution 4.0 International license, which permits unrestricted use, distribution and reproduction in any medium provided that the original work is properly attributed.
References
In this issue


