

Article Figures & Data
Figures
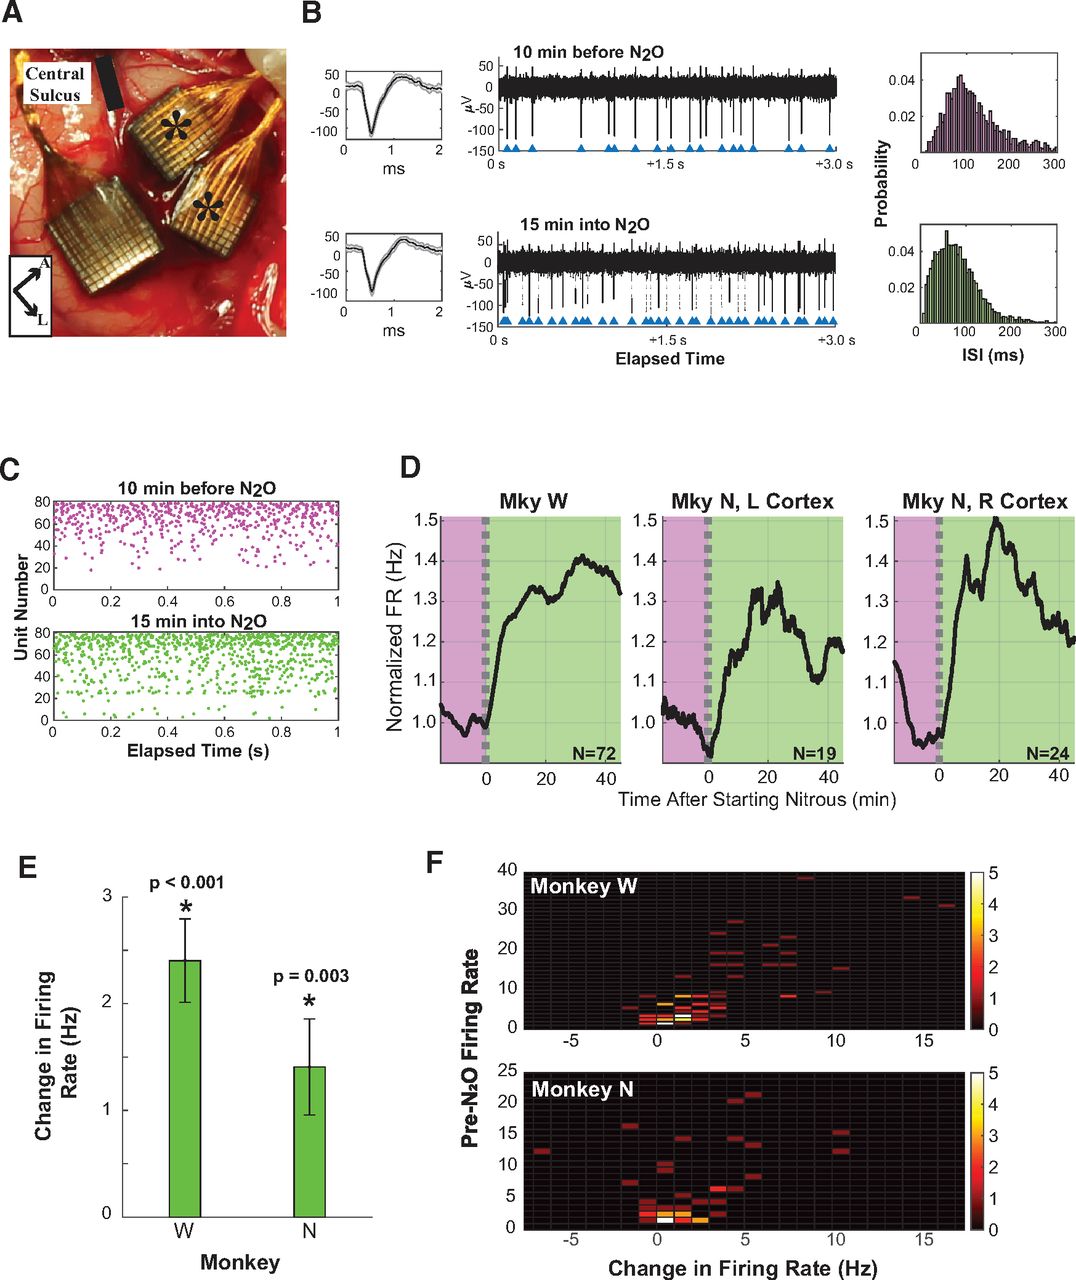
- Figure 1.
The influence of nitrous oxide on spiking rate. A, Image of the implanted arrays in primary motor cortex. Central sulcus is indicated with a solid black line, and asterisks denote the split motor arrays used in this analysis. The sensory array was not analyzed. The legend at the bottom indicates the anterior direction (A) and the lateral direction (L). B, The single-unit insets on the left show the mean (in black) and SD (in gray) for spike waveforms from 15 to 5 min before N2O initiation (top) and from 10 to 20 min after N2O initiation (bottom), and indicate waveform stability before and during N2O. The y-axis of the inset is reported in microvolts. In the middle panel, the raw data from channel 25 shows discriminated single units at 10 min before N2O administration (top) and 15 min after beginning continuous N2O administration (bottom). The raw data depict increased spiking rate for this channel. The blue triangles indicate the time of an action potential. On the right, spike-interval histograms show the distribution of the interspike interval of the period 10–20 min before N2O (top, magenta) and 10–20 min after N2O (bottom, green). The area of histograms sums to unity. C, The 1 s raster of Monkey W plot for 1 min before (pre-N2O, purple) and 15 min after (green) the start of N2O administration is given to illustrate representative results. D, The trend of spiking rate is depicted for each monkey for pre-N2O state (purple region) and continuous N2O administration (green region). The spiking rate is normalized by the baseline firing rate before N2O administration. The pre-N2O baseline firing rate was 8.1 Hz for Monkey W, 4.7 Hz for the left cortex of Monkey N, and 6.4 Hz for the right cortex of Monkey N. The number of sorted multiunits for each day, N, is indicated with each subplot. The dashed lines indicate when N2O was initiated. E, The bar plot depicts the change in spiking rate when combining both days for Monkey W and Monkey N. There is a statistically significant increase in spiking rate for both monkeys, as indicated by the asterisk (p < 0.001 for Monkey W and p = 0.003 for Monkey N). F, The two-dimensional histograms illustrate the number of multiunits with the change in firing rate during N2O (on the x-axis) and the pre-N2O firing rate (on the y-axis). The actual number of multiunits is color coded with the legend to the right of the panel. For both Monkey W (top) and Monkey N (bottom), the histogram is shifted to the right.
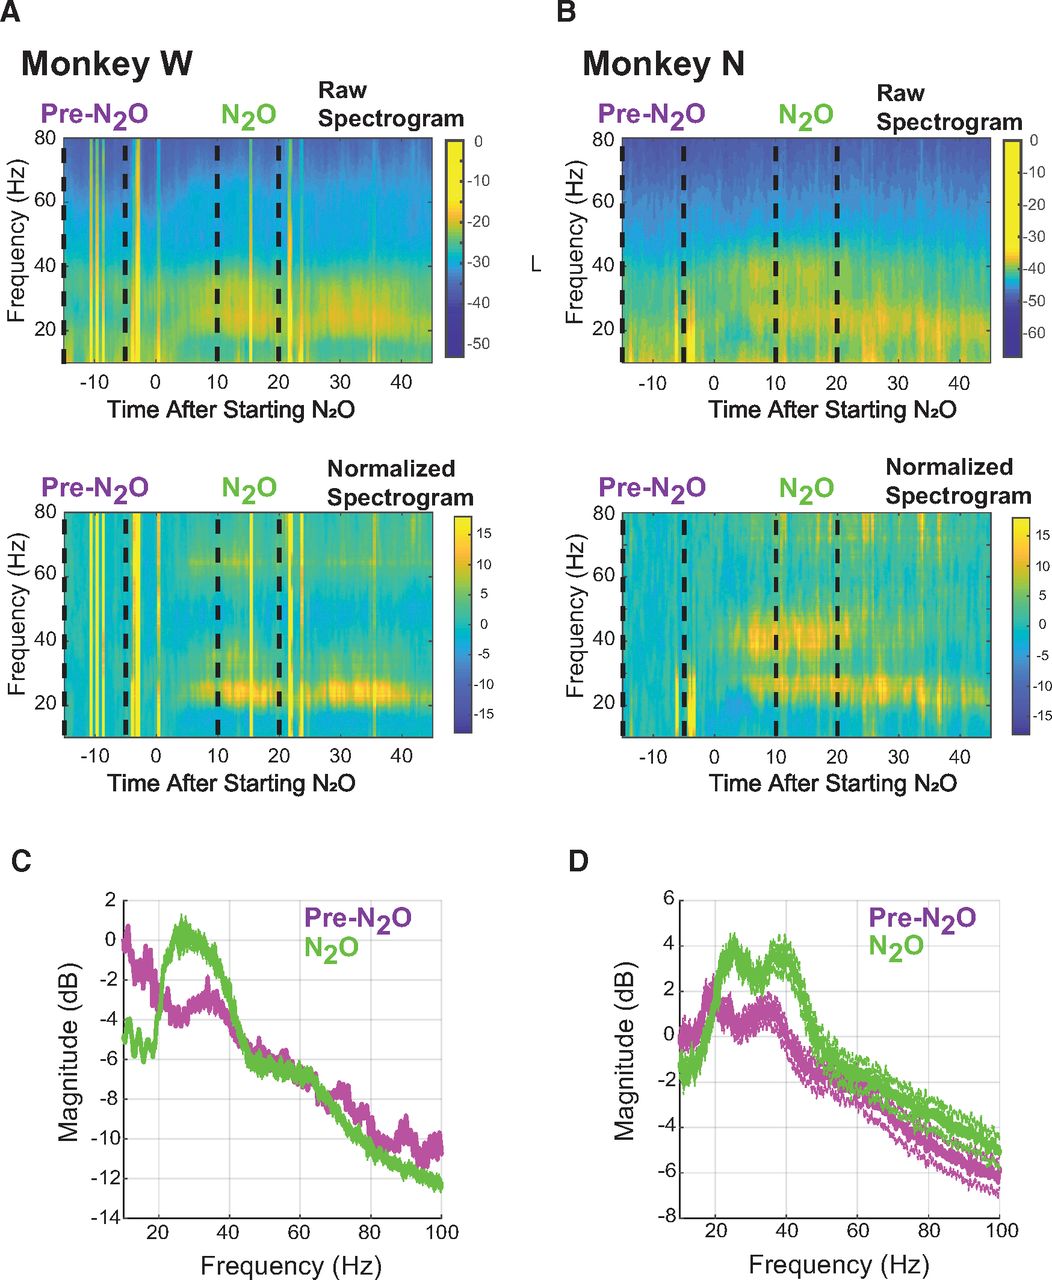
- Figure 2.
Increased high-frequency power during nitrous oxide. A, B, Averaged spectrograms for 55 channels in Monkey W (A) and for 21 channels of the right cortex implant in Monkey N (B). The raw spectrograms for each monkey are presented in the top panels of A and B. The bottom panels depict spectrograms normalized by the average spectral content in the pre-N2O period. The vertical lines represent an artifact. C, D, The corresponding averaged power spectrum from 15 to 5 min before N2O (purple) and 10–20 min into N2O administration for Monkey W (C) and Monkey N (D). SEM is displayed with dashed lines. To remove the effects of pink noise, the power spectra in C and D are normalized by 1/f.
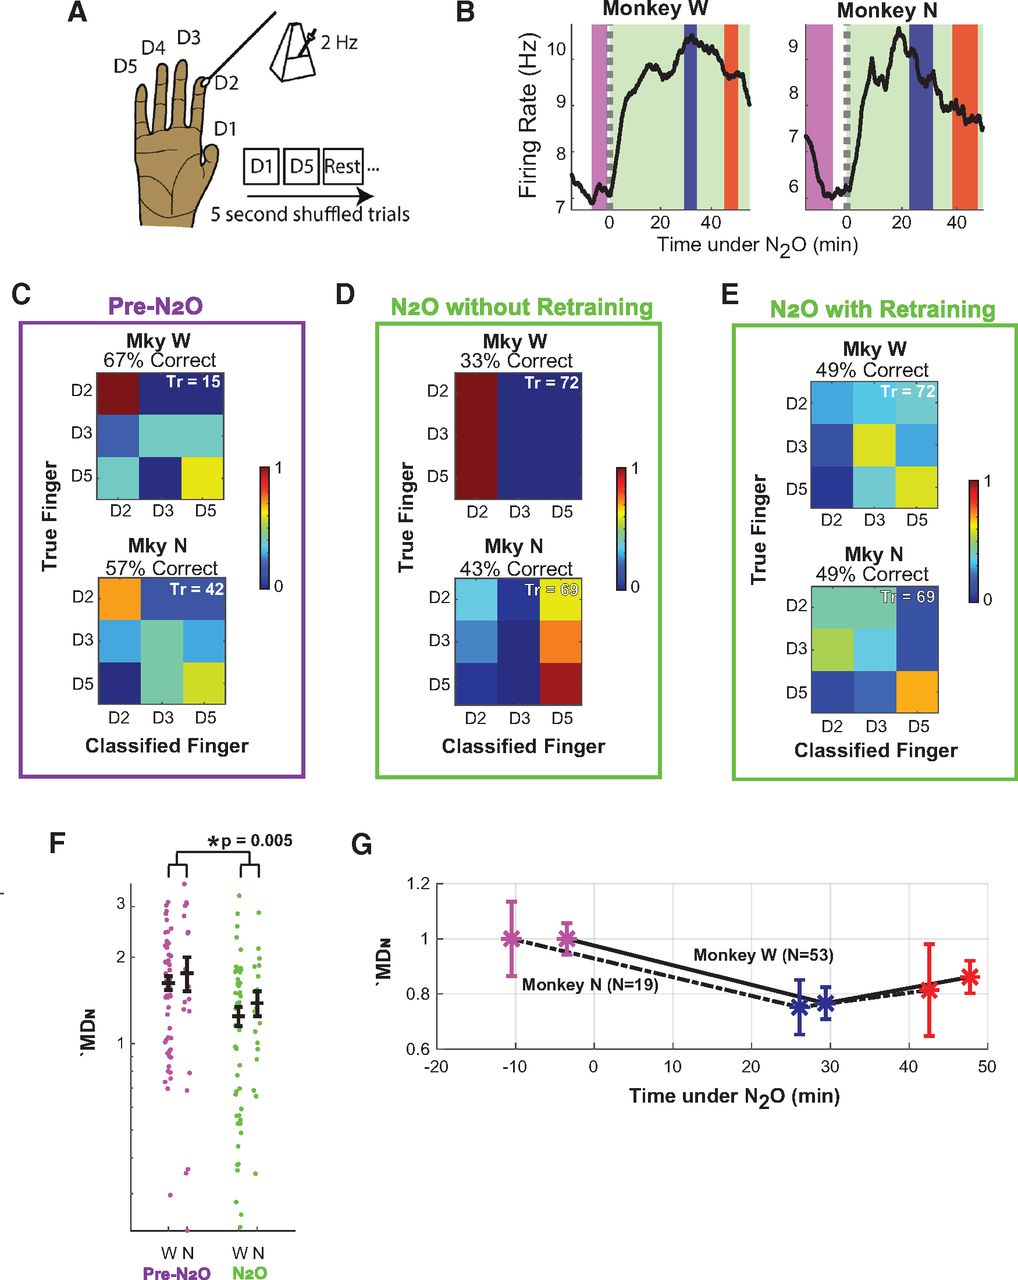
- Figure 3.
Transient degradation of somatosensory information in motor cortex. A, The experimental setup consisted of random stimulation of individual fingers at 2 Hz strokes in trials of 5 s duration. B, Trends of sorted multiunit firing rate for each monkey. The shaded regions highlight the times when fingers were decoded to compare performance in pre-N2O state (purple) and early (blue) and late (red) N2O administration. C, Confusion plots for each monkey illustrate performance of the Naive Bayes classifier when classifying finger brushings in the pre-N2O state. The vertical axis is the true finger brushed while the horizontal axis is the decoded finger. The percentage correct is given above each respective plot. Tr, Number of trials classified. The insert to the right of the confusion plots is the legend. D, Confusion plot during N2O (combined early and late brushing sessions) when the classifier is trained using data from the pre-N2O finger-brushing session. E, Confusion plot during N2O (combined early and late sessions) when training the classifier on the current session (early and late) using leave-one-out cross-validation. F, The MDN for all multiunits in the pre-N2O (purple) and N2O (green) brushing sessions. The MDN of multiunits during N2O sessions was averaged for both the early and late sessions. W denotes Monkey W, and N denotes Monkey N. Each filled circle represents one multiunit. The horizontal bar (in black) and error bars represent the mean and SEM. The asterisk (*) denotes statistical significance. The y-axis is in log scale to better visualize the data. G, The mean modulation depths for the pre-N2O (purple), early N2O (blue), and late N2O (red) finger-brushing sessions. The asterisks and error bars indicate the mean and SEM. The solid line denotes Monkey W, and the dashed line denotes Monkey N. Panel A is adapted and reprinted with permission from Schroeder et al. (2016).
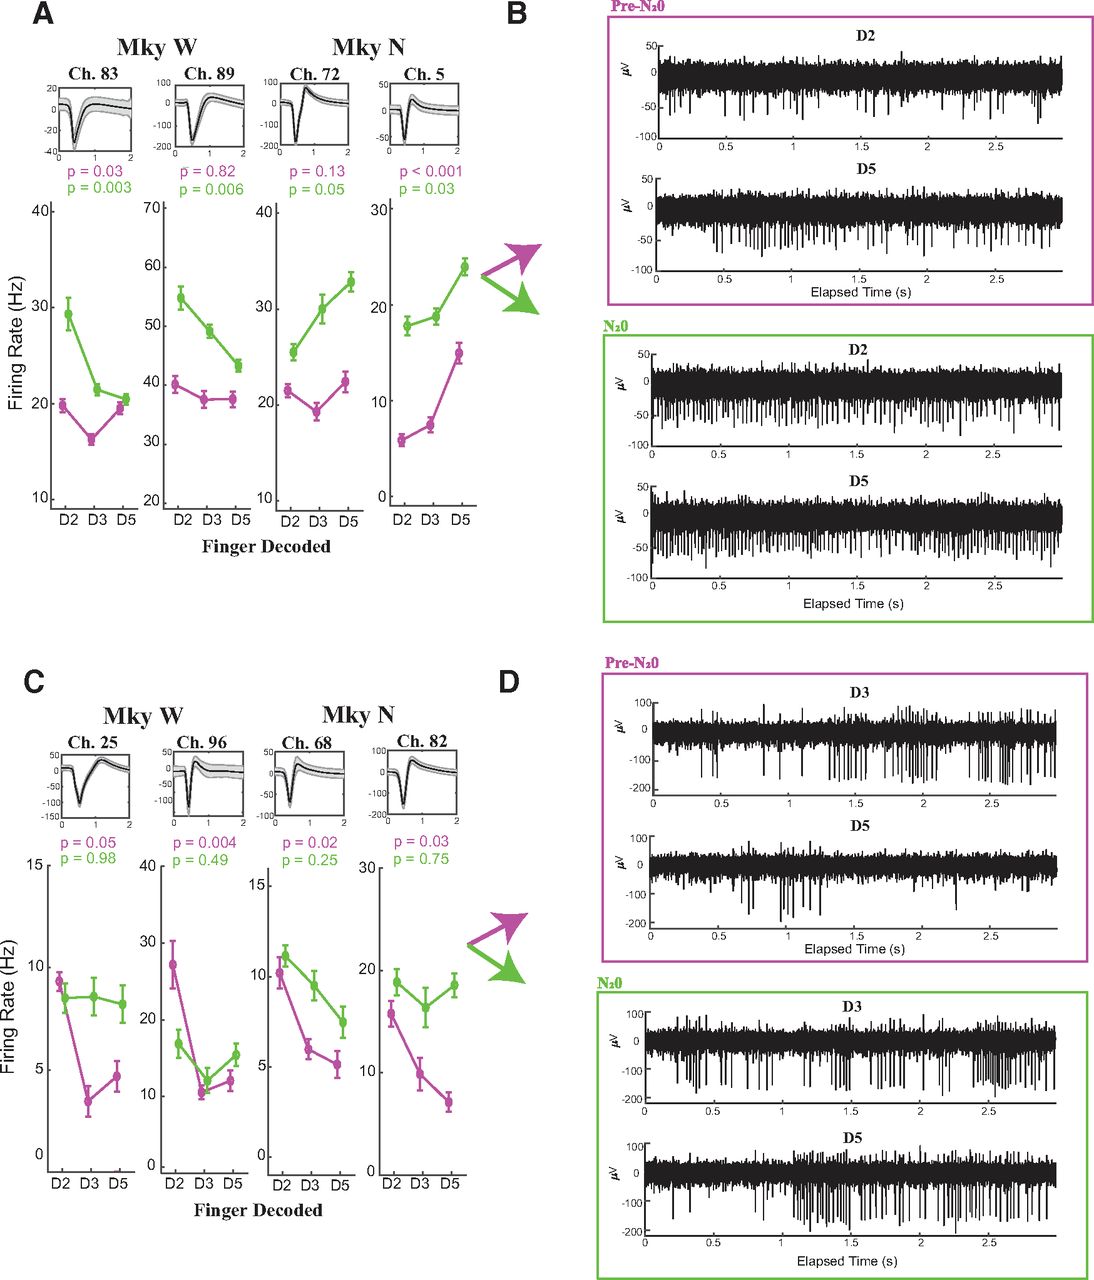
- Figure 4.
Discriminated single-unit tuning curves. A, Tuning curves for four modulated (ANOVA, with α < 0.1), discriminated single units during N2O administration. Single units are presented on the left for Monkey W and on the right for Monkey N. Each single unit is labeled with the channel on the array, the average waveform tracing (black line, mean; shaded gray, SD), and the tuning curve. The tuning curve depicts the mean firing rate of the single unit as a function of the finger brushed both in the pre-N2O period (purple) and during N2O (green). The error bars denote the SEM. The p values calculated with one-way ANOVA are given for both the pre-N2O and N2O tuning curves. B, Raw voltage tracings for the modulated discriminated single unit in channel 5 for Monkey N in the pre-N2O (purple) and N2O (green) periods. In each pane, the top tracing resulted when the second digit (D2) was brushed and the bottom plot resulted when the fifth digit (D5) was brushed. The elapsed time is relative to 10 min before beginning N2O. C, Four discriminated single units that were originally modulated (ANOVA, with α < 0.1) in the pre-N2O period but lost modulation during N2O administration. D, Raw voltage tracings illustrating a typical finger-brushing trial for channel 82 in Monkey N. The elapsed time is relative to 15 min after beginning N2O.
- Figure 5.
Remaining discriminated single-unit tuning curves. A, B, Monkey W (A) and Monkey N (B). The tuning curve depicts the mean firing rate of the single unit as a function of the finger brushed both in the pre-N2O period (purple) and during N2O (green). The error bars denote the SEM.


In this issue


