

Article Figures & Data
Figures
- Figure 1.
Reporter expression pattern in BRS3-IRES-Cre mice. A, Schematic of the BRS3-IRES-Cre (top) and BRS3-CreER (bottom) alleles. The three exons are numbered with BRS3 coding sequences in black, untranslated regions in white, IRES in blue, T2A in red (with cleavage point indicated by an arrow), Cre in orange, and GFP in green. B, Reporter expression in coronal sections from 5-month-old male BRS3-IRES-Cre;Ai14 mice at the indicated level from bregma. Labels in yellow denote reporter detected in BRS3-IRES-Cre but not BRS3-CreER mice and white labels are sites expressing reporter in both lines. Arc, Arcuate hypothalamic nucleus; DMH, dorsomedial hypothalamic nucleus. The EP and SNR fluorescence is from fibers; the rest are from cell bodies. C, D, Striatum (C) and hippocampus (D) at higher magnification. CA1, field CA1; CA3, field CA3.
- Figure 2.
Current compared with lineage Brs3 reporter expression. A, BRS3-CreER;Ai14 and BRS3-IRES-Cre;Ai14 (3- to 5-month-old) mice were injected unilaterally with AAV1-CAG-FLEX-EGFP carrying Cre-dependent GFP. The presence of tdTomato indicates either prior or current Cre activity, while GFP indicates Cre activity at the time of virus injection/tamoxifen treatment, 2 weeks before being killed. B–D, DMH (B), striatum (C), and hippocampus (D). Bregma levels are indicated.
- Figure 3.
BRS3-IRES-Cre-driven reporter expression in young mice. tdTomato reporter expression in BRS3-IRES-Cre;Ai14 mice at P1 (top row) and P23 (bottom row). Scale bar, 200 μm. Bregma levels are indicated. 3V, Third ventricle; fi, fimbria; Cb, cerebellum; AQ, cerebral aqueduct; scp, superior cerebellar peduncles; LPB, lateral parabrachial nucleus; MPB, medial parabrachial nucleus.
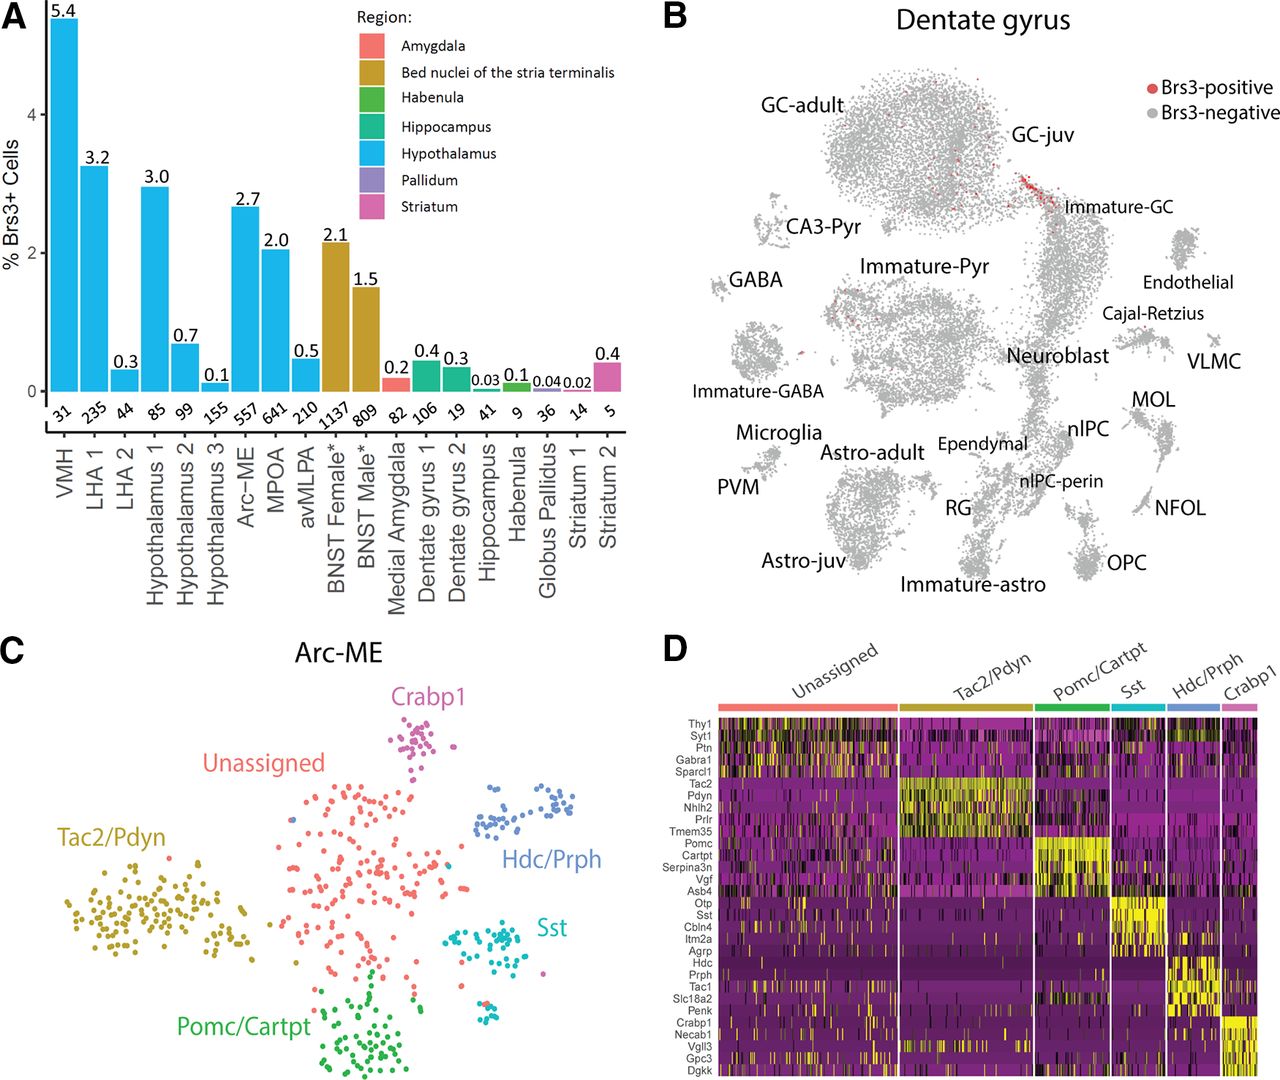
- Figure 4.
Brs3 expression in scRNA sequence datasets. A, Percentage of neurons expressing Brs3 in datasets with ≥5 Brs3-positive cells (Extended Data Fig. 4-1, lists of datasets with fewer Brs3-positive cells). The number of detected Brs3-expressing cells is indicated below each bar. An *Total cells, not just neurons. Data are from the following, in order: GSE143818, GSE125065, GSE130597, GSE74672, GSE132355 GSE87544, GSE93374, GSE113576, GSE149344 GSE126836, GSE126836, GSE124061, GSE104323, GSE95315, GSE116470, GSE146983, GSE116470, GSE116470, and GSE82187. B, Dentate gyrus Brs3 expression from http://linnarssonlab.org/dentate/ (Hochgerner et al., 2018). C, t-SNE plot of the Brs3-expressing Arc-ME neurons. D, Heatmap of expression of the top five enriched genes in each cluster. The Brs3 clusters correspond to the original clusters as follows: Hdc/Prph, n01 and n02; Tac2/Pdyn, n20; Pomc/Cartpt, n15 > n14; Crabp1, n26; and Sst, n23 > n12, and n13.
- Figure 5.
Brs3-expressing neurons in the lateral parabrachial nucleus project axons to multiple forebrain regions. AAV1-DIO-YFP and AAV1-DIO-synaptophysin:mCherry were coinjected into the PBN of BRS3-IRES-Cre mice. Several weeks later mice were perfused, sectioned, and then sections throughout the brain were treated with antibodies against YFP and DsRed to detect expression. Yellow reveals regions where both fluorescent proteins are present in cell bodies and terminals, whereas only green (e.g., VTA) reveals fibers of passage. A, Diagram showing injection site. B–D, viral expression at three bregma levels of the PBN. E–M, Fluorescent fibers in preoptic area (E); paraventricular nucleus (F); lateral hypothalamus (G); central nucleus of the amygdala (H); dorsal medial hypothalamus (I); intermediodorsal thalamus (J); parasubthalamic nucleus (K); ventral tegmental nucleus (L); and dorsal raphe (M). Bregma levels are indicated by numbers.
- Figure 6.
Metabolic phenotype of BRS3-IRES-Cre mice. A, Effect of a high-fat diet in male BRS3-IRES-Cre and littermate control mice (n = 8/group) on body weight, fat mass, lean mass, food intake, and energy expenditure determined by mass balance (Ravussin et al., 2013). Data are the mean ± SEM; *adjusted p < 0.05 from two-way ANOVA (Extended Data Fig. 6-1, with Šídák's multiple-comparisons test). B–D, Baseline core body temperature (B), effect of MK-5046 (10 mg/kg, i.p., given at onset of the dark cycle in 5 h fasted mice) on food intake (C), and effect of MK-5046 (10 mg/kg, i.p., at 10:00 A.M. in overnight-fasted mice) on body temperature (D). E, Tb changes from baseline (−150 to −30 min) to 60–180 min and 60–120 min after dosing in a crossover design. The p values are from two-way ANOVA with Šídák's multiple-comparisons test, see Extended Data Figure 6-1. Mice in B–E are chow-fed males (n = 5–15/group). In D, data are the mean with the SEM omitted for visual clarity.
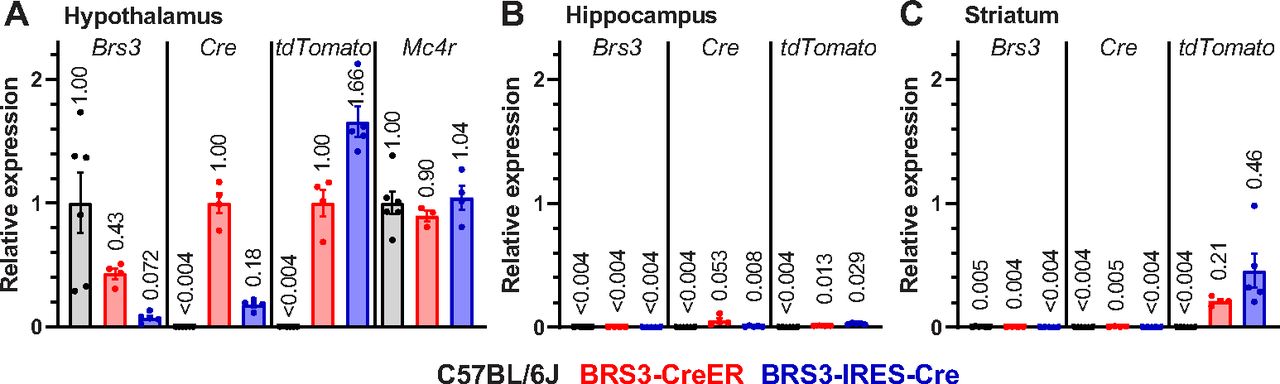
- Figure 7.
mRNA levels in hypothalamus, hippocampus, and striatum of the two BRS3-Cre mouse models. mRNA expression was quantified by RT-PCR in hypothalamus (A), hippocampus (B), and striatum (C) of control (C57BL/6J, black), BRS3-CreER (red), and BRS3-IRES-Cre (blue) mice at 5–6 months of age. In all samples, Brs3 and Mc4r mRNA levels are normalized to the C57BL/6J hypothalamus, and Cre and tdTomato mRNA levels are normalized to the BRS3-CreER hypothalamus. Mc4r mRNA levels are a dissection and technical control. Mean values are indicated above each bar. Expression below the limit of detection is indicated as <0.004 (n = 4–6/group).


Tables
C57BL/6J BRS3-CreER BRS3-IRES-Cre BRS3-null Body weight Reference Increased Increased Increased Body temperature span Reference No change No change Increased Reporter expression in adult Ai14 mice Hypothalamus Yes Yes Parabrachial nucleus Yes Yes Hippocampus No Yes Striatum No Yes Hypothalamus Brs3 RNA 100% 43% 7% None Food intake inhibition by BRS3 agonist, MK-5046 Yes Intact Lost Lost Body temperature increase by BRS3 agonist, MK-5046 Yes Intact Blunted Lost BRS3-IRES-Cre observations are presented in Results; BRS3-CreER data are from Results and the study by Piñol et al. (2018); and the BRS3-null phenotype is from the studies by Ohki-Hamazaki et al. (1997b), Guan et al. (2011), and Xiao et al. (2017), among others.
Figure 1-1
A listing of the expression sites. Download Figure 1-1, DOCX file.
Figure 4-1
Datasets with fewer Brs3-positive cells are listed. See studies by Saunders et al. (2018), Tepe et al. (2018), Guo and Li (2019), Huang et al., 2019), Huisman et al. (2019), Van Hove et al. (2019), Wizeman et al. (2019), Huang and Sabatini (2020), and Mizrak et al. (2020). Download Figure 4-1, XLS file.
Figure 6-1
The p values are from two-way ANOVA with Šídák's multiple-comparisons test. Download Figure 6-1, XLS file.
In this issue


