

Article Figures & Data
Figures
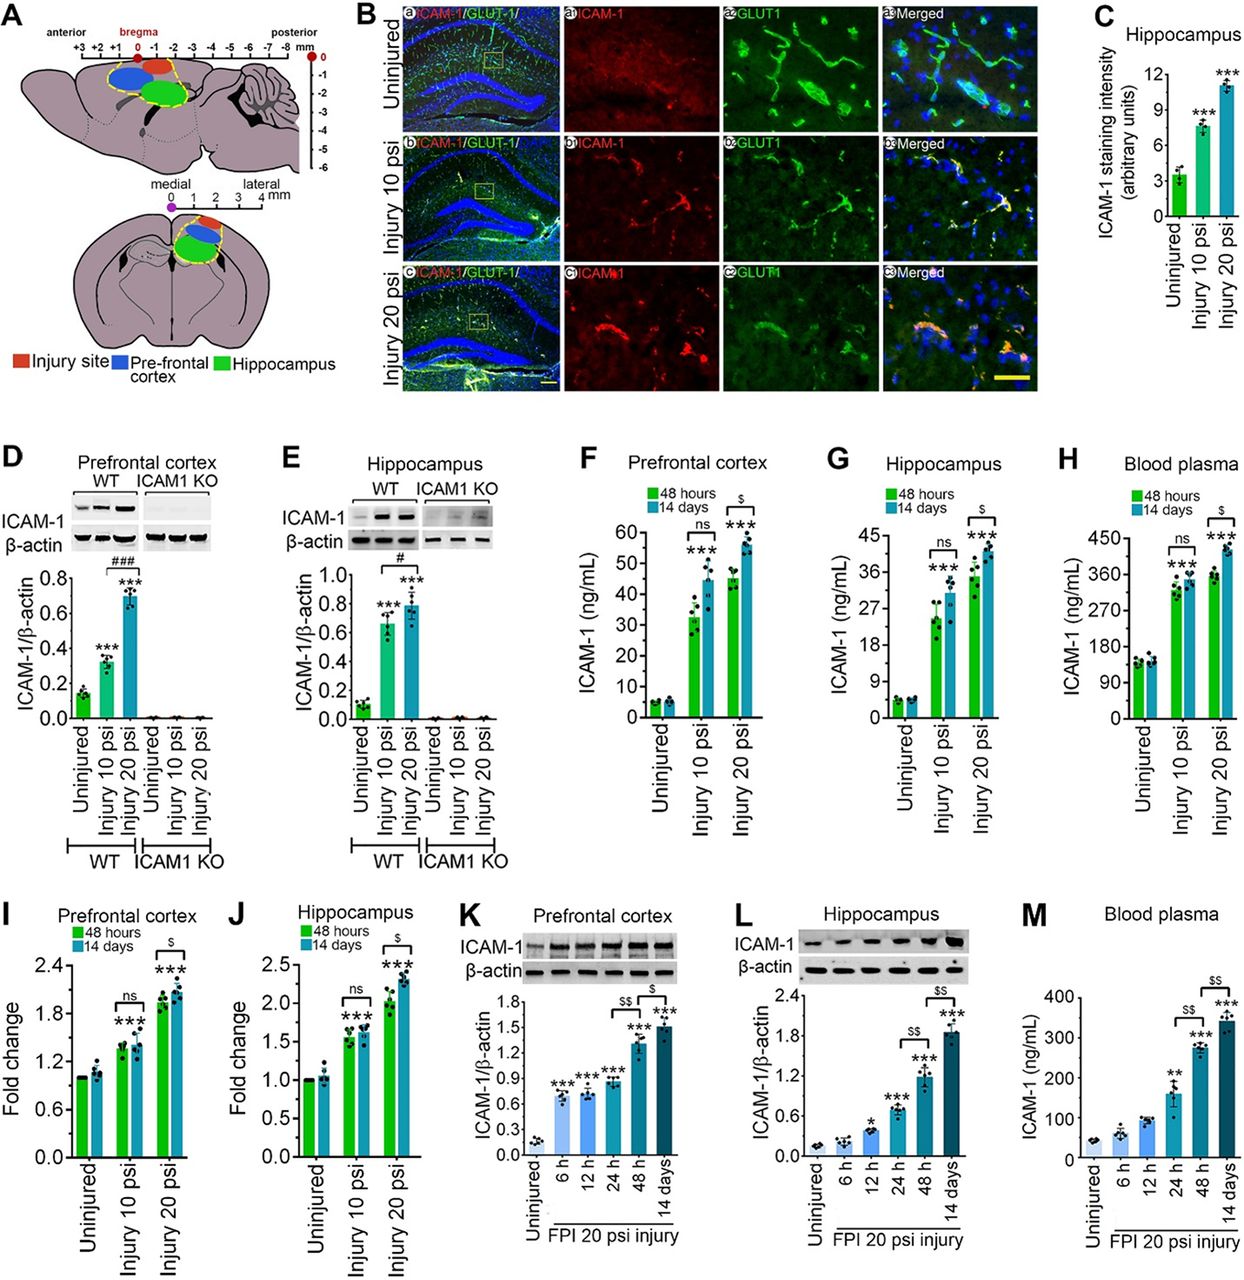
- Figure 1.
TBI activates ICAM-1 protein in both mild and moderate injury. A, Representative illustration of injury site and tissue sampling area in the mice brain subjected to FPI. The injury site, PFC, and hippocampus are labeled with red, blue, and green colors, respectively. B, Immunofluorescent staining of ICAM-1 (red) in the hippocampus area and merged with GLUT-1 (green) and DAPI (blue) after 10 and 20 psi FPI. Scale bar: 100 μm (shown in c is for a–c, first column) and 40 μm (shows in c3 is for a1–a3, b1–b3, and c1–c3, columns 2–4). C, Quantification of ICAM-1 staining in the hippocampus area of WT uninjured, 10 and 20 psi FPI mice using ImageJ software (n = 4/group). D, E, Western blot analysis of ICAM-1 and β-actin in the tissue lysates from PFC and hippocampus of WT and ICAM-1−/− mice 48 h after 10 and 20 psi FPI. The bar graph with dot plots shows the quantification of ICAM-1 versus β-actin (n = 6/group). F–H, ELISA quantification of ICAM-1 in PFC (F), hippocampus (G) tissue lysates and blood plasma (H) 48 h and 14 d following 10 and 20 psi FPI (n = 6/group). I, J, mRNA expression level of ICAM-1 using qPCR from PFC and hippocampus of WT and ICAM-1−/− mice 48 h and 14 d after 10 and 20 psi FPI (n = 6/group). K, L, Western blot analysis of ICAM-1 and β-actin expression at different time points (6 h, 12 h, 24 h, 48 h, and 14 d) in the PFC (K) and hippocampus (L) of WT uninjured and 20 psi FPI. Bar graph represents the densitometric ratio of ICAM-1 bands versus β-actin bands (n = 6/group). M, ELISA quantification of ICAM-1 at different time points (6 h, 12 h, 24 h, 48 h, and 14 d) in the blood plasma of WT uninjured and 20 psi FPI mice (n = 6/group). All values are expressed as mean ± SD. Statistically significant *p < 0.05, **p < 0.01, ***p < 0.001 versus WT uninjured group; #p < 0.05, ###p < 0.001 between 10 and 20 psi; $p < 0.05, $$p < 0.01 between time points; ns = non-significant.
- Figure 2.
Stretch injury causes the activation of ICAM-1 in a time-dependent manner and is regulated by oxidative stress, MMPs, and VEGF signaling. A, Western blot analysis of ICAM-1 and β-actin 24 h after 3.0 psi stretch injury in the cell lysates of hBMVEC treated with control siRNA, ICAM-1 siRNA, A205804, and IRP. Bar graph represents the quantification of ICAM-1 versus β-actin (n = 6/group). B, C, ELISA quantification of ICAM-1 in cell lysates (B), and cell culture supernatant (C) of hBMVEC following 3.0 psi stretch injury treated with control siRNA, ICAM-1 siRNA, A205804, and IRP (n = 6/group). D, mRNA expression level of ICAM-1 using qPCR from hBMVEC treated with control siRNA, ICAM-1 siRNA, A205804, and IRP (n = 6/group) 24 h after 3.0 psi stretch injury. E, Western blot analysis of ICAM-1 and β-actin expression at different time points (1, 6, 12, 24, 48 h) in hBMVEC lysates after 24 h 3.0 psi stretch injury. Bar graph represents the quantification of ICAM-1 versus β-actin (n = 6/group). F, G, ELISA quantification of ICAM-1 in cell lysate (F), and cell culture supernatant (G) of hBMVEC at different time points (1, 6, 12, 24, 48 h) following 3.0 psi stretch injury. H, Western blot analysis of ICAM-1 and β-actin 24 h after 3.0 psi stretch injury in the cell lysates of hBMVEC treated with apocynin (NADPH oxidase inhibitor), VEGF-A (recombinant human VEGF), Ki8751 (inhibitor of VEGFR phosphorylation), and TIMP1 (MMPs inhibitor). Bar graph represents the quantification of ICAM-1 versus β-actin (n = 6/group). I–K, Western blot analysis of NOX1, 4HNE, MMP-2, MMP-9, and β-actin 24 h after 3.0 psi stretch injury in the cell lysates of hBMVEC treated with apocynin, VEGF-A, Ki8751, and TIMP1. Bar graph represents the quantification of ICAM-1 versus β-actin (n = 6/group). L–N, Western blot analysis of VEGF-A, VEGFR-2, p-VEGFR-2Y1059, p-VEGFR-2Y1175, and β-actin 24 h after 3.0 psi stretch injury in the cell lysates of hBMVEC treated with apocynin, VEGF-A, Ki8751, and TIMP1 (n = 6/group). All values are expressed as mean ± SD. Statistically significant, ***p < 0.001 versus uninjured group; ##p < 0.01, ###p < 0.001 versus injury group.
- Figure 3.
TBI enhances the activation of LFA-1 or Mac-1 with ICAM-1 and promotes transmigration of leukocytes. A, B, Western blotting of LFA-1 (A), Mac-1 (B), and β-actin following 10 and 20 psi FPI in the prefrontal cortical tissue lysates of WT and ICAM-1−/− mice. Bar graph represents the densitometric ratio of LFA-1 or Mac-1 bands versus β-actin bands (n = 6/group). C, D, Western blotting of LFA-1 (C), Mac-1 (D), and β-actin in the hippocampal tissue lysates of WT and ICAM-1−/− mice. Bar graph represents the densitometric ratio of LFA-1 or Mac-1 bands versus β-actin bands (n = 6/group). E, Immunofluorescent staining of ICAM-1 (green) merged with LFA-1 (red) and DAPI (blue) in WT mice 48 h after 10 and 20 psi FPI (n = 4). F, Western blotting of ICAM-1, LFA-1, Mac-1, and β-actin 48 h after 10 and 20 psi FPI in the tissue lysates immunoprecipitated with ICAM-1 mAb. Anti-IgG antibody was used as a negative control (fourth lane in WT blots). G–I, Bar graphs show the densitometric ratio of ICAM-1 (G), LFA-1 (H), and Mac-1 (I) bands versus β-actin bands (n = 6/group). J–L, In vivo and in vitro analysis of transmigration of leukocytes across the BBB. Fluo3-labeled macrophage adhesion/migration in brain capillary after infusion of cells into the common carotid artery (J), and the quantification of Fluo3-labeled cells in the brain part (K). L, Migration of monocytes across the in vitro model of BBB after treatment of various test compounds as shown in figure (n = 6/group). All values are expressed as mean ± SD two-way ANOVA followed by Bonferroni post hoc tests. Statistically significant ***p < 0.001 versus WT uninjured group; ##p < 0.01, ###p < 0.001 uninjured versus uninjured, 10 versus 10 psi, and 20 versus 20 psi between WT and KO groups; ns = non-significant.
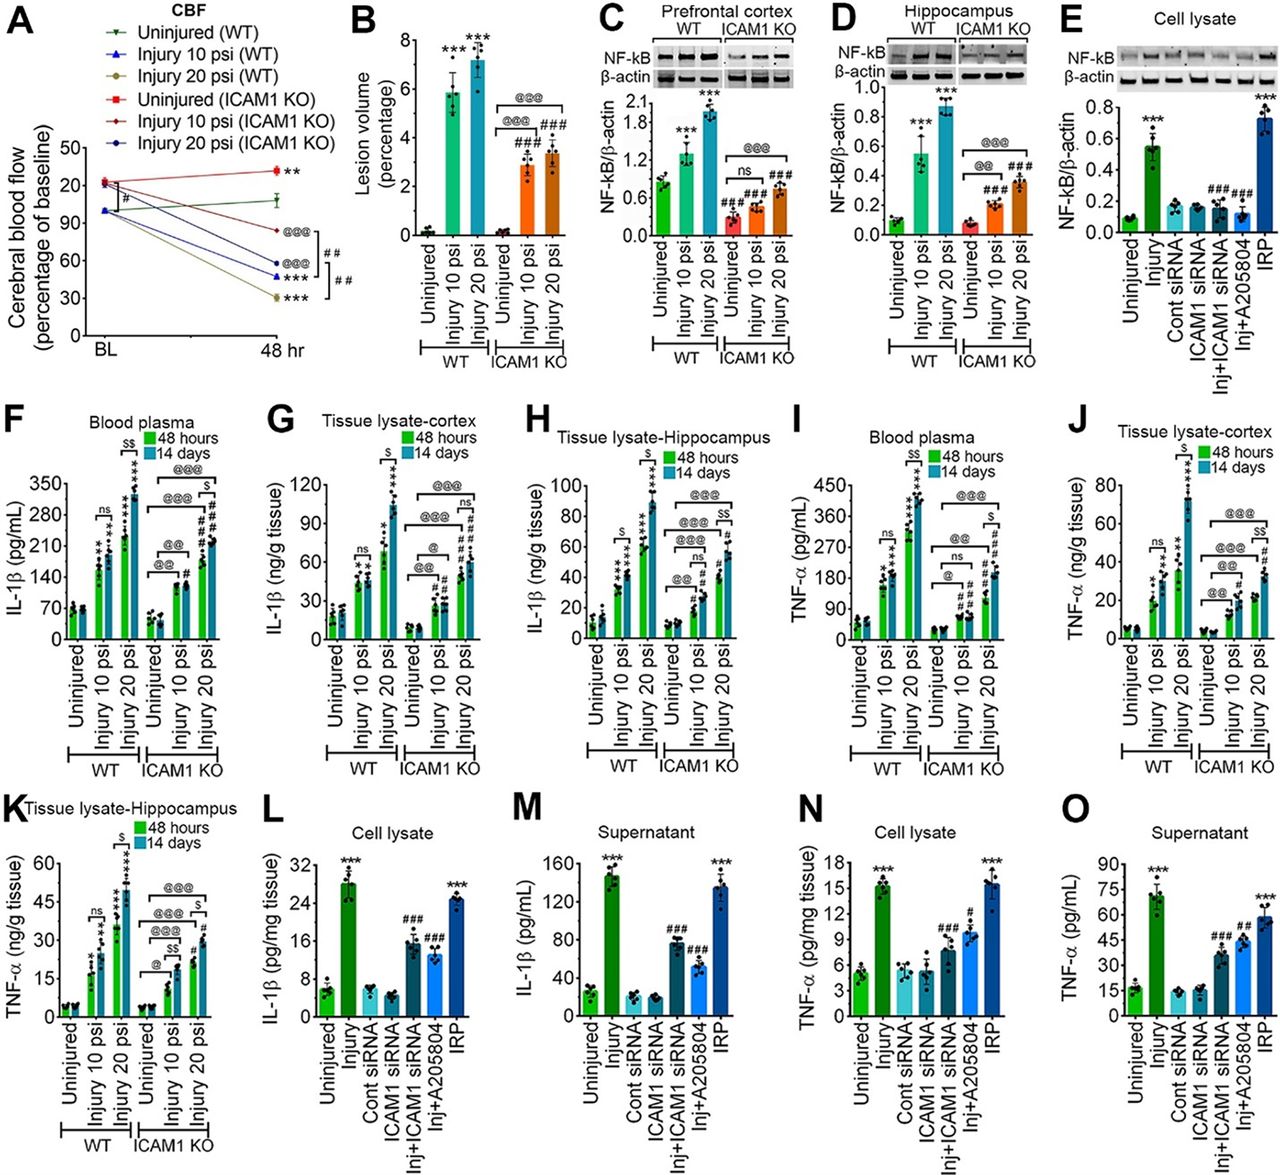
- Figure 4.
ICAM-1 decreases CBF, increases lesion volume, and activates neuroinflammatory response following both in vivo and in vitro model of TBI. A, CBF was measured by LDF perfusion monitored at baseline and 48 h after 10 and 20 psi FPI injury in WT and ICAM-1−/− animals and compared with their respective baseline values (n = 6/group). B, Measurement of lesion volume by cresyl violet staining method (n = 6/group). C-E, Western blotting of NF-kB and β-actin in PFC (C) and hippocampal (D) tissue lysates 48 h after 10 and 20 psi FPI (n = 6/group) and in the cell lysates of hBMVEC (E; n = 6/group) 24 h after 3.0 psi stretch injury. Bar graphs show the quantification of NF-kB. F–H, ELISA of IL-1β in the blood plasma samples (F), the brain prefrontal cortical tissue lysates (G) and in the hippocampal tissue lysates (H; n = 6/group). I–K, ELISA of TNF-α in the in the blood plasma samples (I), the brain prefrontal cortical tissue lysates (J) and in the hippocampal tissue lysates (K; n = 6/group). L, M, ELISA of IL-1β in the cell lysates (L) and cell culture supernatant (M) of hBMVEC 24 h after 3.0 psi stretch injury (n = 6/group). N, O, ELISA of TNF-α in the cell lysates (N) and cell culture supernatant (O) of hBMVEC (n = 6/group) 24 h after 3.0 psi stretch injury. All values are expressed as mean ± SD one-way ANOVA for E, L–O and two-way ANOVA for A–D, F–K followed by Bonferroni post hoc tests. Statistically significant *p < 0.05, **p < 0.01, ***p < 0.001 versus WT uninjured group; #p < 0.05, ##p < 0.01, ###p < 0.001 versus corresponding WT injury groups in A–D, F–K; @p < 0.05; @@p < 0.01, @@@p < 0.001 versus uninjured ICAM-1−/− group in A–D, F–K; #p < 0.05, ##p < 0.01, ##p < 0.01 between WT and KO groups in their respective groups in A–D, F–K. $p < 0.05, $$p < 0.01 between 48 h and 14 d postinjury in (F–K); ***p < 0.001 versus uninjured hBMVEC in E, L–O; #p < 0.05, ##p < 0.01, ###p < 0.001 versus 3 psi injury in E, L–O; ns = non-significant.
- Figure 5.
ICAM-1 activates the caspase-3 enzyme. A–C, AP immunohistochemistry of cl-caspase-3 in the PFC (A) and hippocampus (C) tissue sections from WT and ICAM-1−/− mice 48 h after 10 and 20 psi FPI using vector purple substrate kit, SK4600 in A and vector blue substrate kit, SK5300 in C. Scale bar: 100 μm (A, black), 20 μm (A, blue), and 100 μm (C, yellow). B, D, Quantification of cl-caspase-3-positive cells expressed as per mm2 area of sections in WT and ICAM-1−/− in uninjured, 10 and 20 psi groups in the PFC (B) and hippocampus (D) 48 h following FPI (n = 6/group). E, F, Western blotting of cl-caspase-3 and β-actin in the PFC (E) and hippocampus (F) tissue lysates of WT and ICAM-1−/− mice 48 h after 10 and 20 psi FPI. The bar graph shows the quantification of cl-caspase-3 versus β-actin (n = 6/group). G, Western blotting of cl-caspase-3 and β-actin 24 h after 3.0 psi stretch injury in the cell lysates of hBMVEC treated with control siRNA, ICAM-1 siRNA, A205804, and IRP (n = 6/group). Bar graph represents the densitometric ratio of cl-caspase-3 bands versus β-actin bands. All values are expressed as mean ± SD one-way ANOVA for G and two-way ANOVA for B, D–F followed by Bonferroni post hoc tests. Statistically significant ***p < 0.001 versus WT uninjured group in B, D, E, F; @p < 0.05; @@p < 0.01, @@@p < 0.001 versus uninjured ICAM-1−/− group in B, D, E, F; ###p < 0.001 versus corresponding WT uninjured or injury groups (10 and 20 psi) in B, D, E, F; ***p < 0.001 versus uninjured hBMVEC in G; #p < 0.05, ###p < 0.001 versus 3 psi injury in G; ns = non-significant.
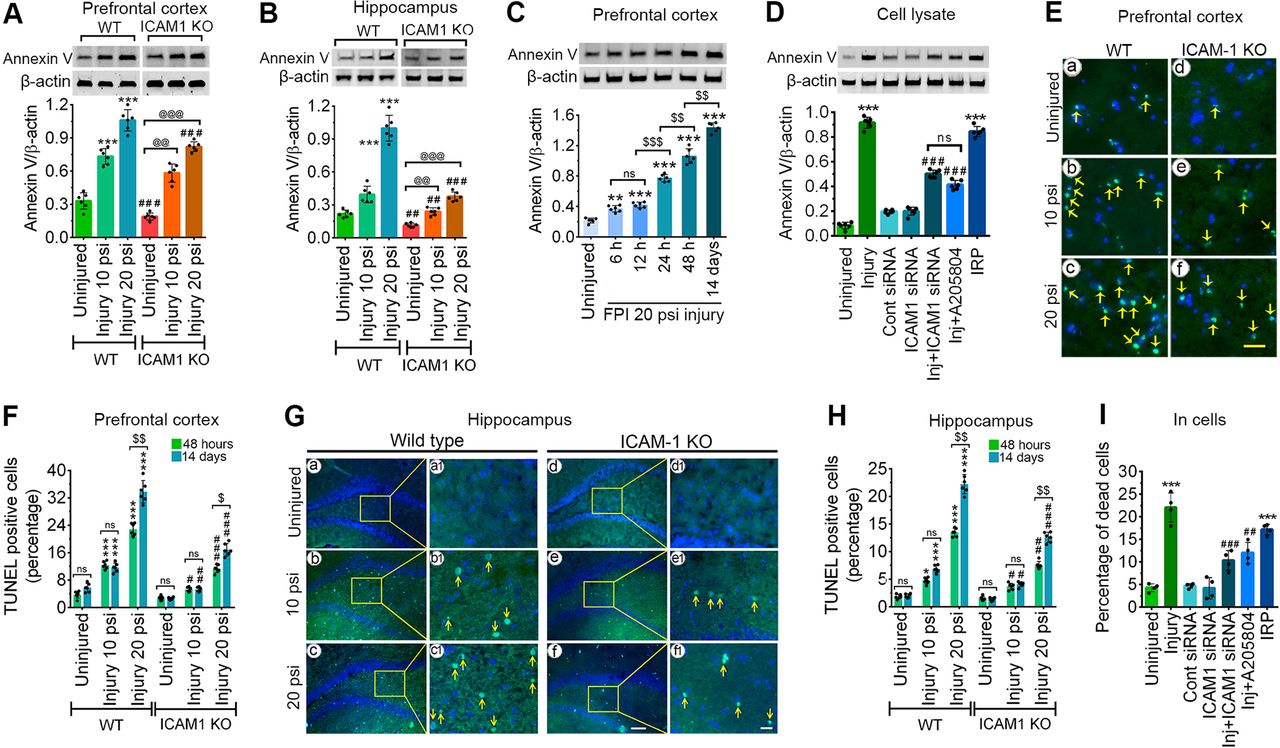
- Figure 6.
ICAM-1 activation induces cell death in animal and cell models of TBI. A, B, Western blotting of Annexin V and β-actin in tissue lysates of PFC (A), hippocampus (B) of WT and ICAM-1−/− mice 48 h after 10 and 20 psi FPI. C, Western blotting of Annexin V and β-actin at different time points in the PFC 48 h after injury. D, Western blotting of Annexin V and β-actin in the cell lysates of hBMVEC 24 h after 3.0 psi stretch injury. Bar graph represents the densitometric ratio of cl-caspase-3 bands versus β-actin bands (n = 6/group). E, G, Representative TUNEL staining (green) images 48 h after 10 and 20 psi FPI in the PFC (E) and hippocampus (G). Scale bar: 25 μm (E), 100 μm (G, bigger panels a–f), and 20 μm (G, enlarged panels a1–f1); n = 6/group. F, H, Percentage of apoptotic-positive cells in the PFC (F) and hippocampus (H). I, Trypan blue staining represented as a percentage of dead cell analyzed 24 h after 3.0 psi stretch injury in hBMVEC (n = 4/group). All values are expressed as mean ± SD one-way ANOVA for C, D, one-way and two-way ANOVA for A, B, F, H followed by Bonferroni post hoc tests. Statistically significant *p < 0.05, **p < 0.01, ***p < 0.001 versus WT uninjured group in B–D, F–I and versus uninjured hBMVEC in E, J; #p < 0.05, ##p < 0.01, ###p < 0.001 versus corresponding WT injury groups in B–D, F–I and versus injured hBMVEC in E, J; @p < 0.05, @@p < 0.01, @@@p < 0.001 versus uninjured ICAM-1−/− group in B–D, F–I; $p < 0.05, $$p < 0.01 between 48 h and 14 d postinjury in G, I and between two time frames in D; ns = non-significant.
- Figure 7.
ICAM-1 activation impairs sensorimotor functions and enhances psychological stress after TBI. A, Latency to fall time in rotarod was examined in WT and ICAM-1−/− mice at baseline, 48 h and 14 d after 10 and 20 psi FPI (n = 6/group). B, C, The grid-walk analysis was monitored in WT and ICAM-1−/− mice at baseline, 48 h and 14 d after 10 and 20 psi FPI. Number of grid-walk errors (B) and time to finish a grid-walk (C) (n = 6/group). D, The sucrose preference test for depression behavior was calculated as a percentage of the volume of sucrose intake over the total volume of fluid intake at baseline, 48 h, and 14 d after injury in WT and ICAM-1−/− mice subjected to 10 and 20 psi FPI (n = 6/group). E, The light-dark box test for anxiety-like behavior expressed as % time spent exploring the light chamber and the number of transitions between the chambers monitored at 48 h and 14 d after injury in WT and ICAM-1−/− mice subjected to 10 and 20 psi FPI (n = 6/group). All values are expressed as mean ± SD two-way ANOVA followed by Bonferroni post hoc tests. Statistically significant *p < 0.05, **p < 0.01, ***p < 0.001 versus WT uninjured group; @p < 0.05; @@p < 0.01, @@@p < 0.001 versus ICAM-1−/− uninjured group; #p < 0.05, ##p < 0.01, ###p < 0.001 versus corresponding WT injury groups; $$p < 0.01 between 48 h and 14 d postinjury in A–E; ns = non-significant.
- Figure 8.
ICAM-1 reduces neurotransmitters expression that reflects in sensorimotor deficits and psychological stress after TBI. A, Immunofluorescent staining of NE (red) in the hippocampus area of WT and ICAM-1−/− mice after 10 and 20 psi FPI and merged with NeuN (green) and DAPI (blue). Scale bar: 20 μm (all panels). B, Quantification of NE staining in the hippocampus area of uninjured, 10 and 20 psi FPI WT and ICAM-1−/− mice using ImageJ software (n = 6/group). C–E, Western blot analysis of 5-HT1AR (C), DAD1R (D), NPY (E) and β-actin in the tissue lysates of hippocampus of WT and ICAM-1−/− mice 48 h after 10 and 20 psi FPI. The bar graph with dot plots shows the quantification of 5-HT1AR (C), DAD1R (D), NPY (E) versus β-actin (n = 6/group). F, Schematic presentation of the findings. All values are expressed as mean ± SD two-way ANOVA followed by Bonferroni post hoc tests. Statistically significant ***p < 0.001 versus WT uninjured group; @@@p < 0.001 versus uninjured ICAM-1−/− group; #p < 0.05, ##p < 0.01, ###p < 0.001 versus WT corresponding injury groups; ns = non-significant. NE, norepinephrine; 5-HT1AR, 5-HT 1A receptor; DAD1R, DA D1 receptor; NPY, neuropeptide Y.


Tables
Antibody Dilution Catalog number RRID Vendor Anti-ICAM-1 WB: 1:1000
IF: 1:250ma5407 AB_223596 Invitrogen Anti-Glut-1 IF: 1:250 ab80024 AB_2190927 Abcam Anti-NeuN IF: 1:250 ab104224 AB_10711040 Abcam Anti- VEGF-A WB: 1:1000 ma5-13182 AB_10981661 Invitrogen Anti-4HNE WB: 1:1000 ab46545 AB_722490 Abcam Anti-MMP-9 WB: 1:1000 ab76003 AB_1310463 Abcam Anti-LFA-1 WB: 1:1000
IF:1:250ab186873 Not available Abcam Anti-MMP-2 WB: 1:1000 87809S RRID:AB_2800107 Cell Signaling Technology Anti-VEGFR-2 (p-Tyr1059) WB: 1:1000 3817s RRID:AB_2132351 Cell Signaling Technology Anti-VEGFR-2 (p-1175) WB: 1:1000 2478 RRID:AB_331377 Cell Signaling Technology Anti-caspase-3 WB:1:1000 9662S RRID:AB_331439 Cell Signaling Technology Anti-NF-kB p65 WB: 1:1000 3033 RRID:AB_331284 Cell Signaling Technology Anti-cleaved-caspase3 WB: 1:1000
AP IHC: 1:250MAB835 AB_2243951 R&D Systems Anti-NPY WB: 1:1000 MAB8517 Not available R&D Systems Anti-Annexin V WB: 1:1000 PA5-27872 AB_2545348 Thermofisher Anti-β-actin WB: 1:1000 MA575739 AB_2545348 Thermofisher Anti-DA D1 receptor (DAD1R) WB: 1:1000 NBP2-16213 AB_2819252 Novus Biologicalalals Anti-NE WB: 1:1000
IF: 1:200AB120 AB_90481 EMD Millipore Anti-5-HT1A receptor (5-HT1AR) WB: 1:1000 GTX104703 AB_1241307 GeneTex Anti-vWF IF:1:250 ab11713 AB_298501 Abcam Anti-NOX1 WB: 1:1000 GTX103888 AB_1951012 GeneTex
In this issue


