

Article Figures & Data
Figures
- Figure 1.
Exposure calibration, stimulus spectrum and temporal pattern. A, Sound levels recorded at different points in the cage in response to calibrated AAE stimulus. Circles denote points drilled into the bottom of a sample cage spaced ∼3.5” apart, through which a calibration microphone was inserted to the approximate height of a mouse off the cage bedding. Asterisk denotes hole calibrated to 70 dB SPL. B, The frequency response spectrum of AAE stimulus, presented through each speaker used in exposure (only one speaker was in use at any given time), demonstrates a flat region (±6 dB) from 4 to 20 kHz (indicated with dashed lines). The spectrum was recorded with a ½” ACO Pacific microphone on a Quest 1900 sound level meter output to an HP/Agilent 35665A spectrum analyzer. Each waveform consisted of 30 averages. C, Schematic of regular AAE and T-AAE exposure. Each exposure was presented twice per second, 200 ms per burst, for 12 h/d. T-AAE stimulus had a silent gap (either 0, 1, 2, 4, 8, or 16 ms in duration) inserted after the first 100 ms.
- Figure 2.
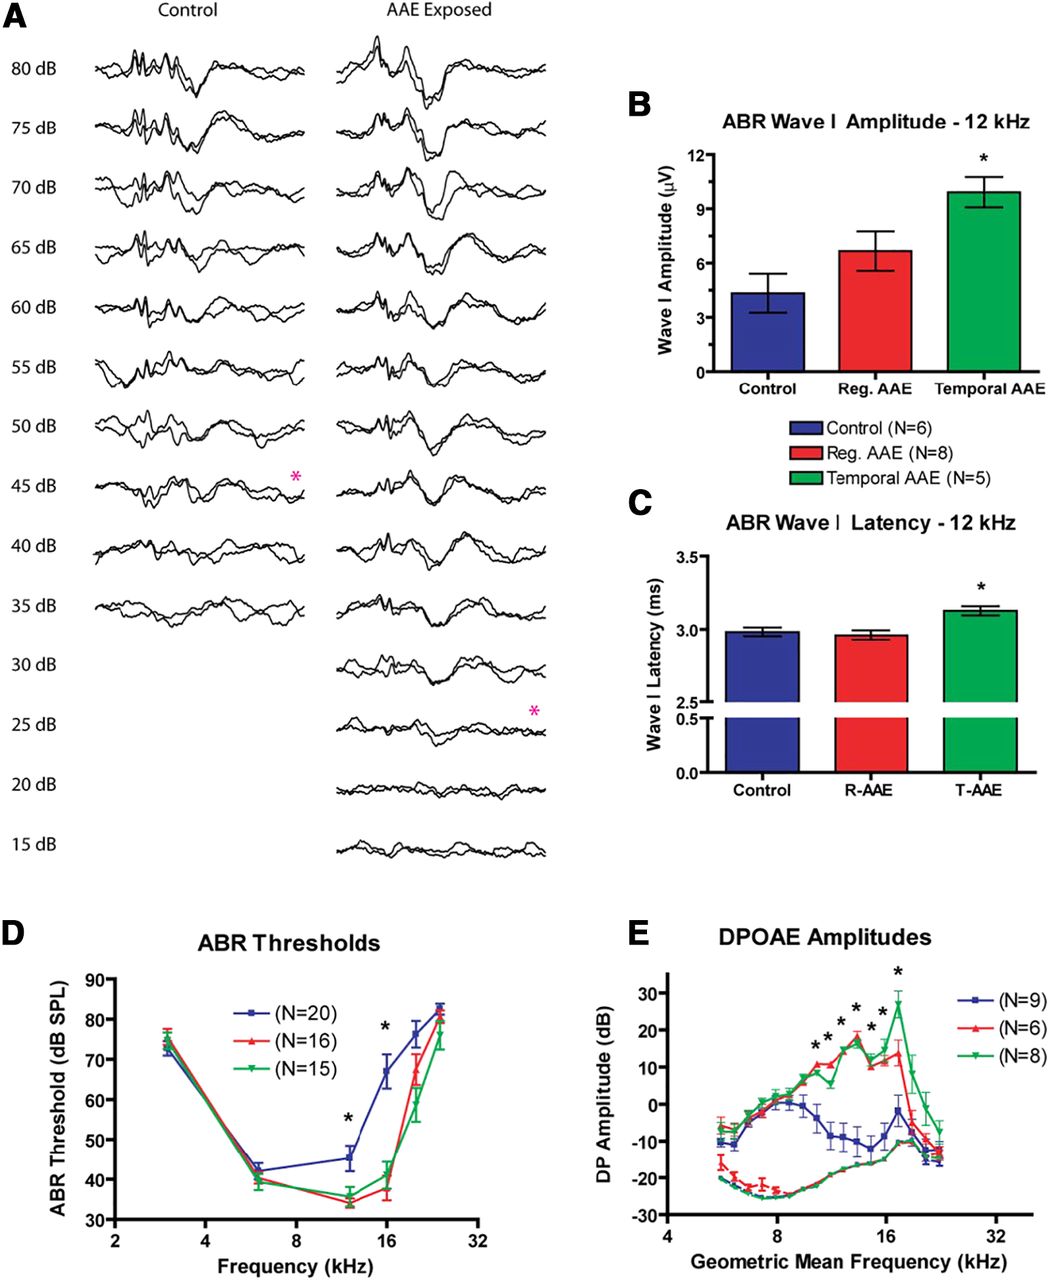
AAE exposure improves peripheral function at P30. A, Representative ABR waveforms from a control and AAE-exposed animal at 12 kHz show similar suprathreshold morphology, with an elevated threshold in the control animal. Visual detection thresholds are denoted by the red asterisk. B, ABR Wave I amplitudes were increased in both exposure types compared with controls [control (blue): 4.3 ± 1.1 μV; regular AAE (red): 6.7 ± 1.1 μV; T-AAE (green): 9.9 ± 0.8 μV], although only responses from T-AAE exposure reached significance (p < 0.05). C, ABR Wave I latencies were similar in magnitude (control: 2.98 ± 0.03 ms; regular AAE: 2.96 ± 0.03 ms; T-AAE: 3.13 ± 0.03 ms). T-AAE-exposed mice had significantly longer latency compared with control mice (p < 0.05) and regular AAE mice (p < 0.01). D, ABR thresholds were significantly decreased at 12 and 16 kHz following exposure to both types of AAE (regular = red, temporal = green) compared with controls (blue, p < 0.001). At the frequency of greatest differences (16 kHz), this difference approaches 30 dB SPL. No responses were noted above 24 kHz in any group. E, DPOAE amplitudes were increased following exposure to both types of AAE (regular = red, temporal = green) compared with controls (blue), with larger increases seen at select frequencies following T-AAE exposure. Between 10 and 17 kHz, both types of AAE exposure significantly increased amplitudes (mean increase: 21.2 ± 1.4 dB SPL, p < 0.01). Additionally, T-AAE exposure resulted in a 13 dB SPL amplitude increase over regular AAE exposed mice at two test frequencies (17.27 and 18.84 kHz). Amplitudes could not be distinguished from the noise floor (shown in dashed lines, same colors as above) above 22 kHz in any group. In all group comparisons between treatment vs control groups significance denoted by * denotes p < 0.05.
- Figure 3.
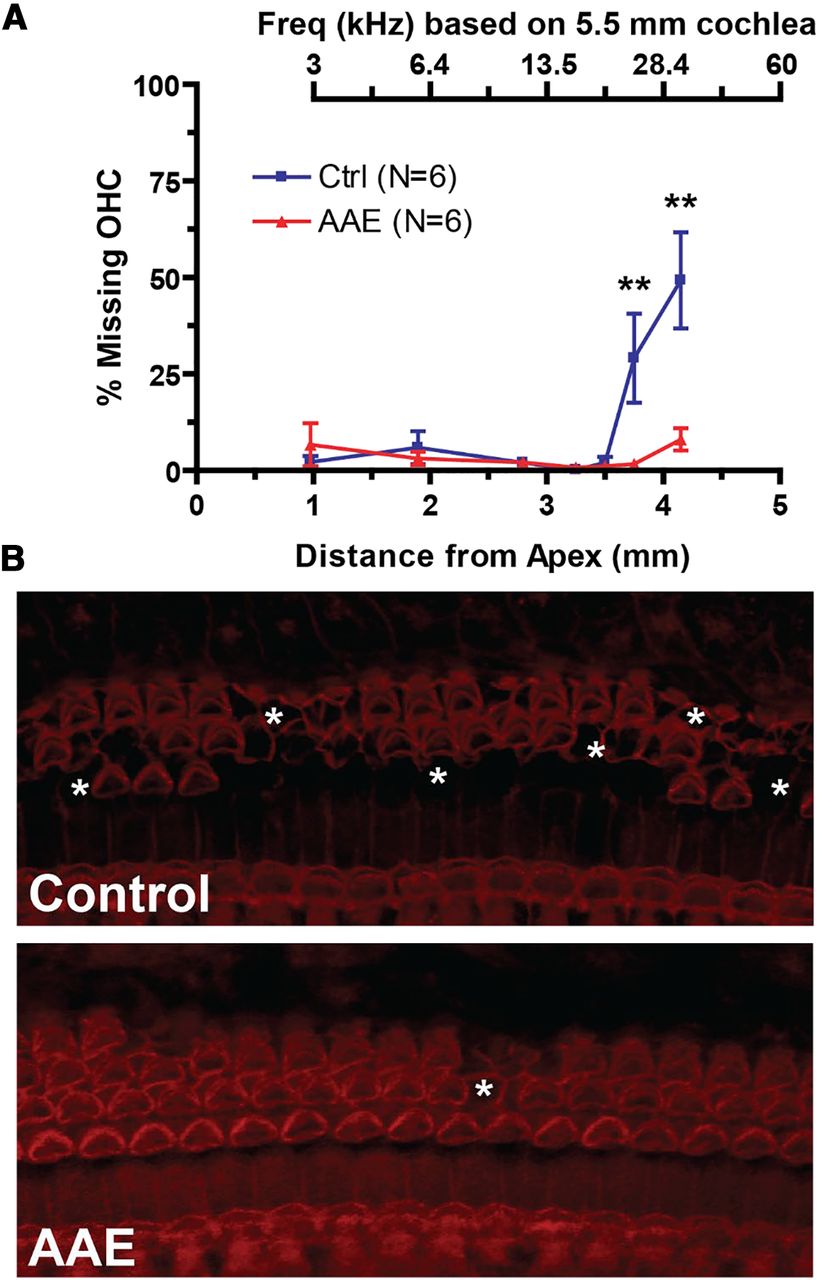
Mice exposed to AAE show significantly less OHC loss in the basal cochlea compared with control mice. A, Percent missing OHCs versus the distance from apex (in mm) to the center of the counting bin. Approximate frequency mapping is shown above for a 5.5-mm mouse cochlea. Two-way ANOVA is significant for exposure, distance from apex, and interaction (p < 0.001) while group comparisons show a significant increase in % missing OHCs at 3.75 mm from apex (29.1 ± 11.5% vs 1.7 ± 1.0%, p < 0.01) and 4.15 mm from apex (49.3 ± 12.5% vs 8.1 ± 2.9%, **p < 0.01). B, Example composite laser scanning microscopy (LSM) images (400×) from control (top) and AAE-exposed (bottom) mice at the 3.75-mm region. Asterisks denote sections of missing OHCs. No inner hair cells were identified as missing for all animals in both AAE and control groups.
- Figure 4.
Exposure to AAE changes the frequency responses of IC units. A, Example FRAs are shown from representative control, regular AAE-exposed, and T-AAE-exposed animals. Color-mapped counts indicate the number of spikes per frequency-level pair, with the legend shown on the right. BF was automatically identified as the frequency with the lowest intensity of drive (minimum threshold; MT). B, Mean BFs were significantly increased compared with controls following either type of AAE exposure (regular AAE: 14.2 ± 0.2 kHz, T-AAE: 15.1 ± 0.2 kHz, control: 12.4 ± 0.2 kHz; p < 0.001). Dot plot with a single point for each unit; black bar denotes mean value. No significant difference was seen between AAE exposure types. C, Mean unit thresholds were significantly decreased following either type of AAE exposure (regular AAE: 34.2 ± 0.6 dB SPL, T-AAE: 35.9 ± 0.5 dB SPL, control: 38.9 ± 0.7 dB SPL; p < 0.01). Again, no significant difference was seen between AAE exposure types. D, Tuning sharpness was improved with both types of AAE exposure. Q values computed at 10 dB as well as 20, 30, and 40 dB above threshold (data not shown) were significantly increased compared with controls (one-way ANOVA with post hoc testing, p < 0.001 at all levels). No significant differences were seen between the two types of AAE exposure. Graphs in B–D were vertically scaled to demonstrate differences in the mean, and thus some data points above the maximum vertical axis value are not shown and asterisks denotes significance between groups *p < 0.05, **p < 0.01, ***p < 0.001.
- Figure 5.
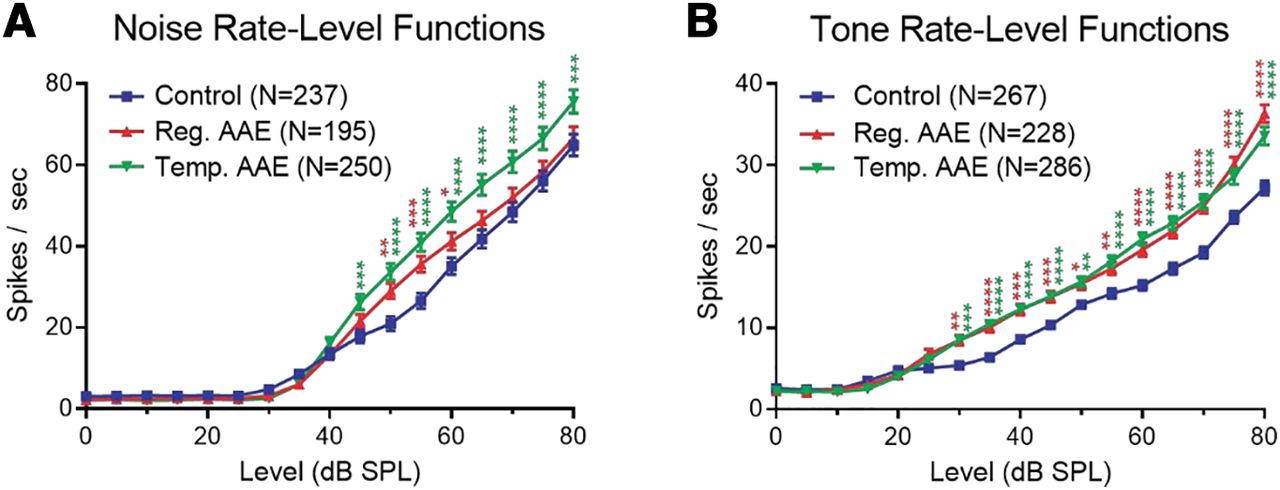
AAE exposure increases excitatory drive in the auditory midbrain as measured by rate-level functions. A, IC unit responses (spikes per second) to noise bursts (25 ms) plotted as a function of intensity (dB SPL) showed that AAE exposure significantly enhanced responses to moderate and/or high intensity wide-band noise. Two-way RM ANOVA showed a significant effect of intensity, as expected (F(16,11543) = 591.3; p < 0.0001), as well as a significant effect of treatment group (F(2,11543) = 45.85; p < 0.0001). Post hoc comparisons with Bonferroni correction showed significantly enhanced responses at intensities ≥45 dB SPL following regular (red asterisks) and temporal (green asterisks) AAE relative to controls (*p < 0.05, **p < 0.01, ***p < 0.001) . The T-AAE group also had significantly larger responses than the regular AAE group to stimuli ≥60 dB SPL (not demarcated for clarity). B, AAE exposure also enhanced IC unit responses to moderate and high intensities tone bursts. Tone bursts (25 ms) were delivered at the unit’s BF, identified as the frequency with the lowest intensity of drive. Responses to BF tone bursts (spikes per second) were plotted as a function of intensity (dB SPL). As expected, there was significant effect of intensity (F(16,13226) = 699.5; p < 0.0001), and there was also a significant effect of treatment group (F(2,13226) = 129.2; p < 0.0001). Post hoc comparisons showed significantly enhanced responses at intensities ≥30 dB SPL following regular (red asterisks) and temporal (green asterisks) AAE relative to controls. The regular AAE group also had significantly larger responses to 80 dB SPL stimuli than the T-AAE group (not demarcated for clarity).
- Figure 6.
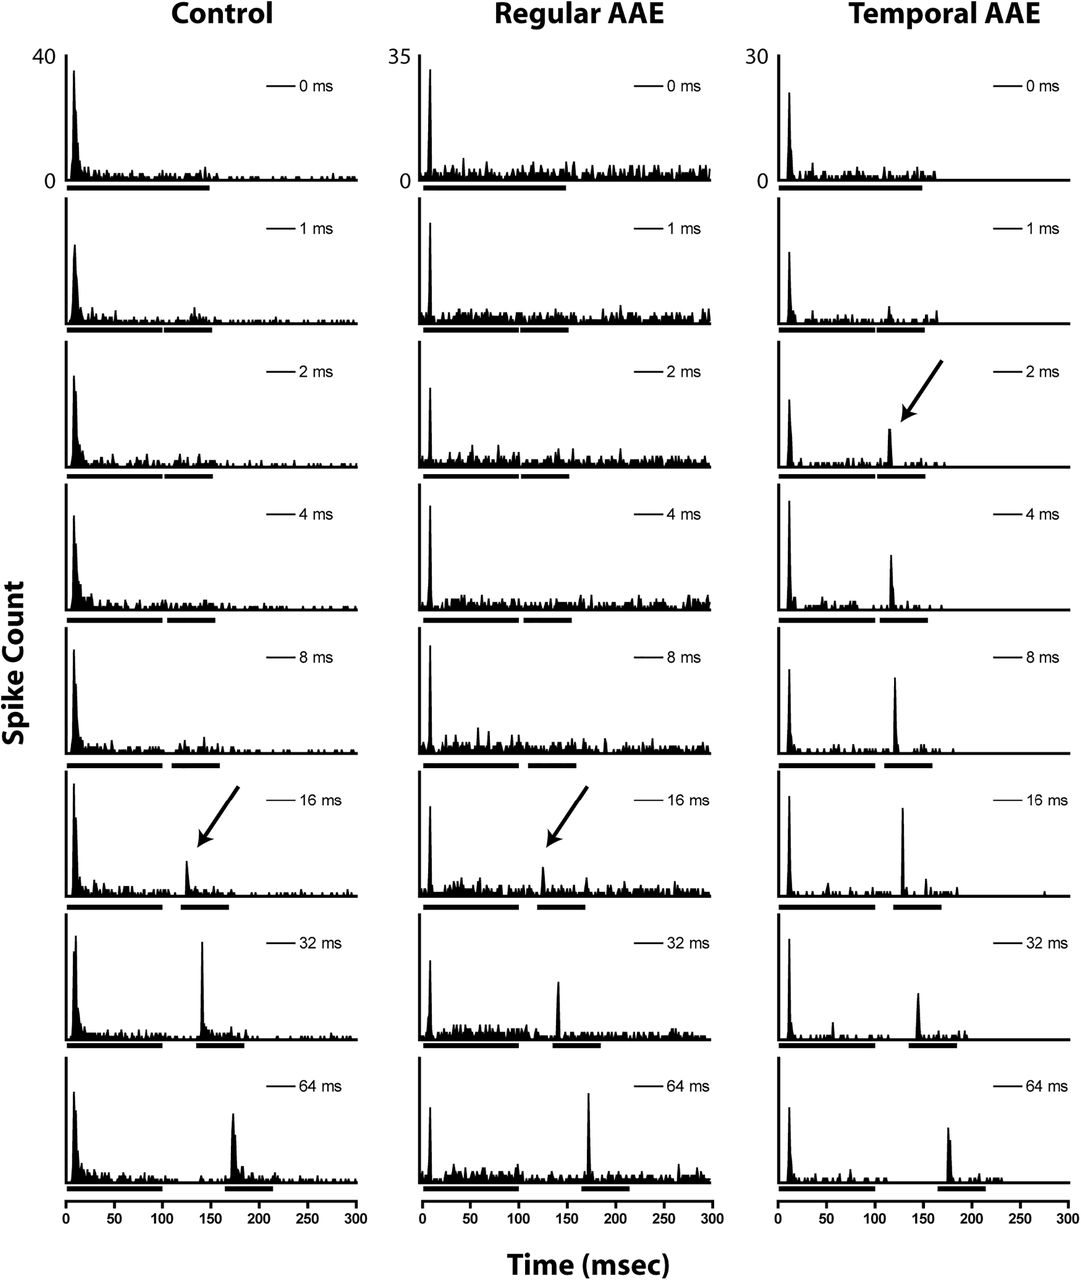
Representative examples of gap encoding of phasic units from unexposed (left), regular AAE-exposed (center), and T-AAE-exposed (right) mice. Bars under the x-axis denote noise-burst duration marking the silent gap. Arrows denote the automatically-calculated MGT for each unit.
- Figure 7.
Exposure to both types of AAE improve mean gap thresholds (MGTs) in phasic units. MGTs were computed across each group, for each noise carrier level (80, 70, and 60 dB SPL). A, At the 80 dB SPL carrier level exposure to both types of AAE resulted in shorter mean MGT (control: 15.0 ± 1.1 ms, regular AAE: 10.1 ± 0.9, T-AAE: 8.4 ± 0.7 ms). B, At the 70 dB SPL carrier level, exposure to both types of AAE again shorten mean MGT, with greater improvement seen in the T-AAE exposure group (control: 20.8 ± 1.5 ms, regular AAE: 15.7 ± 1.0, T-AAE: 12.7 ± 1.0 ms). C, At the 60 dB SPL carrier level, the mean MGT from the T-AAE group was significantly shorter than from the regular AAE group (15.9 ± 1.2 vs 23.3 ± 1.6 ms, p < 0.01). Additionally, the mean MGT for control mice was significantly shorter than from the regular AAE group (18.6 ± 1.7 vs 23.3 ± 1.6 ms), but the number of responsive units was much less. Sample size is shown inside the bar, with the percent shown as a percent of all phasic responsive units to an 80 dB SPL carrier. Asterisks denote a significant difference between regular or T-AAE and controls, **p < 0.01, ***p < 0.001.
- Figure 8.
Exposure to T-AAE preserves gap thresholds in the presence of CBN. Only a subset of phasic units was responsive in background noise. A, Shown are the MGTs measured in response to an 80 dB SPL carrier without CBN from only units responsive in background noise. These results match those seen in Figure 5A, where at 80 dB SPL, both types of AAE exposure resulted in significantly shorter MGT (***p < .001). B, The same units as in A, measured in response to an 80 dB SPL carrier with +6 dB SNR CBN (background noise at 74 dB). Only exposure to T-AAE resulted in significantly shorter gap thresholds compared with controls (12.7 ± 1.0 vs 17.9 ± 1.2 ms, **p < 0.01). Sample size is given in each bar, with percent shown as a percent of all phasic responders at 80 dB SPL. C, The percent of all responsive phasic units with MGTs ≤4 ms (sensitive responders) was increased in the T-AAE group at all levels. Asterisks denote a significant difference between regular or T-AAE and controls, **p < 0.01; ***p < 0.001.


Tables
Control Regular AAE T-AAE Periphery (# mice) ABRs 20 16 15 DPOAEs 13 12 8 Auditory midbrain # mice 11 11 10 Total # units recorded 825 932 904 FRAs (%) 574 (69.6) 702 (75.3) 629 (69.6) 80-dB gap responsive (%) 507 (61.5) 595 (63.8) 567 (62.7) 80-dB phasic units (%) 242 (29.3) 192 (20.6) 267 (29.5) 80-dB gap-in-noise
responsive (%)173 (21.0) 134 (14.4) 210 (23.2) 70-dB phasic units (%) 204 (24.7) 184 (19.7) 234 (25.9) 60-dB phasic units (%) 96 (11.6) 170 (18.2) 188 (20.8) For peripheral measures, counts are given in terms of number of animals tested. For central auditory recording, counts are listed in terms of number of animals as well as the number units recorded from these animals. Percent values are listed as percent of total units recorded for each exposure type. All measure of dB listed are in dB SPL.
In this issue


