

Article Figures & Data
Figures
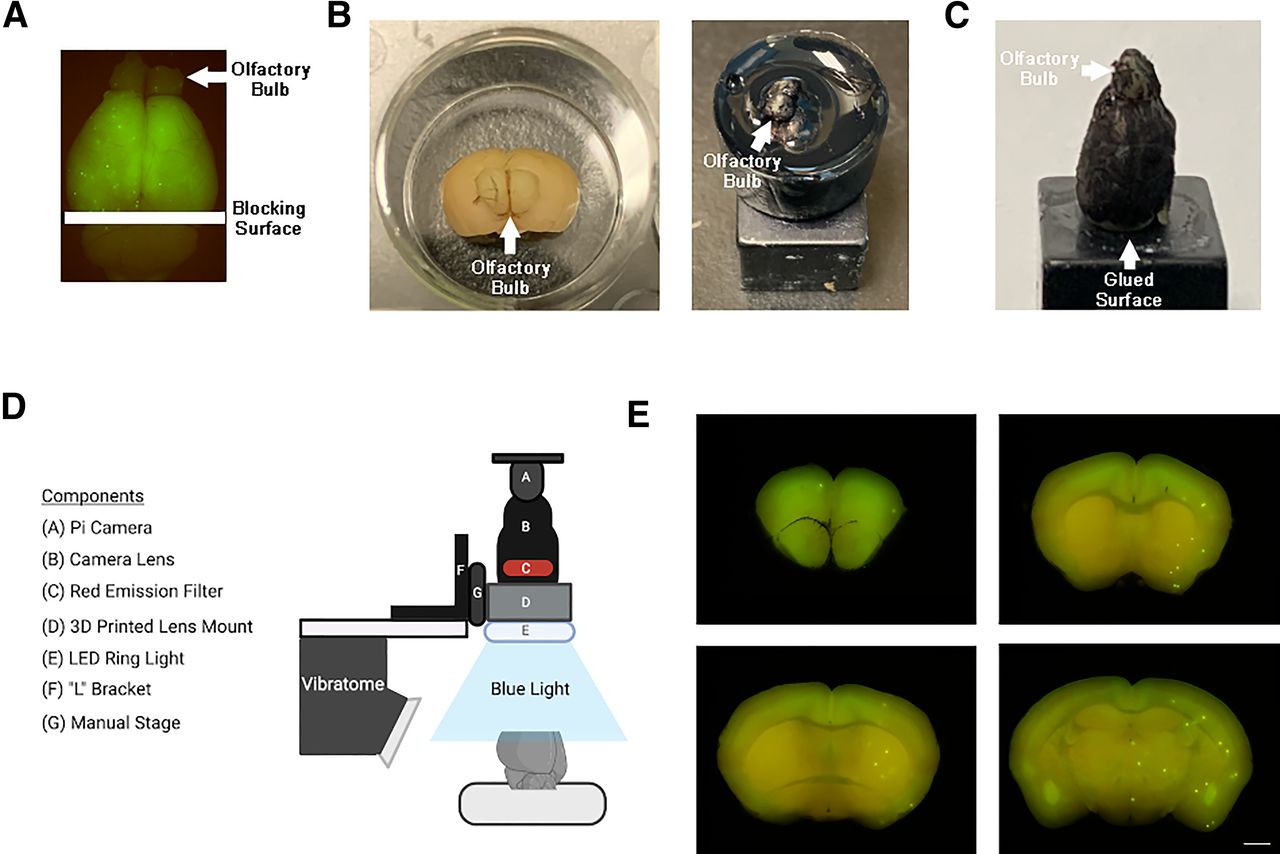
- Figure 1.
Block-face imaging setup. A, Brains were blocked coronally at the level of the colliculus. B, To ensure a black background during block-face imaging, brains were embedded in 2% agarose darkened with India Ink, using a 45-well plate as a mold. Once solidified, the block was extracted from the well plate and glued to the vibratome chuck for sectioning. C, Alternatively, the brain can be directly glued to the vibratome chuck and black ink can be applied directly to the brain surface. D, Visual representation of the block-face imaging setup. E, Representative block-face images of mouse brain with fluorescent microspheres (scale bar: 1 mm).
- Figure 2.
Microsphere detection. A, Validation of image thresholding to produce binary segmentation masks of individual microspheres. Left, Block-face image with visible fluorescent microspheres (green). Fluorescent microspheres are visible ∼300–400 μm into the tissue block. Following image thresholding to distinguish microspheres, serial images are subtracted from each other to determine the microsphere’s true location. Middle left, Microspheres (red) detected with image threshold after subtraction of serial images. Middle right, Microspheres manually counted by an experimenter after subtraction of serial images (green). Right, Overlay of raw block-face image with microspheres manually selected and thresholded (yellow, agreement between manual and image threshold); scale bar: 1 mm. B, Correlation between microspheres identified by experimenter and microspheres that were detected from thresholded image. Each data point represents the number of microspheres identified manually or detected from thresholded image of each coronal image (N = 327; n = 64–67 per brain). C, Total number of microspheres manually identified by an experimenter or from thresholded image for each brain. D, The number of microspheres identified by an experimenter or thresholded image in each block-face image (N = 327). E, Number of microspheres manually counted from block-face images compared with the number of microspheres manually counted in histologic sections. F, Percent of microspheres lost in histologic sections when compared with the equivalent block-face image. Data are mean ± SD. Asterisk = significance based on paired t-test (p < 0.05).
- Figure 3.
Block-face imaging workflow. A, Block-face image with three surface microspheres identified. B, Microspheres detected from block-face image registered to AMB Nissl image using QuickNII. Microspheres detected with image threshold (green). C, Block-face image “anchored” to Nissl image of AMB atlas. D, AMB atlas segmentation map of block-face image with overlay of microspheres detected with image threshold (green). Each shade of gray is a unique brain region within the AMB (2017). E, Block-face image anchored to AMB atlas segmentation map. F, Slide-mounted brain section collected after acquiring block-face image. DAPI (blue) and microspheres (green). G, Visual representation of the steps of our block-face imaging workflow and atlas registration of microspheres. For example, using this workflow and Nutil, three surface microspheres were identified to be in the (1) hippocampal region, (2) medial hypothalamic zone, and (3) the lateral hypothalamic zone (scale bar: 1 mm).
- Figure 4.
A, Representative image of the widespread distribution of microspheres. Data represent the mouse with the mean number of microspheres (301). Each microsphere color represents target brain regions. B, Total number of microspheres in the brain. C, Microsphere density within the total brain volume sampled in each mouse. D, Heat map representing microsphere density (per mm3) in target brain regions across all mice (n = 29). The largest density of microspheres was found in the thalamus. The A-P coordinate relative to the anterior commissure is provided below each atlas image. Data are mean ± SD.
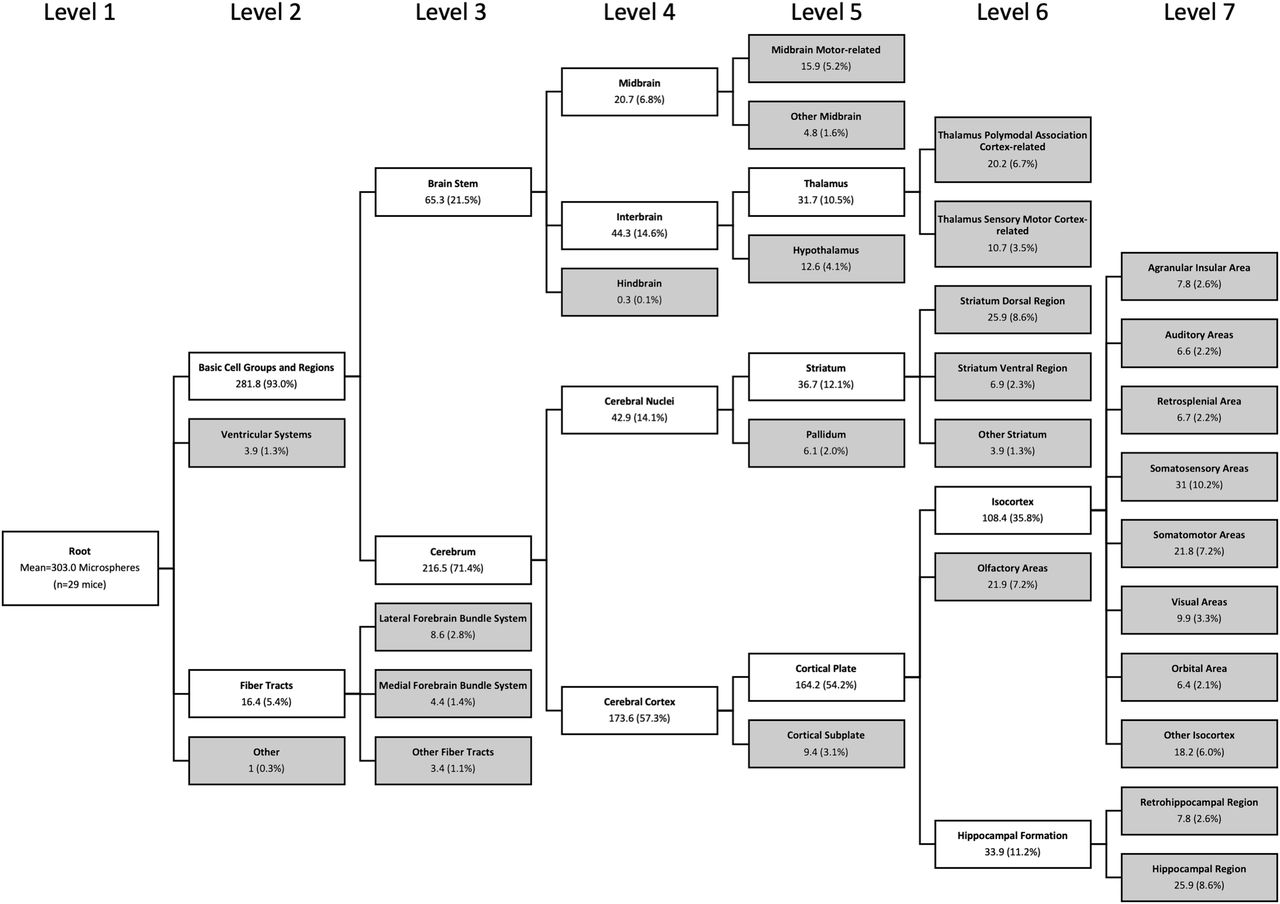
- Figure 5.
Microsphere location until level 7 AMB hierarchical tree across all animals (n = 29). Data are means of the number of microspheres in each anatomic tree location and the proportion relative to total microspheres (in parentheses). Target brain regions (i.e., terminal branches) are in gray.


Tables
- Table 1
Agreement between manual allocation of individual microspheres from block-face images and our block-face imaging workflow
Brain region Category Total counts Olfactory
aeasIsocortex Corpus
callosumHippocampal
regionStriatum Thalamus and
midbrainOther Agreement 995 (93.9%) 68 (88.3%) 383 (94.6%) 33 (75%) 129 (96.3% 96 (92.3%) 261 (97%) 25 (92.6%) Disagreement 65 (6.1%) 9 (11.7%) 22 (4.4%) 11 (25%) 5 (3.7%) 8 (7.5%) 8 (3%) 2 (7.4%) Total 1061 77 (7.3%) 405 (38.2%) 44 (4.2%) 134 (12.6%) 104 (9.8%) 269 (25.4%) 27 (2.5%) Agreement represents the same allocation between our workflow and manual rating. Overall, there is 93.9% agreement between our workflow and a human rater (N = 1061). Microspheres were predominantly found in isocortex and thalamus/midbrain. Data are presented as number of microspheres found in a given region, with the percentage relative to the total counts column found in parenthesis.
- Table 2
At each hierarchal level (Lvl) of the AMB, the agreement between a blinded rater allocating microspheres from histologic images and our block-face imaging workflow (upper) or compared with registering histologic sections with QuickNII (lower)
Category Lvl 10 Lvl 9 Lvl 8 Lvl 7 Lvl 6 Lvl 5 Lvl 3/4 Lvl 1/2 Manual histology compared
with block-face imaging
workflowAgreement 18 (34.6%) 29 (55.8%) 39 (75%) 45 (86.5%) 50 (96.2%) 50 (96.2%) 50 (96.2%) 51 (98.1%) Microsphere not
at this level27 (51.9%) 16 (30.8%) 8 (15.4%) 4 (7.7%) 0 (0%) 0 (0%) 0 (0%) 0 (0%) Sum of agreement 45 (86.5%) 45 (86.5%) 47 (90.4%) 49 (94.2%) 50 (96.2%) 50 (96.2%) 50 (96.2%) 51 (98.1%) Disagreement 7 (13.5%) 7 (13.5%) 5 (9.6%) 3 (5.8%) 2 (3.8%) 2 (3.8%) 2 (3.8%) 1 (1.9%) Total 52 52 52 52 52 52 52 52 Manual histology compared
with registering Histologic
sections with QuickNIIAgreement 22 (42.3%) 30 (57.7%) 40 (76.9%) 45 (86.5%) 48 (92.3%) 49 (94.2%) 50 (96.2%) 51 (98.1%) Microsphere not
at this level20 (38.5%) 14 (26.9%) 4 (7.7%) 1 (1.9%) 0 (0%) 0 (0%) 0 (0%) 0 (0%) Sum of agreement 42 (80.7%) 44 (84.6%) 44 (84.6%) 46 (88.5%) 48 (92.3%) 49 (94.2%) 50 (96.2%) 51 (98.1%) Disagreement 10 (19.2%) 8 (15.4%) 8 (15.4%) 6 (11.5%) 4 (7.7%) 3 (5.8%) 2 (3.8%) 1 (1.9%) Total 52 52 52 52 52 52 52 52 Agreement represents the number of microsphere given the same allocation between the rater and either workflow. Microsphere not at this level, represents the number of microspheres not located at a given level of the hierarchal tree. Some microspheres are not located at specific levels of the hierarchal tree, since every subregion of the AMB hierarchal tree does not end at the same level. Sum of agreement, the number of microspheres correctly allocated up to the specific hierarchal level. Disagreement, represents the number of microspheres incorrectly allocated at the given level. With 94.2% agreement, we are confident we can allocate microspheres from block-face imaging to level 7 of the hierarchal tree of the AMB atlas (e.g., somatomotor, somatosensory, visual, piriform areas, etc.). In contrast, registering histologic sections with QuickNII, rather than block-face images, results in 88.5% agreement at level 7.
Microsphere
number (#)Microsphere
proportion (%)Microsphere
density (#/mm3)Atlas region of interest No perfusion Perfusion p value No perfusion Perfusion p value No perfusion Perfusion p value Ventricular systems 4.5 (2.9) 3.3 (1.7) 0.195 1.2 (0.9) 1.5 (1.0) 0.487 0.75 (0.49) 0.56 (0.29) 0.195 Lateral forebrain bundle system 8.4 (5.8) 8.8 (3.2) 0.804 2.7 (1.4) 3.7 (1.6) 0.085 0.60 (0.42) 0.63 (0.23) 0.804 Medial forebrain bundle system 4.2 (3.1) 4.5 (3.3) 0.789 1.2 (0.7) 1.5 (0.9) 0.228 0.60 (0.44) 0.64 (0.46) 0.789 Other fiber tracts 3.5 (2.6) 3.3 (2.2) 0.852 1.1 (1.0) 1.4 (1.0) 0.439 0.24 (0.18) 0.23 (0.15) 0.852 Midbrain, motor-related areas 18.2 (11.7) 13.7 (11.8) 0.315 4.8 (2.3) 4.5 (2.7) 0.719 0.86 (0.55) 0.64 (0.56) 0.315 Other midbrain areas 5.3 (4.6) 4.3 (4.4) 0.576 1.5 (1.1) 1.4 (1.1) 0.820 0.61 (0.53) 0.50 (0.51) 0.576 Hypothalamus 12.9 (7.2) 12.2 (7.7) 0.795 4.3 (1.9) 4.3 (1.8) 0.991 0.85 (0.48) 0.80 (0.51) 0.795 Pallidum 6.1 (4.1) 6.1 (4.1) 0.995 1.6 (1.0) 2.1 (1.1) 0.247 0.66 (0.43) 0.65 (0.44) 0.995 Cortical subplate 11.1 (5.3) 7.9 (6.1) 0.135 3.1 (1.4) 2.6 (1.8) 0.413 1.25 (0.60) 0.88 (0.68) 0.135 Thalamus, polymodal
association cortex related21.3 (8.9) 19.1 (12.7) 0.604 6.7 (2.5) 6.9 (3.2) 0.837 1.68 (0.71) 1.51 (1.00) 0.604 Thalamus, sensory-motor
cortex related10.6 (5.2) 10.7 (5.9) 0.991 3.7 (2.7) 4.9 (3.9) 0.361 1.59 (0.77) 1.6 (0.89) 0.991 Striatum, dorsal region 30.2 (15) 21.9 (11) 0.099 8.8 (2.0) 7.9 (1.8) 0.213 1.16 (0.57) 0.84 (0.42) 0.099 Striatum, ventral region 8.3 (4.9) 5.6 (3.4) 0.094 2.5 (0.9) 2.3 (1.2) 0.623 0.96 (0.57) 0.65 (0.39) 0.094 Other striatum regions 4.1 (2.9) 3.7 (2.6) 0.642 1.3 (1.0) 1.4 (0.7) 0.849 0.54 (0.37) 0.48 (0.34) 0.642 Olfactory areas 25.9 (16.9) 18.1 (10.4) 0.146 7.4 (2.9) 7.1 (2.9) 0.749 0.55 (0.36) 0.39 (0.22) 0.146 Agranular insular area 8.4 (3.9) 7.2 (4.3) 0.431 2.8 (1.0) 2.6 (1.3) 0.652 1.07 (0.49) 0.91 (0.55) 0.431 Auditory areas 8.4 (6.6) 4.9 (3.2) 0.089 2.2 (1.6) 1.8 (1.0) 0.403 1.45 (1.13) 0.85 (0.56) 0.089 Retrosplenial area 8.0 (6.0) 5.4 (3.6) 0.164 2.0 (1.3) 2.1 (1.5) 0.815 0.76 (0.57) 0.51 (0.34) 0.164 Somatosensory areas 33.5 (19.2) 28.7 (14.8) 0.453 9.3 (3.7) 10.6 (3.6) 0.320 1.01 (0.58) 0.86 (0.44) 0.453 Somatomotor areas 22.9 (14.4) 20.8 (11.7) 0.665 6.5 (3.3) 7.8 (2.7) 0.263 0.94 (0.59) 0.85 (0.48) 0.665 Visual areas 12.5 (7.8) 7.4 (6.2) 0.060 4.0 (3.0) 2.4 (1.8) 0.098 0.93 (0.58) 0.55 (0.46) 0.060 Orbital area 8.1 (6.0) 4.8 (4.3) 0.100 2.5 (2.3) 1.7 (1.5) 0.277 1.37 (1.01) 0.81 (0.73) 0.100 Other isocortex areas 20.9 (12.3) 15.7 (10.1) 0.224 5.7 (2.4) 5.9 (2.5) 0.870 0.95 (0.56) 0.72 (0.46) 0.224 Retrohippocampal area 8.8 (6.4) 6.8 (7.4) 0.450 2.4 (1.4) 2.2 (2.2) 0.777 0.48 (0.35) 0.37 (0.40) 0.450 Hippocampal region 28.3 (13.2) 23.7 (11.7) 0.332 9.7 (5.5) 8.6 (2.8) 0.507 1.19 (0.55) 1.00 (0.49) 0.332 Unaccounted microspheres 3.0 (2.6) 1.9 (1.6) 0.193 0.8 (0.6) 0.7 (0.5) 0.517 Total, all regions combined 337.6 (153.6) 270.8 (117.3) 0.198 100 100 0.922 (0.408) 0.738 (0.319) 0.186 The total row for microsphere number and microsphere proportion are the sum of all regions within their respective columns. The total row for microsphere density uses the mean of all regions within its column. Data within a given column are means with SDs in parentheses.
Extended Data 1
Detailed description of the block-face imaging workflow and Python script for image acquisition. Download Extended Data 1, ZIP file.
Extended Data 2
ImageJ script for image processing. Download Extended Data 2, ZIP file.
Extended Data 3
Python script to facilitate compiling all microsphere location data. Download Extended Data 3, ZIP file.
Extended Data 4
Detailed statistics comparing the distribution of microspheres across identified brain regions. Download Extended Data 4, ZIP file.
In this issue


