

Article Figures & Data
Figures
- Figure 1.
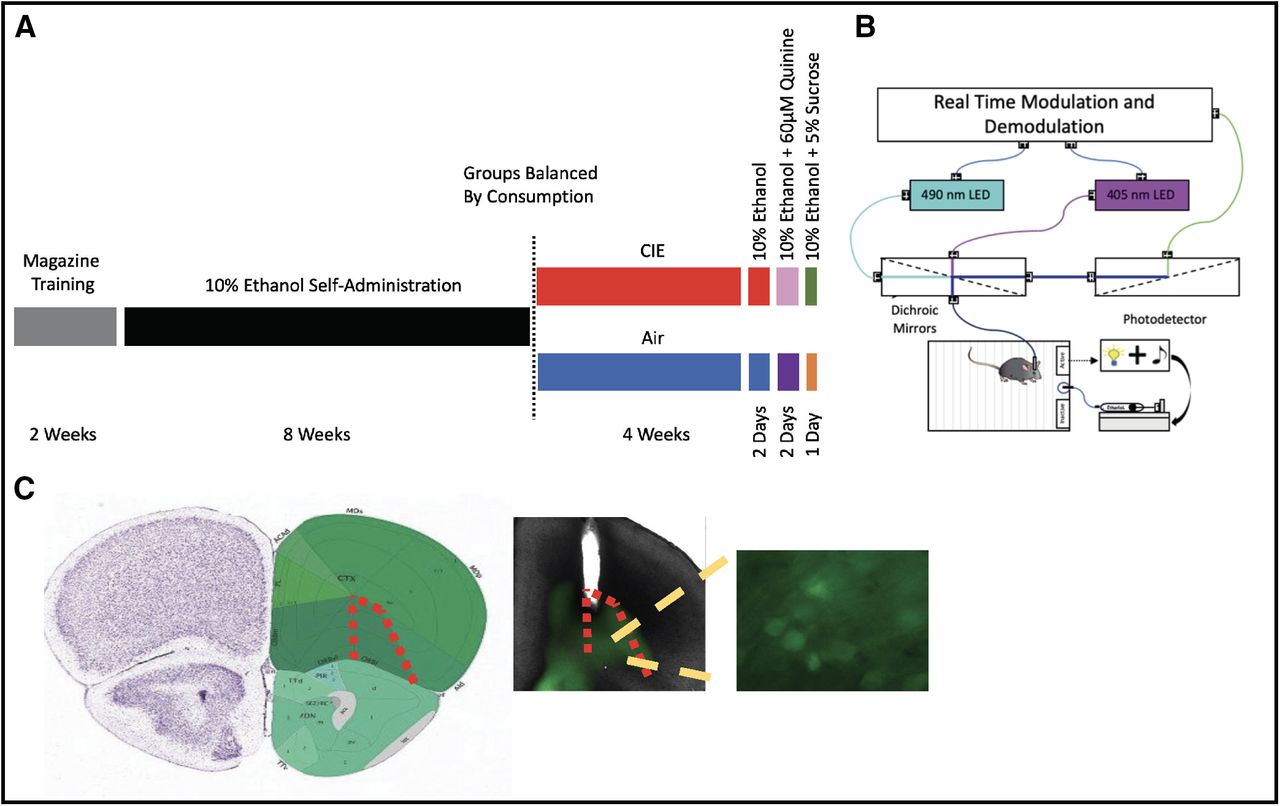
Experimental design. A, Timeline of operant training, drinking sessions, and CIE/Air exposure. B, Schematic of fiber photometry set up with operant drinking chamber. C, Image from Allen Brain Atlas showing orbitofrontal cortex and location of fiber photometry recordings. Inset, Representative image of fiber optic track and AAV-mediated GCaMP6f expression.
- Figure 2.
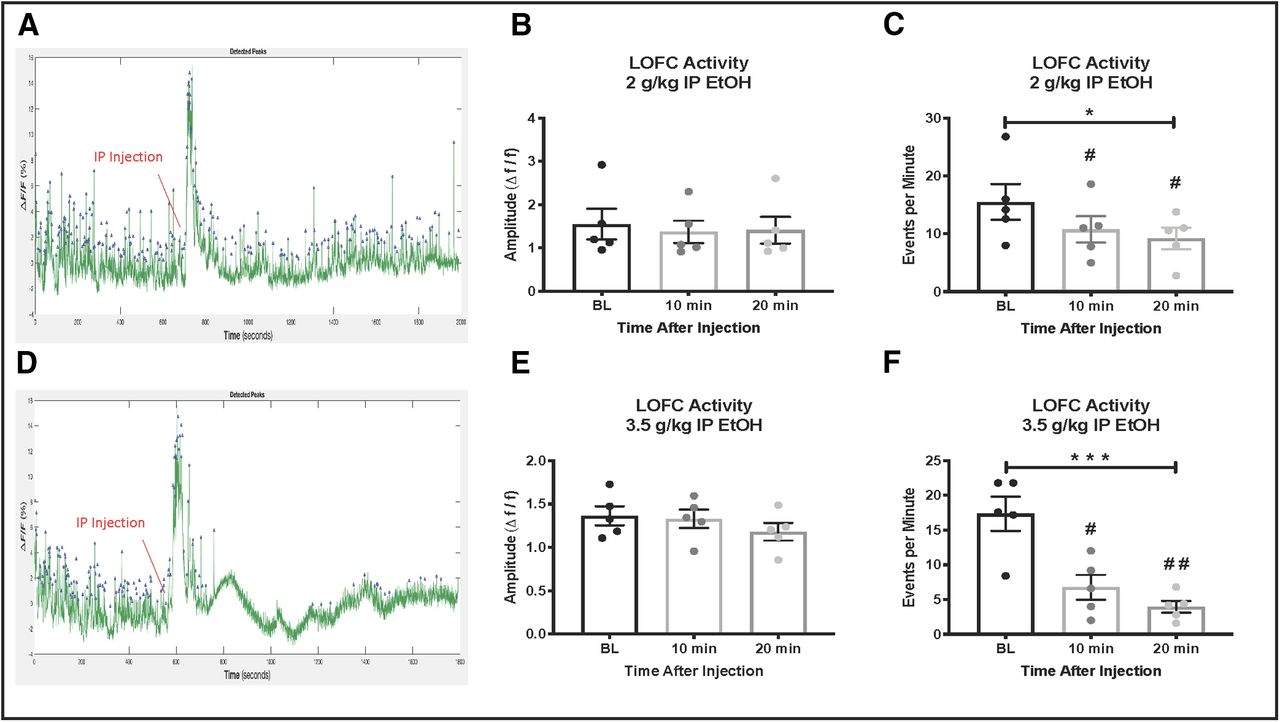
LOFC activity during intraperitoneal ethanol injection. A, Example trace of 30-min LOFC GCaMP6f activity before and after intraperitoneal injection of 2 g/kg ethanol. The ethanol injection causes a large spike in activity followed by recovery. B, 2 g/kg ethanol does not alter the amplitude of GCaMP6f events. C, 2 g/kg ethanol significantly decreases the frequency of GCaMP6f-mediated events. D, Example trace of 30-min GCaMP6f activity before and after intraperitoneal injection of 3.5 g/kg ethanol. The ethanol injection causes a large spike in activity followed by a sustained reduction in activity. E, 3.5 g/kg ethanol does not alter the amplitude of GCaMP6f events. F, 3.5 g/kg ethanol injection inhibits the frequency of GCaMP6f events; * indicates significant main effects, *p < 0.05, ***p < 0.001, # indicates significant post hoc tests, #p < 0.05, ##p < 0.01.
- Figure 3.
Drinking microstructure. A, Air-exposed mice are sensitive to the devaluing effects of 60 μm quinine and consumed significantly less of that solution compared with baseline. B, Following CIE exposure, mice consumed significantly more ethanol, ethanol+quinine, and ethanol+sucrose solutions. C, Compared with air-exposed mice, CIE mice consumed significantly greater amounts of the ethanol, ethanol+quinine, and ethanol+sucrose solutions. D, In air-exposed mice, drinking bout size changed depending on the drinking solution, posttests revealed that this was driven by larger bouts during ethanol+sucrose drinking. E, In CIE-exposed mice, drinking bout size changed depending on the drinking solution, posttests revealed that this was driven by larger bouts during ethanol+sucrose drinking. F, Bout sizes were significantly larger in CIE animals, posttests revealed that this was driven by increased bout sizes in ethanol+quinine and ethanol+sucrose drinking. G, The number of bouts during a drinking session was not significantly different in any of the drinking solutions for air-exposed mice. H, CIE mice initiated significantly more drinking bouts following CIE exposure when drinking any of the ethanol solutions. I, Compared with air-exposed mice, CIE mice initiated significantly more drinking bouts following CIE exposure when drinking ethanol+quinine or ethanol+sucrose. J, Lick rates during drinking sessions were not significantly different in any of the drinking solutions for air-exposed mice. K, Lick rates were significantly different in CIE-exposed mice with slower rates during ethanol+quinine. L, When compared with air-exposed mice, lick rates were not significantly different during any of the drinking solutions; * indicates significant main effects or interactions *p < 0.05, **p < 0.01, ***p < 0.001, ****p < 0.0001, # used for significant post hoc tests #p < 0.05, ##p < 0.01, ###p < 0.001, ####p < 0.0001.
- Figure 4.
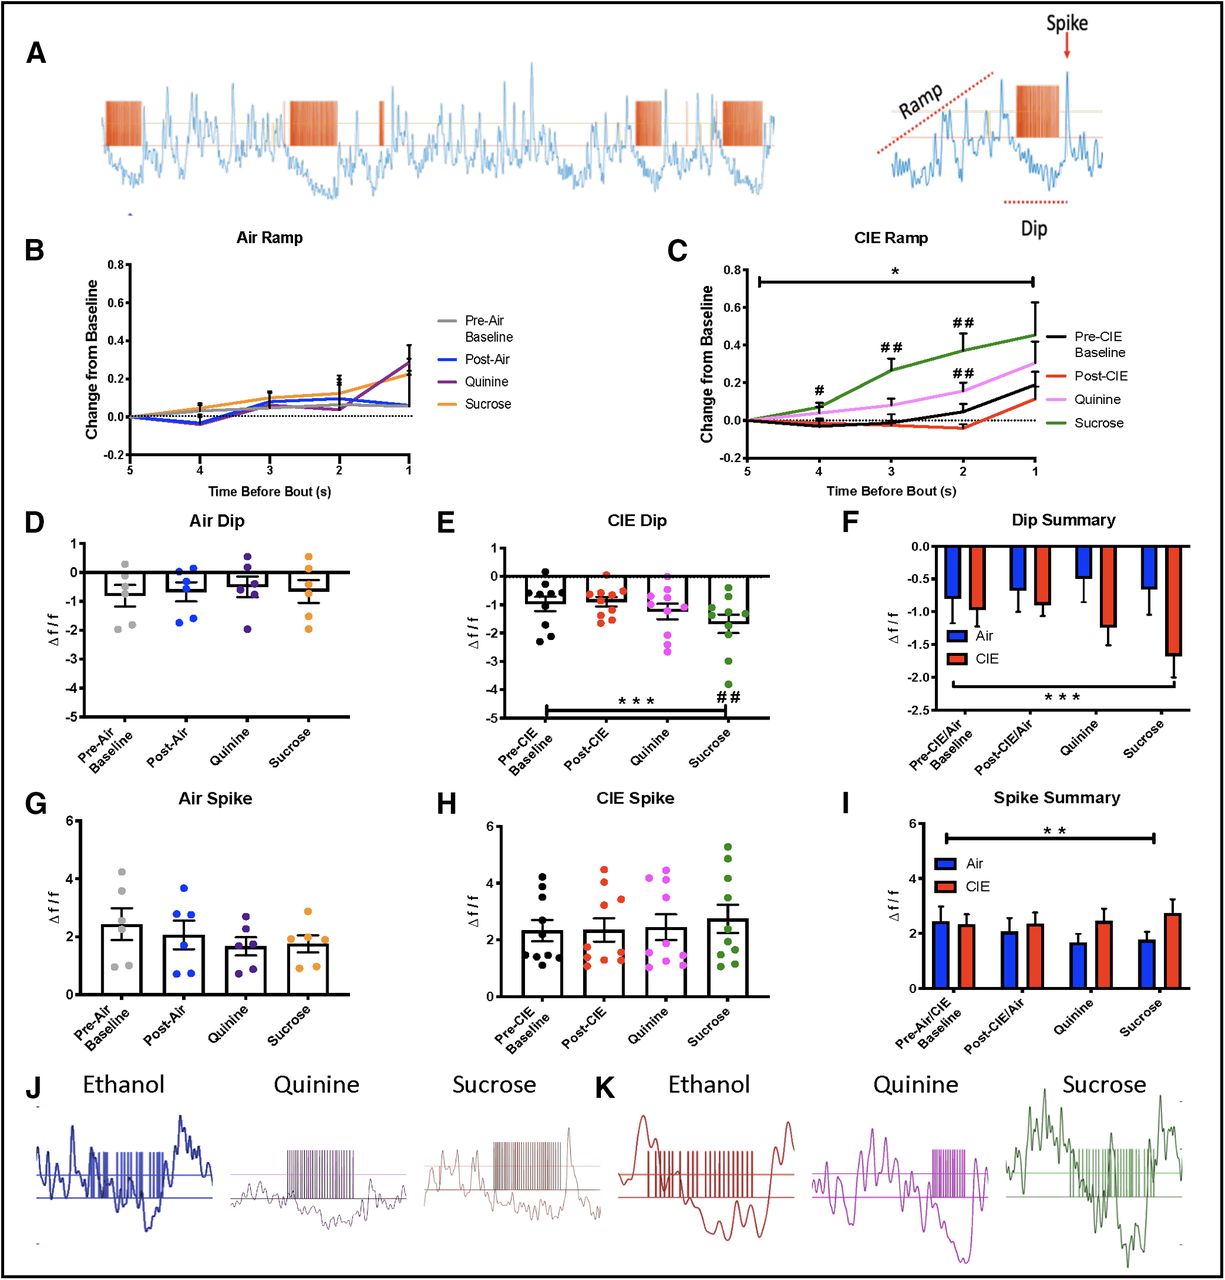
LOFC activity during operant ethanol self-administration. A, Representative trace showing LOFC GCaMP6f signal during operant drinking. Orange ticks are TTL pulses generated during licking at the ethanol port. A characteristic pattern of activity surrounded drinking bouts, with an increase in activity before drinking (Ramp) a decrease in activity during drinking (Dip) and an increase in activity after a drinking bout (Spike). B, No significant differences in the ramp up of activity preceding a drinking bout in air-exposed animals. C, The prebout ramp is significantly different in CIE animals with an earlier and larger increase in activity preceding drinking bouts with ethanol+quinine and ethanol+sucrose. D, There are no significant differences in the size of the dip during drinking bouts in air-exposed animals. E, The size of the dip is significantly different in CIE animals with a significantly larger dip during ethanol+sucrose drinking. F, There was a significant main effect of drink and a significant interaction showing larger dip size in CIE animals. G, The size of the after drinking bout spike was not significantly different across drinking sessions in air-exposed mice. H, The size of the after-drinking bout spike was not significantly different in CIE-exposed mice. I, There was a significant interaction indicating increased spike size in CIE animals. J, Exemplar traces of LOFC GCaMP6f activity in from the same air-exposed mouse during sessions of ethanol (left), ethanol+quinine (middle), and ethanol+sucrose (right) solutions. Exemplar traces of LOFC GCaMP6f activity in the same CIE-exposed mouse during sessions of ethanol (left), ethanol+quinine (middle), and ethanol+sucrose (right) solutions; * indicates significant main effects or interactions *p < 0.05, **p < 0.01, ***p < 0.001, # used for significant post hoc tests #p < 0.05, ##p < 0.01.
- Figure 5.
LOFC activity during lever pressing. A, Compared with air-exposed mice, CIE-exposed mice had significantly more lever presses during ethanol+quinine and ethanol+sucrose drinking sessions. B, Inactive lever pressing was not significantly different between air-exposed and CIE-exposed mice during any of the drinking sessions, but there was a main effect of drinking session. C, Latency between a lever press and the initiation of a drinking bout was not significantly different across drinking sessions in air-exposed mice. D, In CIE-exposed mice, the latency between a lever press and initiation of a drinking bout was significantly shorter during ethanol, ethanol+quinine, and ethanol+sucrose drinking sessions than baseline drinking sessions. E, In air-exposed mice, there were no differences in LOFC GCaMP6f activity preceding the lever press during any drinking sessions. F, In CIE-exposed mice, there was an increase in LOFC GCaMP6f activity preceding a lever press following CIE exposure during ethanol or ethanol+quinine drinking. G, In air-exposed mice, there was no difference in LOFC GCaMP6f activity immediately after a lever press during any drinking session. H, In CIE-exposed mice, there was no difference in LOFC activity immediately after a lever press during any drinking session; * indicates significant main effects or interactions **p < 0.01, ****p < 0.0001, # used for significant post hoc tests #p < 0.05, ##p < 0.01.
- Figure 6.
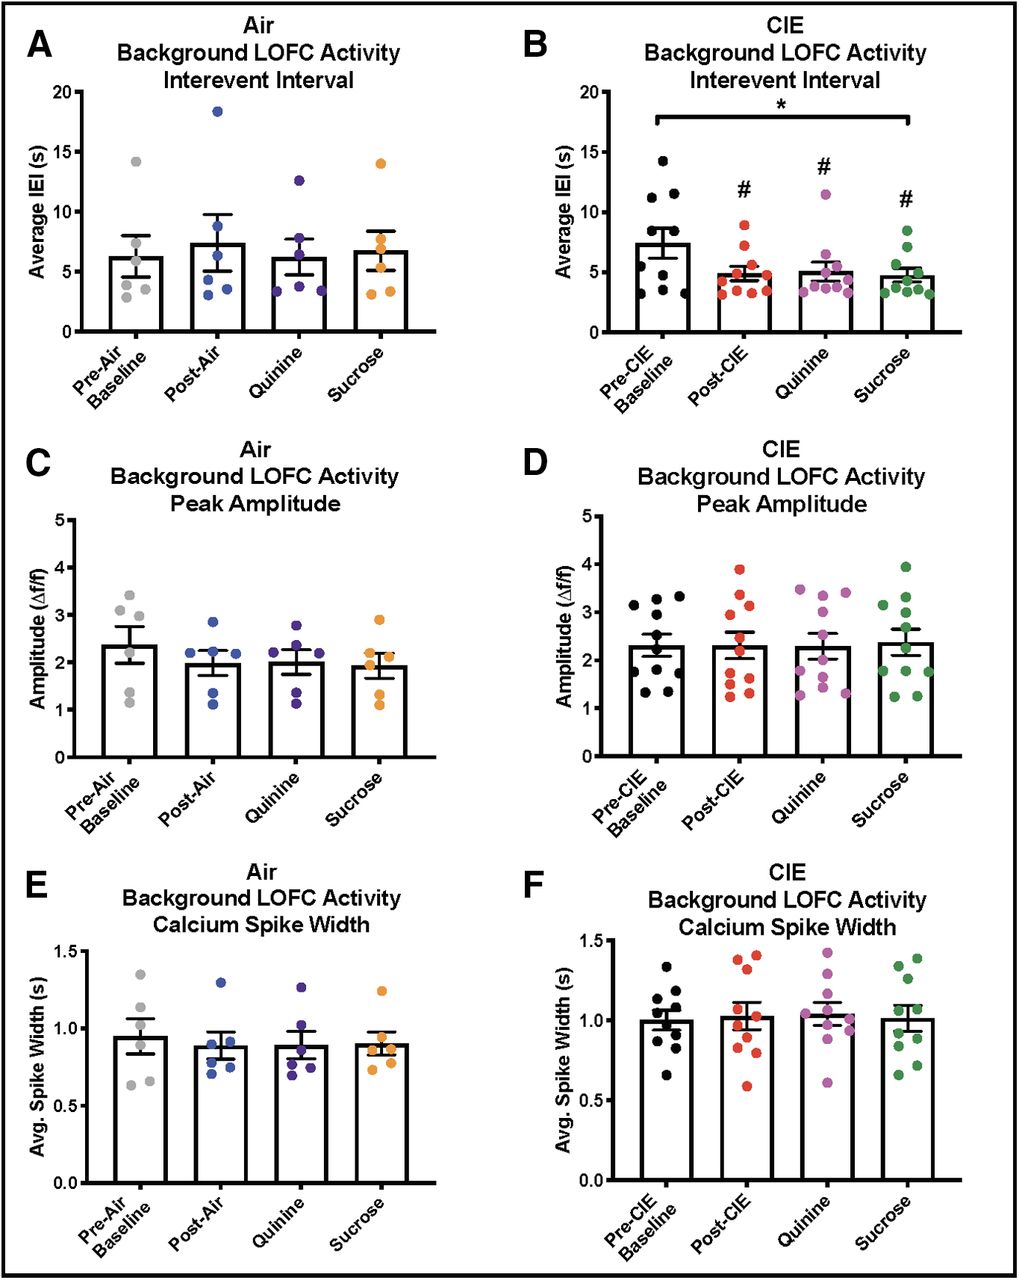
Background LOFC activity during drinking sessions. A, In air-exposed mice, there was no difference in the interevent interval of GCaMP6f calcium transients during any of the drinking sessions. B, In CIE-exposed mice, interevent intervals of GCaMP6f calcium transients were significantly shorter following CIE exposure during all drinking sessions relative to pre-CIE activity. C, In air-exposed mice, there were no differences in the amplitude of GCaMP6f calcium transients during any drinking session. D, In CIE-exposed mice, there were no differences in the amplitude of GCaMP6f calcium transients during any drinking session. E, In air-exposed mice, there were no differences in the widths of GCaMP6f calcium transients during any drinking session. F, In CIE-exposed mice, there were no differences in the widths of GCaMP6f calcium transients during any drinking session; * indicates significant main effect *p < 0.05, # used for significant post hoc test, #p < 0.05.


In this issue


