

Article Figures & Data
Figures
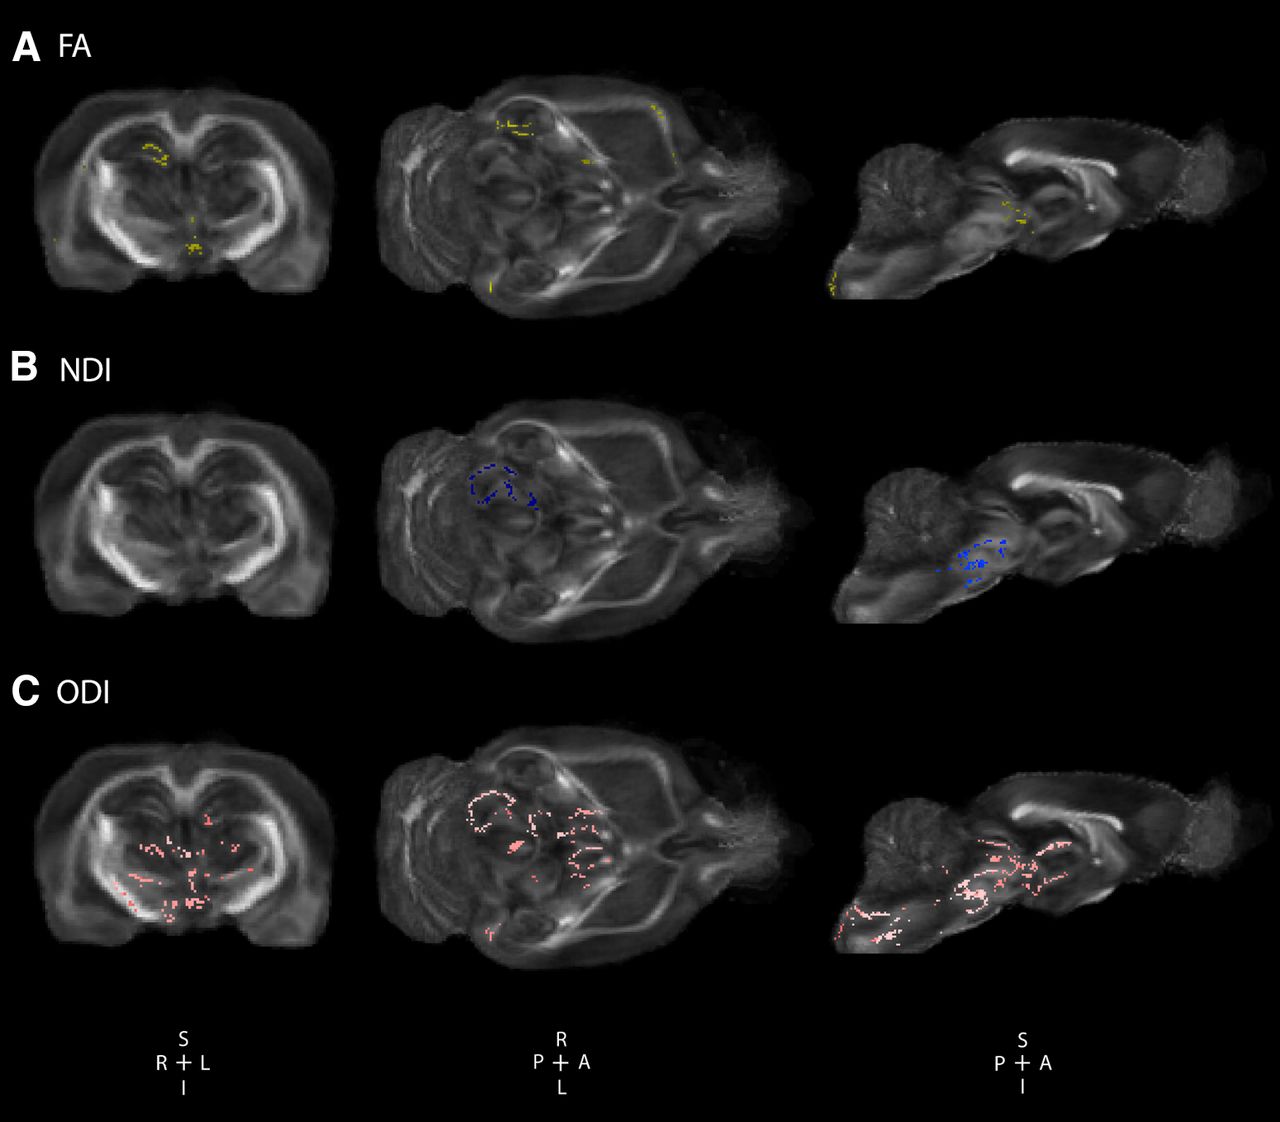
- Figure 1.
Disc1 svΔ2 engenders significant sex-specific global alterations in orientation dispersion in males. Disc1 svΔ2 in P120–P150 male rats demonstrate deficits in white matter microstructural integrity and contributes to global alterations in neurite density and orientation. A, Voxel-wise tract-based spatial statistics significant areas of decreased FA in male Disc1 svΔ2 rats (n = 6) compared with matched controls (n = 6; voxels in yellow). Representative coronal, axial, and sagittal sections reveal significant regions of decreased FA mainly in the right hippocampus, central hypothalamus, and right external capsule. B, Disc1 svΔ2 male rats demonstrated significant areas of decreased NDI compared with matched controls (voxels in blue). Representative coronal, axial, and sagittal sections reveal significant regions of decreased NDI predominantly in right substantia nigra. C, Disc1 svΔ2 male rats demonstrated significant areas of decreased ODI compared with matched controls (voxels in pink). Representative coronal, axial, and sagittal sections reveal significant regions of decreased ODI in the left hippocampus, bilateral thalamus, hypothalamus, and substantia nigra.
- Figure 2.
Disc1 svΔ2 engenders significant sex-specific global alterations in neurite density and orientation in females. Disc1 svΔ2 in P120–P150 female rats demonstrate significant increases in neurite density and orientation dispersion compared with matched controls. A, Voxel-wise TBSS reveal no areas of significant difference in female Disc1 svΔ2 rats (n = 6) compared with female controls (n = 6). B, Disc1 svΔ2 female rats demonstrated significant areas of increased NDI compared with female controls (voxels in blue). Representative coronal, axial, and sagittal sections show significant regions of increased NDI in neocortex, external capsule, corpus callosum, basal forebrain, thalamus, and hypothalamus. C, Disc1 svΔ2 female rats demonstrated significant increases in ODI compared with female controls (voxels in pink). Representative coronal, axial, and sagittal sections show significant regions of increased ODI in neocortex, external capsule, internal capsule, corpus callosum, basal forebrain, thalamus, and hypothalamus.
- Figure 3.
Disc1 svΔ2 behavioral endophenotypes reinforce patterns of sex-specific alteration in neural microstructure. A, Mean duration in open arms of the elevated-plus maze (±SEM) of wild-type male (n = 12), Disc1 svΔ2 male (n = 9), wild-type female (n = 12), and Disc1 svΔ2 female (n = 10) rats. There was a significant effect of genotype (F(1,39) = 8.081, p = 0.007). Mean duration was significantly shorter in Disc1 svΔ2 males versus wild-type males (p = 0.007), denoted by *. Mean duration was significantly shorter in Disc1 svΔ2 males versus Disc1 svΔ2 females (p = 0.032), denoted by #. B, Mean frequency in open arms of the elevated-plus maze (±SEM) of wild-type male (n = 12), Disc1 svΔ2 male (n = 9), wild-type female (n = 12), and Disc1 svΔ2 female (n = 10) rats. There was a significant effect of genotype (F(1,39) = 5.476, p = 0.025). Mean frequency was significantly lower in Disc1 svΔ2 males versus wild-type males (p = 0.008), denoted by *. Mean frequency was significantly lower in Disc1 svΔ2 males versus Disc1 svΔ2 females (p = 0.013), denoted by #. C, Mean alternation percentage in the y-maze (±SEM) of wild-type male (n = 12), Disc1 svΔ2 male (n = 9), wild-type female (n = 12), and Disc1 svΔ2 female (n = 10) rats. There was a significant effect of sex (F(1,39) = 4.875, p = 0.033) and genotype × sex interaction (F(1,39) = 5.620, p = 0.023). Mean alternation percentage was significantly lower in Disc1 svΔ2 males versus wild-type males (p = 0.005), denoted by *. Mean alternation percentage was significantly lower in Disc1 svΔ2 males versus Disc1 svΔ2 females (p = 0.002), denoted by #. D, Mean open field velocity (±SEM) of wild-type male (n = 12), Disc1 svΔ2 male (n = 9), wild-type female (n = 12), and Disc1 svΔ2 female (n = 10) rats. There was a significant effect of genotype (F(1,39) = 9.125, p = 0.004), sex (F(1,39) = 7.003, p = 0.012), and genotype × sex interaction (F(1,39) = 15.65, p < 0.001). Mean velocity was significantly higher in Disc1 svΔ2 males versus wild-type males (p < 0.001), denoted by *. E, Mean open field distance traveled (±SEM) of wild-type male (n = 12), Disc1 svΔ2 male (n = 9), wild-type female (n = 12), and Disc1 svΔ2 female (n = 10) rats. There was a significant effect of genotype (F(1,39) = 9.134, p = 0.004), sex (F(1,39) = 7.000, p = 0.012), and genotype × sex interaction (F(1,39) = 15.71, p < 0.001). Mean distance traveled was significantly higher in Disc1 svΔ2 males versus wild-type males (p < 0.001), denoted by *. F, Mean open field time spent moving (±SEM) of wild-type male (n = 12), Disc1 svΔ2 male (n = 9), wild-type female (n = 12), and Disc1 svΔ2 female (n = 10) rats. There was a significant genotype × sex interaction (F(1,39) = 18.54, p < 0.001). Mean distance traveled was significantly higher in Disc1 svΔ2 males versus wild-type males (p < 0.001) and in Disc1 svΔ2 females versus wild-type females (p = 0.022), denoted by *.


Tables
- Table 1
Disc1 svΔ2 contributes to sex-specific significant changes in neural microstructure in salient regions implicated in psychiatric illness
DTI
measureHemi ROI Mean (±SEM) p value Mean (±SEM) p value Control male Disc1 svΔ2 male Male Control female Disc1 svΔ2 female Female FA Right HC 0.22696 (±0.00393) 0.23499 (±0.00313) 0.071 0.22195 (±0.00161) 0.22138 (±0.00475) 0.456 EC 0.43209 (±0.00495) 0.44551 (±0.00385) <0.05a 0.41092 (±0.00825) 0.41625 (±0.00615) 0.308 BG 0.17118 (±0.00348) 0.17224 (±0.00498) 0.433 0.16650 (±0.00405) 0.16134 (±0.00511) 0.224 IC 0.35172 (±0.00915) 0.37733 (±0.00336) <0.05a 0.34653 (±0.00520) 0.35081 (±0.00597) 0.300 NC 0.20396 (±0.00323) 0.20222 (±0.00126) 0.314 0.19598 (±0.00312) 0.18757 (±0.00216) <0.05a CC 0.57858 (±0.01005) 0.60223 (±0.00361) <0.05a 0.55144 (±0.01868) 0.55118 (±0.01252) 0.496 Left HC 0.22532 (±0.00451) 0.23356 (±0.00281) 0.077 0.21396 (±0.00229) 0.21364 (±0.00605) 0.481 EC 0.41523 (±0.00582) 0.42855 (±0.00279) <0.05a 0.39655 (±0.00768) 0.40232 (±0.00569) 0.280 BG 0.18215 (±0.00368) 0.187 (±0.00259) 0.154 0.17617 (±0.00279) 0.16496 (±0.00326) <0.05a,b IC 0.59219 (±0.00823) 0.62837 (±0.00843) <0.01a,b 0.62386 (±0.00768) 0.62077 (±0.00764) 0.391 NC 0.20278 (±0.00302) 0.20187 (±0.00276) 0.414 0.19805 (±0.00229) 0.18935 (±0.00219) <0.05a,b CC 0.58245 (±0.01006) 0.59938 (±0.00633) 0.093 0.54712 (±0.01647) 0.55733 (±0.01176) 0.312 MD Right HC 0.38200 (±0.00305) 0.39350 (±0.00594) 0.058 0.41216 (±0.00286) 0.39116 (±0.00724) <0.05a,b EC 0.29550 (±0.00393) 0.30550 (±0.00354) <0.05a 0.32133 (±0.00423) 0.30833 (±0.01012) 0.132 BG 0.35850 (±0.00642) 0.37150 (±0.01014) 0.152 0.37466 (±0.00419) 0.36366 (±0.00762) 0.117 IC 0.31833 (±0.00514) 0.33150 (±0.00744) 0.088 0.34983 (±0.0029) 0.32733 (±0.0116) <0.05a NC 0.37100 (±0.00251) 0.37683 (±0.00582) 0.190 0.40100 (±0.00382) 0.36583 (±0.00438) <0.01a,b CC 0.23950 (±0.00255) 0.25233 (±0.00352) <0.01a,b 0.26116 (±0.00423) 0.26500 (±0.01066) 0.373 Left HC 0.38316 (±0.00396) 0.39716 (±0.00683) 0.053 0.41300 (±0.00263) 0.38983 (±0.00517) <0.01a,b EC 0.29833 (±0.00358) 0.30800 (±0.00508) 0.076 0.33433 (±0.00276) 0.31033 (±0.00486) <0.001a,b BG 0.36000 (±0.00543) 0.37216 (±0.01100) 0.172 0.38200 (±0.00372) 0.36433 (±0.00624) <0.05a IC 0.25366 (±0.00140) 0.27850 (±0.00407) <0.01a,b 0.27733 (±0.00322) 0.27216 (±0.00855) 0.292 NC 0.37333 (±0.0016) 0.38183 (±0.00611) 0.104 0.40150 (±0.00350) 0.36900 (±0.00405) <0.001a,b CC 0.23933 (±0.00374) 0.23950 (±0.00313) 0.487 0.25433 (±0.00422) 0.25333 (±0.0093) 0.462 NDI Right HC 0.28863 (±0.00618) 0.26707 (±0.00871) <0.05a 0.24767 (±0.00455) 0.28407 (±0.00956) <0.01a,b EC 0.45984 (±0.00571) 0.45174 (±0.00608) 0.177 0.42192 (±0.00873) 0.46351 (±0.00943) <0.01a,b BG 0.31123 (±0.01085) 0.29408 (±0.01434) 0.181 0.29221 (±0.00516) 0.31111 (±0.00865) <0.05a IC 0.40446 (±0.01286) 0.4146 (±0.01761) 0.326 0.38355 (±0.00917) 0.41161 (±0.01145) <0.05a NC 0.30812 (±0.00400) 0.30277 (±0.00925) 0.303 0.26590 (±0.00731) 0.32010 (±0.00613) <0.001a,b CC 0.55335 (±0.00622) 0.54253 (±0.00564) 0.114 0.51977 (±0.00761) 0.53613 (±0.00934) 0.102 Left HC 0.28052 (±0.00733) 0.26581 (±0.00928) 0.088 0.24657 (±0.00283) 0.28127 (±0.00719) <0.001a,b EC 0.46140 (±0.00636) 0.45002 (±0.00541) 0.102 0.40485 (±0.00641) 0.44984 (±0.00804) <0.001a,b BG 0.31546 (±0.00837) 0.29646 (±0.01709) 0.171 0.28374 (±0.00405) 0.30895 (±0.00511) <0.001a,b IC 0.56072 (±0.00828) 0.57002 (±0.01176) 0.266 0.59342 (±0.00829) 0.57928 (±0.01304) 0.191 NC 0.31333 (±0.00497) 0.30039 (±0.00861) 0.111 0.27232 (±0.00650) 0.31719 (±0.00547) <0.001a,b CC 0.56460 (±0.00551) 0.55457 (±0.00409) 0.087 0.52610 (±0.00581) 0.55257 (±0.01351) 0.051 ODI Right HC 0.22756 (±0.00696) 0.19927 (±0.00745) <0.01a 0.18556 (±0.00531) 0.22146 (±0.00522) <0.001a,b EC 0.16645 (±0.00415) 0.15200 (±0.00203) <0.01a,b 0.14986 (±0.00438) 0.16932 (±0.00527) <0.01a,b BG 0.32012 (±0.01118) 0.30247 (±0.01745) 0.207 0.30554 (±0.01219) 0.33371 (±0.01499) 0.088 IC 0.20721 (±0.01170) 0.18788 (±0.00966) 0.116 0.17752 (±0.00949) 0.20551 (±0.00673) <0.05a NC 0.27603 (±0.00609) 0.27409 (±0.00876) 0.430 0.23920 (±0.01224) 0.30206 (±0.0077) <0.01a,b CC 0.11298 (±0.00792) 0.10064 (±0.00210) 0.082 0.11605 (±0.01085) 0.11905 (±0.01174) 0.427 Left HC 0.22566 (±0.01036) 0.19509 (±0.00768) <0.05a 0.19621 (±0.00513) 0.23155 (±0.00736) <0.01a,b EC 0.17835 (±0.00486) 0.16079 (±0.00440) <0.05a 0.15204 (±0.00750) 0.17760 (±0.00740) <0.05a BG 0.30551 (±0.00904) 0.28399 (±0.01504) 0.124 0.28359 (±0.00900) 0.32845 (±0.01229) <0.01a,b IC 0.10624 (±0.00241) 0.08015 (±0.00521) <0.001a,b 0.07701 (±0.00452) 0.08432 (±0.00457) 0.141 NC 0.28466 (±0.00530) 0.27898 (±0.01100) 0.326 0.24563 (±0.01062) 0.30203 (±0.00728) <0.001a,b CC 0.12171 (±0.00843) 0.11224 (±0.00687) 0.202 0.12680 (±0.01136) 0.12966 (±0.00821) 0.421 All values are mean ± SEM. Units of measure for FA, MD, NDI, and ODI are 103 mm2/s. ROIs correspond to ROIs derived from the P72 UNC Atlas. Diffusion measure abbreviations: Hemi = hemisphere; FA = fractional anisotropy; MD = mean diffusivity, NDI = neurite density index; ODI = orientation dispersion index. ROI abbreviations: HC = hippocampus; EC = external capsule; BG = basal ganglia; IC = internal capsule; NC = neocortex; CC = corpus callosum. For all sample groups, n = 6.
↵a Statistically significant.
b Statistically significant after controlling the FDR with the Benjamini–Hochberg procedure (FDR = 0.05).
DTI measure Hemi ROI Mean (±SEM) p value Disc1 svΔ2 female Disc1 svΔ2 male FA Right HC 0.22138 (±0.00475) 0.23499 (±0.00313) <0.05a,b EC 0.41625 (±0.00615) 0.44551 (±0.00385) <0.01a,b BG 0.16134 (±0.00511) 0.17224 (±0.00498) 0.079 IC 0.35081 (±0.00597) 0.37733 (±0.00336) <0.01a,b NC 0.18757 (±0.00216) 0.20222 (±0.00126) <0.01a,b CC 0.55118 (±0.01252) 0.60223 (±0.00361) <0.01a,b Left HC 0.21364 (±0.00605) 0.23356 (±0.00281) <0.01a,b EC 0.40232 (±0.00569) 0.42855 (±0.00279) <0.01a,b BG 0.16496 (±0.00326) 0.18700 (±0.00259) <0.01a,b IC 0.62077 (±0.00764) 0.62837 (±0.00843) 0.260 NC 0.18935 (±0.00219) 0.20187 (±0.00276) <0.01a,b CC 0.55733 (±0.01176) 0.59938 (±0.00633) <0.01a,b MD Right HC 0.39116 (±0.00724) 0.39350 (±0.00594) 0.404 EC 0.30833 (±0.01012) 0.30550 (±0.00354) 0.399 BG 0.36366 (±0.00762) 0.37150 (±0.01014) 0.275 IC 0.32733 (±0.0116) 0.33150 (±0.00744) 0.384 NC 0.36583 (±0.00438) 0.37683 (±0.00582) 0.081 CC 0.26500 (±0.01066) 0.25233 (±0.00352) 0.143 Left HC 0.38983 (±0.00517) 0.39716 (±0.00683) 0.206 EC 0.31033 (±0.00486) 0.30800 (±0.00508) 0.374 BG 0.36433 (±0.00624) 0.37216 (±0.01100) 0.275 IC 0.27216 (±0.00855) 0.27850 (±0.00407) 0.259 NC 0.36900 (±0.00405) 0.38183 (±0.00611) 0.055 CC 0.25333 (±0.0093) 0.23950 (±0.00313) 0.095 NDI Right HC 0.28407 (±0.00956) 0.26707 (±0.00871) 0.109 EC 0.46351 (±0.00943) 0.45174 (±0.00608) 0.160 BG 0.31111 (±0.00865) 0.29408 (±0.01434) 0.167 IC 0.41161 (±0.01145) 0.4146 (±0.01761) 0.445 NC 0.32010 (±0.00613) 0.30277 (±0.00925) 0.075 CC 0.53613 (±0.00934) 0.54253 (±0.00564) 0.285 Left HC 0.28127 (±0.00719) 0.26581 (±0.00928) 0.109 EC 0.44984 (±0.00804) 0.45002 (±0.00541) 0.493 BG 0.30895 (±0.00511) 0.29646 (±0.01709) 0.250 IC 0.57928 (±0.01304) 0.57002 (±0.01176) 0.305 NC 0.31719 (±0.00547) 0.30039 (±0.00861) 0.065 CC 0.55257 (±0.01351) 0.55457 (±0.00409) 0.445 ODI Right HC 0.22146 (±0.00522) 0.19927 (±0.00745) <0.05a,b EC 0.16932 (±0.00527) 0.15200 (±0.00203) <0.01a,b BG 0.33371 (±0.01499) 0.30247 (±0.01745) 0.102 IC 0.20551 (±0.00673) 0.18788 (±0.00966) 0.083 NC 0.30206 (±0.0077) 0.27409 (±0.00876) <0.05a,b CC 0.11905 (±0.01174) 0.10064 (±0.00210) 0.077 Left HC 0.23155 (±0.00736) 0.19509 (±0.00768) <0.01a,b EC 0.17760 (±0.00740) 0.16079 (±0.00440) <0.05a BG 0.32845 (±0.01229) 0.28399 (±0.01504) <0.05a IC 0.08432 (±0.00457) 0.08015 (±0.00521) 0.280 NC 0.30203 (±0.00728) 0.27898 (±0.01100) 0.056 CC 0.12966 (±0.00821) 0.11224 (±0.00687) 0.067 All values are mean ± SEM. Units of measure for FA, MD, NDI, and ODI are 103 mm2/s. ROIs correspond to ROIs derived from the P72 UNC Atlas. Diffusion measure abbreviations: Hemi = hemisphere; FA = fractional anisotropy; MD = mean diffusivity, NDI = neurite density index; ODI = orientation dispersion index. ROI abbreviations: HC = hippocampus; EC = external capsule; BG = basal ganglia; IC = internal capsule; NC = neocortex; CC = corpus callosum. For all sample groups, n = 6.
↵a Statistically significant.
b Statistically significant after controlling the FDR with the Benjamini–Hochberg procedure (FDR = 0.05).
In this issue


