

Article Figures & Data
Figures
- Figure 1.
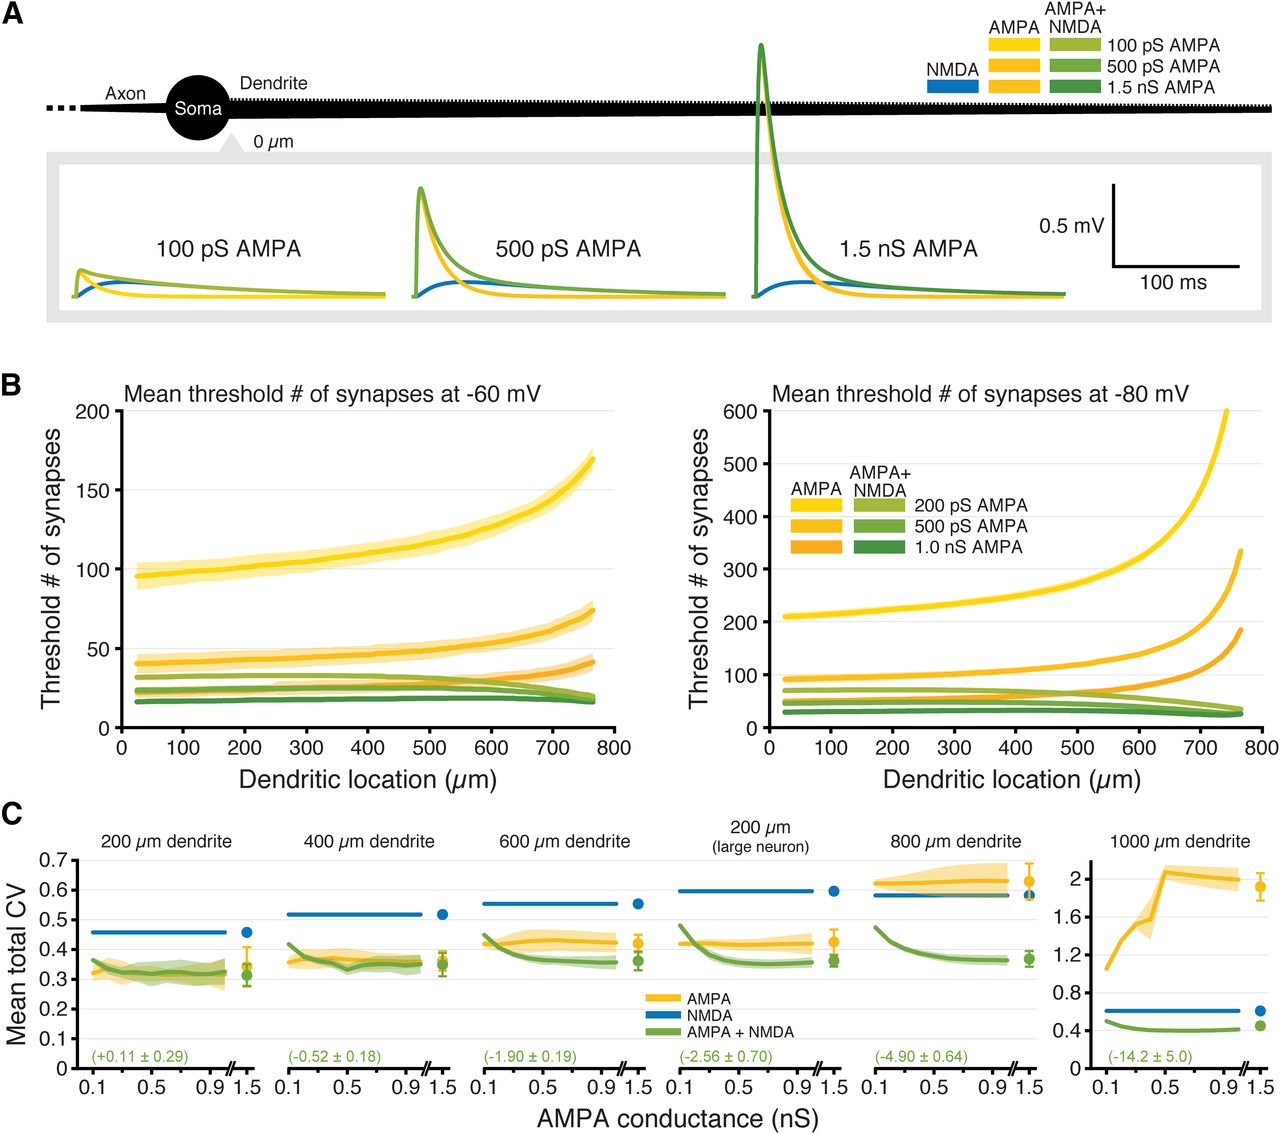
Impact of membrane potential and dendritic location on synaptic conductances and their resulting EPSPs. A, Individual synaptic inputs were activated along the dendrite (1000 μm in length) of a passive ball-and-stick model neuron (black; not to scale). Shown are somatic (bottom) and local dendritic (top) EPSPs generated by synapses placed at three dendritic locations (1, 500, and 1000 μm from the soma), at seven different RMPs (−55 to −85 mV, as indicated by color depth). AMPA-only EPSPs are shown in yellow, NMDA-only synapses are shown in blue, and inputs having both AMPA and NMDA conductance are shown in green. B, The NMDA conductances underlying the EPSPs shown in A. Inset shows the 500 pS AMPA (yellow) and NMDA (green) conductances for the AMPA+NMDA input at −55 mV at the most proximal dendritic location (shown to scale). C, Plots of the amplitudes of EPSPs having the indicated synaptic conductances measured at the soma (left) or locally at the site of synaptic input (right), versus dendritic location of the synapse. Synaptic conductances are color coded as in A for seven RMPs from −85 to −55 mV, at 5-mV intervals. Inset shows the effect sizes (d) for AMPA+NMDA EPSP amplitudes (across all dendritic locations and RMPs) and ranges (across all RMPs) relative to AMPA-only EPSPs. Colored vertical bars at margins indicate the ranges of amplitudes across all RMPs for the most proximal and most distal inputs.
- Figure 2.
Combining synaptic AMPA and NMDA conductances stabilizes EPSP-spike coupling. A, A spiny ball-and-stick neuron (black; 1000-μm dendrite) receiving progressively longer iterative trains of a spatiotemporal pattern of synaptic input. Just-threshold (thick traces) and just-subthreshold (thin traces) voltage responses in the soma for AMPA-only (yellow), NMDA-only (blue), or both AMPA and NMDA (green) synaptic conductances in response to inputs arriving within the first 50 μm of the dendrite. RMP is −70 mV. B, Somatic (B1) and dendritic (B2, top) voltage responses for identical subthreshold synaptic barrages at each dendritic location (superimposed; 20-μm intervals centered between 35 μm [black traces] and 975 μm [gray traces] from the soma) for the indicated synaptic conductance types (RMP is −70 mV). Summed total synaptic currents are shown in B2, bottom. Timings of synaptic activations are shown with semi-transparent black dots above the synaptic currents in B2. While the spatiotemporal pattern is identical for all synaptic conductances, the number of synapses activated is adjusted for each conductance such that the maximal number of synaptic inputs that remain subthreshold across all dendritic locations is delivered. When occurring at locations where they are “just-subthreshold,” somatic EPSPs can recruit somatic and axonal voltage-gated sodium conductances, producing the small peaks visible on the largest somatic EPSPs. C, Plots of the mean threshold numbers of synaptic activations necessary to initiate action potentials at different locations in the dendrite for synaptic inputs having AMPA-only (left; yellow), NMDA-only (middle; blue), or AMPA and NMDA (right; green) conductances, across seven different RMPs (−85 to −55 mV), as indicated by color depth. Mean ranges of synaptic thresholds measured across RMP (ΔRMP) or dendritic location (Δlocation; ±SDs) and effect sizes (d, in units of sAMPA-only) of conductance on ranges (for NMDA-only and AMPA+NMDA inputs) are shown in the inset. D, Plots of mean CVs (±SDs) calculated for the threshold number of synapses for each pattern of input (n = 10), across all locations within each RMPs (left), across all RMPs for each dendritic location (middle), and across all RMPs and dendritic locations (total CV; right) for inputs having AMPA-only (yellow), NMDA-only (blue), or both AMPA and NMDA (green) conductances in dendrites of the indicated lengths. Note that in the 1000-μm dendrite the CV for AMPA-only responses can be very large and off scale. The magnitudes of these large CVs are indicated next to their symbol (SD bars are to scale). The effect sizes (d) for changes in CV with AMPA+NMDA inputs (relative to AMPA-only CVs; expressed in units of sAMPA-only) are shown in green for each dendritic length.
- Figure 3.
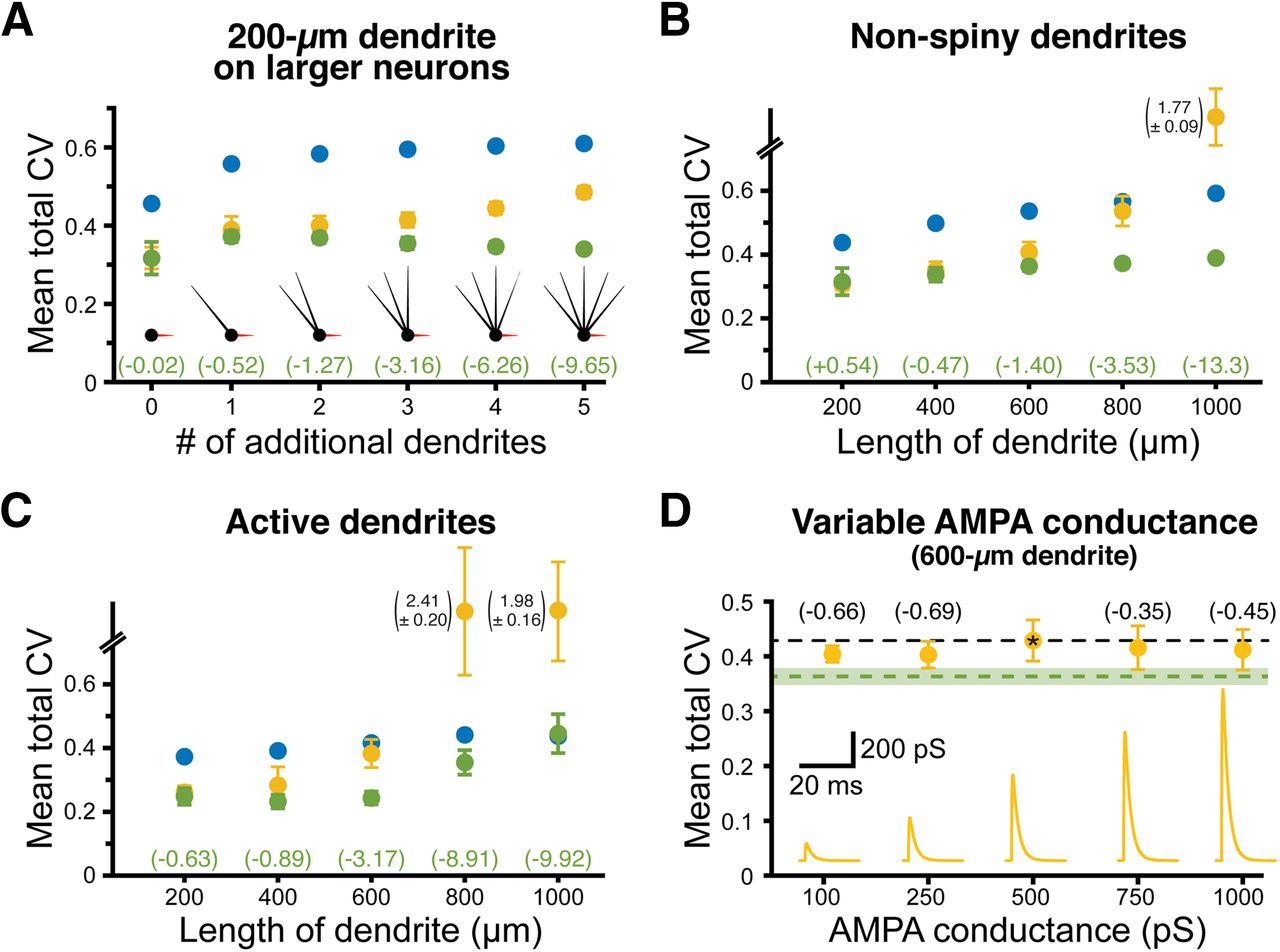
NMDA-dependent stabilization of EPSP-spike coupling is consistent across a range of model conditions and is not dependent on total synaptic conductance. A, Total CVs (±SDs) for synaptic thresholds measured across all dendritic locations and RMPs for AMPA-only (yellow), NMDA-only (blue), and AMPA+NMDA (green) synaptic inputs to a 200-μm dendrite placed on neurons having 0–5 additional dendrites (600 μm each, as indicated in inset diagrams). Effect sizes for AMPA+NMDA inputs (relative to AMPA-only inputs) are listed in green (in units of sAMPA-only). The neuron with three additional dendrites is used in later figures and referred to as the “200-μm dendrite on a larger neuron.” B, Total CVs (±SDs) for synaptic thresholds for AMPA-only (yellow), NMDA-only (blue), and AMPA+NMDA (green) inputs to non-spiny dendrites of the indicated lengths. Effect sizes for AMPA+NMDA CVs shown in green (units of sAMPA-only). C, Total CVs (±SDs) for synaptic thresholds measured across all dendritic locations and RMPs for inputs onto spiny dendrites with active conductances (see Table 1). D, Plot of mean total CVs for synaptic thresholds (±SDs) for AMPA-only EPSPs with the indicated peak conductance magnitudes in a 600-μm dendrite. Black dashed line indicates the mean CV of the standard 500 pS AMPA conductance (indicated by asterisk), while the green dashed line indicates mean total CV (with shaded SD) for AMPA (500 pS) + NMDA (1 nS) inputs in the same dendrite. Effect sizes of peak conductance manipulations, relative to the 500 pS AMPA input, are shown in black (in units of s500pS). Inset shows the AMPA conductances to scale.
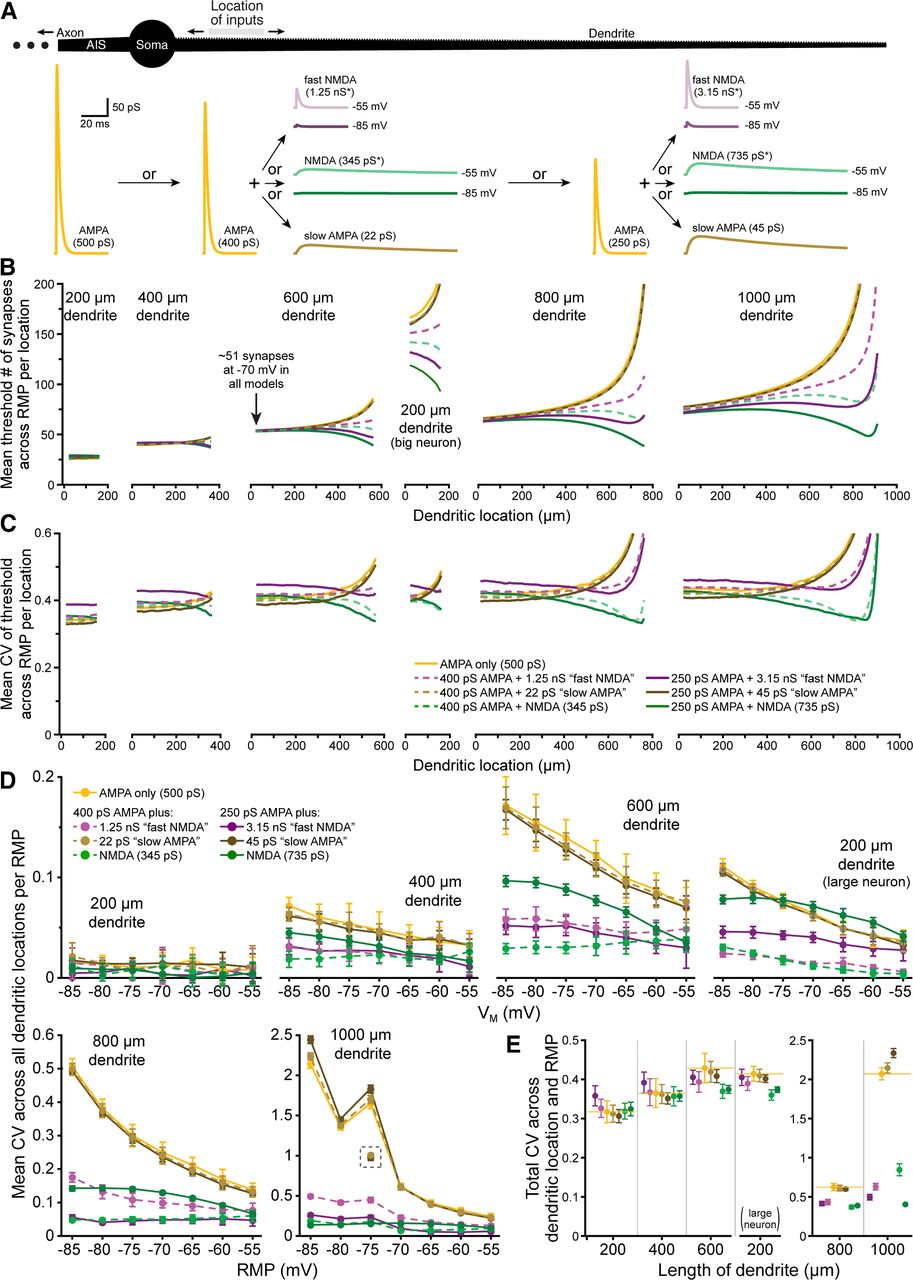
- Figure 4.
Differential impact of voltage dependence and kinetics on the fidelity of synaptic integration. A, Diagram of a ball-and-stick neuron (top) receiving spatiotemporal patterns of synaptic input to 50-μm spans of dendrite to determine the number of synaptic inputs necessary for action potential generation. Traces below show the synaptic conductances tested: a 500 pS AMPA-only conductance, a 400 pS AMPA conductance “doped” with one of three additional conductances, including a fast-NMDA conductance (*nominally 1.25 nS maximal conductance, reaching 4.6 pS at −85 mV, and 49 pS at −55 mV, as shown), a slow-AMPA conductance with NMDA kinetics (22 pS), or a nominally 345 pS NMDA conductance (*reaching 1.3 and 13.6 pS at −85 and −55 mV, respectively), or a 250 pS AMPA conductance doped with relatively larger fast-NMDA, slow-AMPA, and NMDA conductances). All conductances are shown to scale and were titrated such that each generated a mean threshold of ∼51 synapses in the proximal end of the 600-μm dendrite at −70 mV (arrow in B). B, Plots of mean synaptic thresholds for inputs across all RMPs for each 50-μm span of dendrite (incremented at 10-μm intervals) for inputs having the indicated synaptic conductances in dendrites of the indicated lengths (y-axis cut off at 200 synapses; color coding as in panel C). Note that we also tested a 200-μm dendrite attached to a large neuron having three additional 600-μm dendrites (middle plot; see also Fig. 3A). C, Plots of mean CVs for thresholds calculated across seven RMPs (−85 to −55 mV) for each color-coded synaptic conductance at each dendritic location (i.e., measures of RMP-dependent variability of threshold for each given dendritic location) for the different length dendrites (as indicated in B); y-axis cut off at 0.6. D, Plots of mean CVs (±SDs) for synaptic thresholds for each color-coded conductance measured across all dendritic locations within each RMP (i.e., a measure of location-dependent variability in threshold for each RMP). For trials in the 1000-μm dendrite at −75 mV, the 500 pS AMPA and slow AMPA models hit very high thresholds (>3000) in their most distal measurable compartment, which generated large CVs at that RMP. CVs calculated for those conductances without the last dendritic location are plotted in the gray dashed box. E, Plots of mean total CVs (±SDs) calculated across all dendritic locations and all RMPs for neurons with the indicated dendritic lengths and color-coded synaptic conductances.
- Figure 5.
Effect sizes of synaptic conductance on variability of EPSP-spike coupling across RMP and dendritic location. A, Plots of effect sizes of conductance-dependent changes in CV calculated across RMP for each dendritic location (in units of sAMPA-only; see Materials and Methods). Yellow dashed lines indicate d = 0 (i.e., identical to 500 pS AMPA-only trials), with effect sizes above that line reflecting larger-than-AMPA-only CVs, while values below the dashed-yellow lines indicate smaller-than-AMPA-only CVs. Data are from Figure 4C, and conductance types are similarly indicated by color. Effect sizes of our normal AMPA (500 pS) conductance combined with 1 nS NMDA (i.e., from Fig. 2C) are also shown with thick gray semi-transparent lines. Inputs with the fast-NMDA conductance tended to generate more variability in synaptic thresholds across RMP, especially in short or proximal dendrites, while inputs with slow kinetics exhibited smaller CVs relative to AMPA-only inputs. Combining voltage dependence with slow kinetics (e.g., green and gray NMDA traces) reduced variability in synaptic thresholds across RMP at all locations in most dendrites. Plots for the 1000-μm dendrite are truncated at −20 sAMPA-only. B, Plots of effect sizes for changes in CV calculated across all dendritic locations within each RMP for data shown in Figure 4D (conductance types indicated by color, as in A). Voltage-dependent conductances greatly reduced threshold variability across location within a given RMP (an effect magnified at hyperpolarized RMPs), whereas slow kinetics in the absence of voltage dependence had little effect.
- Figure 6.
Impact of synaptic conductance on synaptic integration in realistic neuron morphologies. A, Plots of the mean threshold number of synaptic activations necessary to depolarize the soma of a CA3 pyramidal neuron by 3 mV at progressively more distal 50-μm dendritic segments (along red dendrites in diagram at left) experiencing ten static-random spatiotemporal patterns of synaptic input. Colors (yellow, blue, and green) indicate simulations with AMPA, NMDA, and both AMPA and NMDA conductances, respectively, at three different RMPs (−60, −70, and −80 mV); y-axes are truncated at 150 synapses to show differences in proximal dendrites. B, Plots of mean CVs for synaptic thresholds calculated across seven RMPs (−85 to −55 mV) for each dendritic location. Synaptic conductances indicated by color, with shaded regions indicating SDs. The mean effect size (d, in units of sAMPA-only) for CVs from AMPA-plus-NMDA simulations (relative to AMPA-only conductance) is shown in green at the bottom of the graph. C, Comparisons of mean (±SD) CVs calculated for synaptic thresholds across dendritic locations within each of seven RMPs. Colors as in B. Effect sizes for AMPA-plus-NMDA trials (vs AMPA-only inputs) are shown in green at top for each RMP (units of sAMPA-only). D, Plots of the threshold number of synaptic activations necessary to drive a 5-mV somatic depolarization in a dentate granule neuron (red dendrites in diagram to left) at progressively more distal 50-μm segments experiencing ten expanding static-random spatiotemporal patterns of synaptic input. Colors as in B. E, Plots of mean CVs (with SD in shaded regions) of synaptic thresholds measured across seven RMPs for each dendritic location in the dentate granule neuron. Synaptic conductances indicated by color. F, Comparisons of mean CV (±SD) for synaptic thresholds calculated across dendritic location within each of seven RMPs in the granule neuron. Effect sizes of AMPA-plus-NMDA inputs (relative to AMPA-only inputs) are indicated in green at top for each RMP (units of sAMPA-only).
- Figure 7.
NMDA-dependent stabilization of EPSP-spike coupling occurs over a range of AMPA-to-NMDA conductance ratios. A, Somatic EPSPs generated at −70 mV by proximal inputs having the indicated maximum AMPA conductances (maximal NMDA conductance held steady at 1 nS) in a ball-and-stick neuron (black; not drawn to scale). B, Plots of the mean number of synaptic activations necessary to fire an action potential (±SDs; shaded regions) in an 800-μm-long ball-and-stick neuron resting at −60 mV (left) or −80 mV (right) with peak AMPA conductance set to 0.2, 0.5, or 1 nS, either alone (yellow) or together with a 1 nS NMDA conductance (green); y-axes limited to 200 (left) or 600 (right) synapses to show differences in proximal locations. C, Plots of mean CVs for thresholds (±SDs; shaded regions) for each dendritic length (including the 200-μm dendrite on a large neuron with three additional 600-μm dendrites) for inputs having AMPA-only (yellow) or AMPA plus NMDA (green) conductances as a function of maximal AMPA conductance (0.1–1.5 nS). Mean effect sizes for AMPA+NMDA inputs (relative to AMPA-only inputs; ±SDs) calculated for all AMPA conductances ≥400 pS are shown in green. As a reference, the CV (±SD) for NMDA-only synapses is shown in blue. Note the y-axis scale change for the 1000-μm dendrite.
- Figure 8.
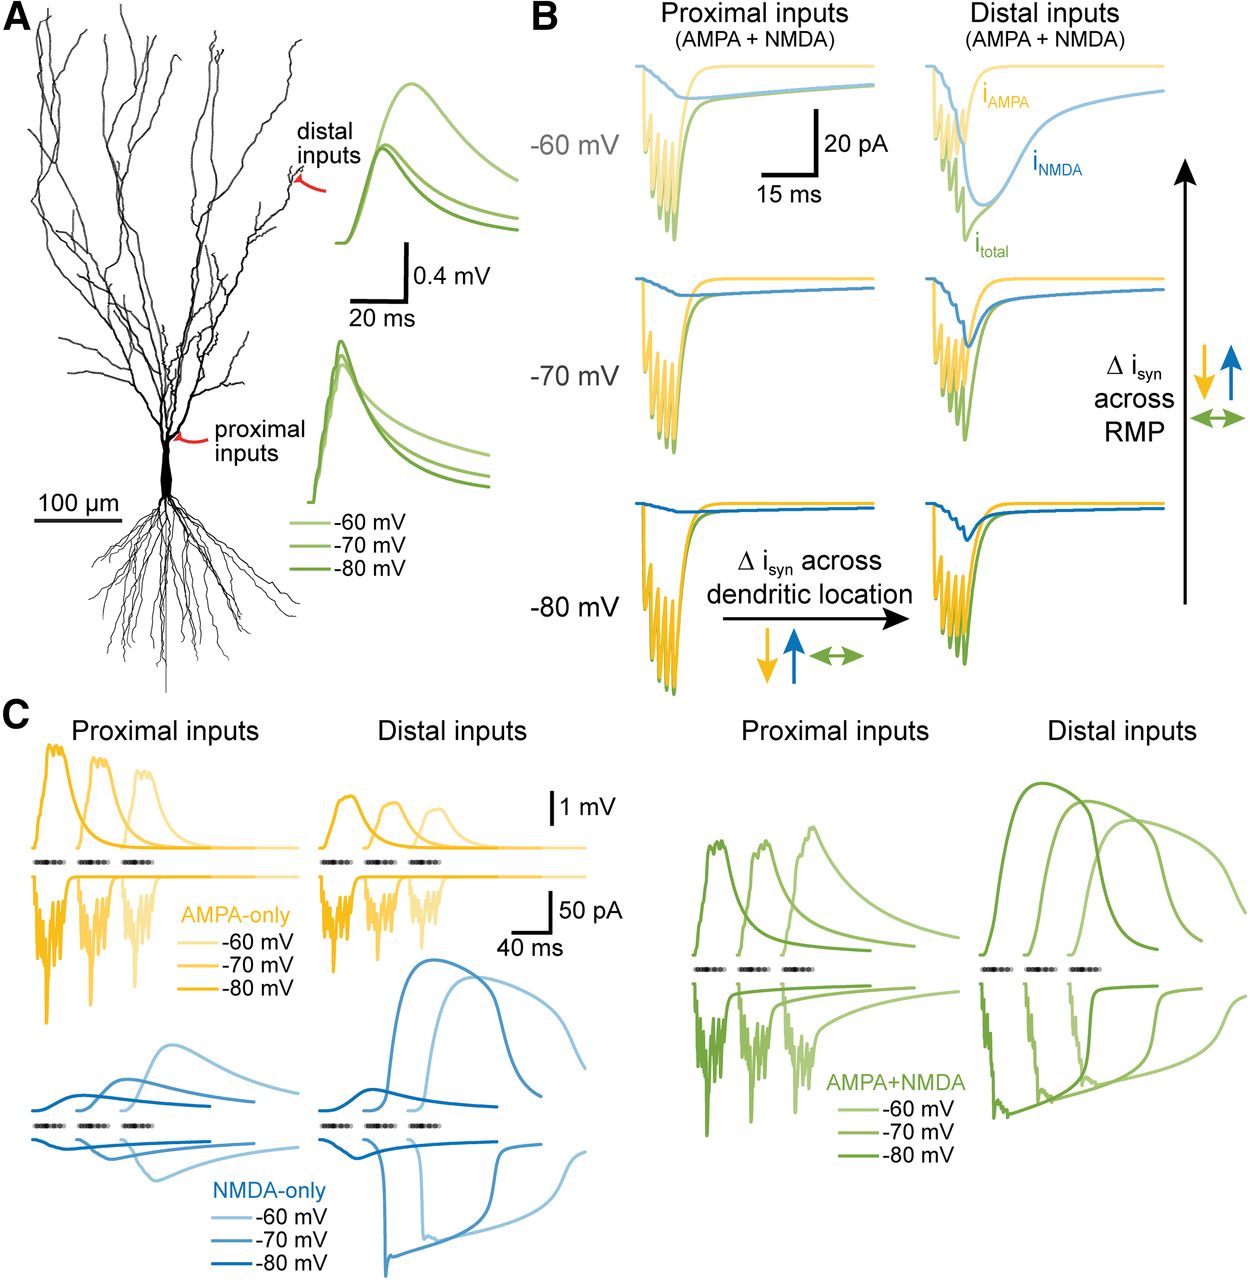
Summary of NMDA-dependent stabilization of synaptic integration across dendritic location and RMP. A, Morphology of a CA3 neuron indicating the locations of proximal and distal synaptic inputs to the apical dendrite. Traces at right show the somatic responses to sequential activation of five AMPA+NMDA synapses at neighboring spines (at 2-ms intervals, distal to proximal) at three different RMPs (as indicated by color depth) for each input location (distal vs proximal) in a fully passive model. B, Synaptic currents (isyn) generated by activation of the five proximal (left) or five distal (right) inputs at three RMPs. Total synaptic currents (itotal) are shown in green, with AMPA (iAMPA; yellow) and NMDA (iNMDA; blue) components superimposed. Notice that AMPA currents are reduced (yellow arrows), while NMDA currents are enhanced (blue arrows), as inputs are moved from proximal to distal locations, or as RMP is depolarized from −80 to −60 mV. These opposing effects of location and RMP limit the variability of the total synaptic current across location and RMP (green arrows). C, Similar to B, but showing somatic voltage responses (upper traces) and summed synaptic currents (lower traces) for a barrage of 25 synaptic inputs with stochastic timings and spine locations for AMPA-only (yellow), NMDA-only (blue), or AMPA+NMDA (green) inputs. Timings of synapses indicated with semi-translucent dots above current traces. Note how AMPA-only currents and somatic EPSPs (yellow) get smaller with depolarization or distance from the soma, while NMDA-only currents and EPSPs (blue) get larger with distance and depolarization. Combining AMPA and NMDA conductance (green) leads to less variation in the amplitudes of both synaptic current and somatic EPSPs across RMPs and/or dendritic locations.


Tables
Neuron morphology Compartment Dimensions (l × w) Number of
segmentsActive properties (max. conductance) Ball-and-stick* Soma 20 × 10 μm 3 Na+: 100 pS/μm2
K+: 100 pS/μm2Dendrite 200–1000 μm, tapering
from 5 to 1 μm1 per μm Typically passive. Figure 3C: Na+ and
K+ with linear decrease (100–10 pS/μm2).CA3* and dentate granule
neuronsSoma As reconstructed 3 Na+: 100 pS/μm2
K+: 100 pS/μm2Dendrites As reconstructed 1 per μm Passive All morphologies Spines Neck: 1 × ∼0.05 μm
Head: 0.5 × 0.5 μm1
1As in parent dendritic compartment AIS 40 μm, tapering from 2 to
0.5 μm40 Na+: 100 pS/μm2 (1st 5 μm) or 8000 pS/μm2
K+: 100pS/μm2 (1st 5 μm) or 2000 pS/μm2Axon 2000 × 0.5 μm 201 Na+: 300 pS/μm2
K+: 60 pS/μm2Listed are the parameters for model neurons used in this study. General model parameters: RM = 15 kΩ•cm2; CM = 1 μF/cm2; Ri = 100 Ω•cm; Epas = −55 to −85 mV, as indicated in text; time steps, 10 or 25 μs; nominal temperature 37°C. *The ball-and-stick model in Figure 1 and the CA3 neuron in Figure 8 are purely passive (including in somata and axons).
Dendritic length (μm) Conductance gAMPA Mean
“total” CVSD Effect
size (d)gAMPA Mean
“total” CVSD Effect
size (d)200 AMPA-only ● 500 0.317 0.048 AMPA + fast NMDA 400 ● 0.326 0.023 0.325 250 ● 0.358 0.025 1.469 AMPA + slow AMPA 400 ● 0.313 0.022 –0.169 250 ● 0.306 0.017 –0.394 AMPA+NMDA 400 ● 0.319 0.020 0.057 250 ● 0.325 0.017 0.263 400 AMPA-only ● 500 0.365 0.280 AMPA + fast NMDA 400 ● 0.367 0.034 0.060 250 ● 0.392 0.027 0.721 AMPA + slow AMPA 400 ● 0.363 0.024 –0.071 250 ● 0.352 0.014 –0.371 AMPA+NMDA 400 ● 0.357 0.024 –0.223 250 ● 0.358 0.013 –0.205 600 AMPA-only ● 500 0.429 0.038 AMPA + fast NMDA 400 ● 0.394 0.026 –0.940 250 ● 0.406 0.018 –0.623 AMPA + slow AMPA 400 ● 0.420 0.027 –0.253 250 ● 0.409 0.016 –0.546 AMPA+NMDA 400 ● 0.370 0.018 –1.578 250 ● 0.375 0.010 –1.450 200 (on large neuron) AMPA-only ● 500 0.414 0.019 AMPA + fast NMDA 400 ● 0.390 0.018 –1.308 250 ● 0.405 0.021 –0.476 AMPA + slow AMPA 400 ● 0.410 0.016 –0.222 250 ● 0.402 0.010 –0.666 AMPA+NMDA 400 ● 0.360 0.013 –2.886 250 ● 0.374 0.007 –2.140 800 AMPA-only ● 500 0.625 0.046 AMPA + fast NMDA 400 ● 0.434 0.035 –4.131 250 ● 0.415 0.027 –4.535 AMPA + slow AMPA 400 ● 0.612 0.037 –0.283 250 ● 0.601 0.020 –0.520 AMPA+NMDA 400 ● 0.369 0.023 –5.537 250 ● 0.389 0.010 –5.104 1000 AMPA-only ● 500 2.071 0.076 AMPA + fast NMDA 400 ● 0.630 0.041 –18.964 250 ● 0.495 0.036 –20.737 AMPA + slow AMPA 400 ● 2.147 0.065 1.002 250 ● 2.337 0.058 3.493 AMPA+NMDA 400 ● 0.847 0.077 –16.111 250 ● 0.405 0.010 –21.928 Listed are the mean “total” CVs, SDs, and effect sizes (relative to AMPA-only synapses) for synaptic thresholds calculated across all dendritic locations and all RMPs averaged from 10 patterns of synaptic input for each type of synaptic conductance (color coded to data in Fig. 4E). Effect sizes (d) indicate the normalized mean difference in CV relative to the CV for the 500 pS AMPA-only conductance, in units of sAMPA-only (see Materials and Methods). Sign indicates the direction of change [larger (+) or smaller (–) mean CVs than AMPA-only inputs]. Light shading (blue = smaller CVs, red = larger CVs) identifies manipulations generating mean changes in CV >0.5 SD, while darker shadings indicate mean changes >1.0 SD of the AMPA-only result. Note that AMPA+NMDA conductances generated consistently larger reductions in CV relative to manipulations that provided voltage dependence or slower kinetics alone. The large neuron with a 200-μm dendrite (tested) included three additional 600-μm dendrites (as in Fig. 3A).
Extended Data 1
Code used for key simulations in this article, also available online at http://modeldb.yale.edu/266802. Download Extended Data 1, ZIP file.
In this issue


