

Abstract
Experiments in primary culture have helped advance our understanding of the curious phenomenon of cell cycle-related neuronal death. In a differentiated postmitotic cell such as a neuron, aberrant cell cycle reentry is strongly associated with apoptosis. Indeed, in many pathologic conditions, neuronal populations at risk for death are marked by cells engaged in a cell cycle like process. The evidence for this conclusion is typically based on finding MAP2+ cells that are also positive for cell cycle-related proteins (e.g., cyclin D) or have incorporated thymidine analogs such as bromodeoxyuridine (BrdU) or 5-ethynyl-2’-deoxyuridine (EdU) into their nuclei. We now report that we and others may have partly been led astray in pursuing this line of work. Morphometric analysis of mouse embryonic cortical cultures reveals that the size of the “cycling” MAP2+ cells is significantly smaller than those of normal neurons, and their expression of MAP2 is significantly lower. This led us to ask whether, rather than representing fully developed neurons, they more closely resembled precursor-like cells. In support of this idea, we find that these small MAP2+ cells are immunopositive for nestin, a neuronal precursor marker, Olig2, an oligodendrocyte lineage marker, and neural/glial antigen 2 (NG2), an oligodendrocyte precursor marker. Tracking their behavior in culture, we find that they predominantly give rise to GFAP+ astrocytes instead of neurons or oligodendrocytes. These findings argue for a critical reexamination of previous reports of stimuli that lead to neuronal cell cycle-related death in primary cultures.
Significance Statement
While many laboratories use cultures of rodent embryonic cortex to study the cell biology of brain function, few attend to the identity of the cells in their cultures. We find that a subpopulation of small MAP2-weakly-positive cells, presumed for decades to be neurons, are actually neural/glial antigen 2 (NG2)+Olig2+Nestin+ precursor cells that give rise over time mostly to astrocytes. Subjecting the cultures to a challenge meant to mimic an in vivo cell cycle-related neuronal death, we find the percentage of “cycling” MAP2+ cells does indeed increase, but only because large MAP2+ cells (true neurons) die with no change in their mitotic activity. The MAP2+ precursors remain constant in number and in cell cycle activity. This argues for re-interpretation of experimental neuronal culture data.
Introduction
A substantial number of studies have agreed that re-initiation of a cell cycle process in postmitotic cells such as neurons is tightly associated with apoptosis. This concept has been extended to suggest that cycle-related neuronal death contributes to the pathogenesis of several neurodegenerative disorders including Alzheimer’s disease (AD; Busser et al., 1998; Herrup and Yang, 2007), Parkinson’s disease (Höglinger et al., 2007), ALS (Ranganathan et al., 2001), and others. While the correlations in vivo (in humans, mice, and flies) are robust, the detailed molecular mechanisms linking neuronal loss of cycle control to neuronal death are not yet fully understood. In search of these mechanisms, researchers have frequently turned to studies using primary neuronal cultures, primarily of embryonic neocortex or hippocampus. This approach offers a simple and reliable system that allows the manipulation of the cells and their environment. They are usually isolated at late embryonic or early postnatal ages near the end of the neurogenic phase of development. The choice of this early time of harvest is driven by the fact that at this stage, the young postmitotic neurons have not yet developed extensive processes and are relatively resistant to damage during the dissociation protocol (Sciarretta and Minichiello, 2010). While the precise embryonic age chosen for the harvest can impact the identity of the neurons in the culture (Romito-DiGiacomo et al., 2007), most studies involved use embryonic day (E)16.5 mouse embryos or an equivalent gestational age of rat embryos. Culture media have been optimized to specifically favor the long-term survival and growth of fully differentiated neurons over other cell types (Brewer, 1995). Neurons isolated by these procedures remain postmitotic and form functional synapses after maturation making it possible to investigate neuronal development, aging, and death in vitro (Lesuisse and Martin, 2002; Dajas-Bailador et al., 2008, 2012; Garwood et al., 2011). Despite this, and even after harvesting on the same gestational day, in the most widely used protocols the resulting preparations contain a diverse and changing set of cell types including astrocytes and oligodendrocyte precursor cells (OPCs) whose percentages change over time in culture (Hui et al., 2016).
Several models based on embryonic cortical culture have been used to investigate cycle-related neuronal death in AD. To generate an in vitro model of AD, researchers frequently use the Aβ peptide as a stimulus as it has been reported to induce cell cycle reentry of cultured neurons (Copani et al., 1999; Giovanni et al., 1999; Varvel et al., 2008; Zhang et al., 2008; Bhaskar et al., 2009; Seward et al., 2013; Norambuena et al., 2017). A less-frequently used model is based on Aβ-mediated neuroinflammation. Proinflammatory factors released by Aβ-stimulated microglia have also been used to trigger cell cycle-related death in cultured neurons (Wu et al., 2000; Seward et al., 2013; Bhaskar et al., 2014; Hui et al., 2016; Norambuena et al., 2017; Koseoglu et al., 2019; Zhu et al., 2019).
In vivo and under normal conditions in vitro, mature neurons never divide. Therefore, a cell that becomes immunopositive for a cell cycle regulatory protein (e.g., a cyclin) is presumed to have lost its cell cycle suppression and re-entered a cell cycle. Viewing this process by immunocytochemistry is superior to techniques such as Western blotting or flow cytometry since it reveals a clear cell-by-cell picture of protein localization and neuron morphology. In addition to cell cycle proteins, bromodeoxyuridine (BrdU)/5-ethynyl-2’-deoxyuridine (EdU) incorporation has also been widely used to detect cell cycle events. To verify that cycling neurons die, BrdU+ neurons were double-labeled with the apoptotic markers cleaved caspase-3 or terminal deoxynucleotidyl transferase-mediated biotinylated UTP nick end labeling (TUNEL; Wu et al., 2000). Consistent with the suggestion that the dividing neurons were dying, BrdU+ neurons in culture are smaller in size and lose MAP2+ processes (Bhaskar et al., 2009).
In reviewing this rather extensive literature, we became intrigued that photomicrographs that illustrate the cycling neurons consistently showed cells that were considerably smaller than their non-cycling neighbors, with fewer and shorter processes. While this seemed reasonable, as the cycling neurons would be expected to be unhealthy (Varvel et al., 2008; Bhaskar et al., 2009, 2014; Hui et al., 2016; Norambuena et al., 2017), several findings in our lab led us to question this assumption. We realized that no study, including our own, provided evidence that these small cycling neurons came from normal healthy neurons.
We report here that the “dividing” MAP2+ cells are not actual mature cortical neurons. Though positive for MAP2, they are also immunopositive for nestin, Olig2, and neural/glial antigen 2 (NG2). They thus are more accurately seen as progenitor cells. We find that with time, rather than dying, they differentiate into astrocytes. Our data emphasize the importance of re-examining and more carefully defining the cell types present in primary cortical culture and suggest that many of the conclusions reached in previous in vitro studies of neuronal cell cycle activity may have to be re-examined.
Materials and Methods
Animals and primary cortical neuronal culture
The C57BL/6 mice were maintained and bred in in the Animal and Plant Care Facility of The Hong Kong University of Science and Technology (HKUST). Primary cortical cultures were performed following standard protocols as described (Hui et al., 2016). Cervical dislocation was performed to kill the pregnant female C57BL/6 mice, followed by isolation of embryonic mice. Isolated cerebral cortices from E16.5 or P5 C57BL/6 mice were dissociated into single cells by digestion with 0.25% trypsin-EDTA (Thermo Fisher Scientific) and gentle trituration. After neutralization with DMEM containing 10% fetal bovine serum (FBS; Thermo Fisher Scientific), cells were suspended in Neurobasal medium supplemented with B27 and 2 mm GlutaMAX (Thermo Fisher Scientific), and then seeded on glass coverslips or dishes coated with poly-L-lysine (Sigma). Half of the medium was replaced with fresh every 5 d.
THP-1 cell culture and conditioned medium
Human THP-1 monocytes were grown in RPMI 1640 medium (Thermo Fisher Scientific) supplemented with 10% FBS and 0.05 mm β-mercaptoethanol (Sigma) at 37°C in a humidified 5% CO2 atmosphere. The conditioned medium was prepared as described previously (Zhu et al., 2019). To stimulate the THP-1 cells, 2.27 μl of 220 μm fibrillar Aβ1–42 (rPeptide) was added to the surface of each well of a 24-well plate and allowed to air dry. THP-1 cells were plated on the Aβ-coated well surface at a density of 100,000 cells per well and cultured in Neurobasal medium for 3 d. The medium was removed, and after centrifugation, the supernatant (5%, v/v) was used to treat neuronal cultures for 24 h.
Histology, cell fixation, and immunofluorescence
Postnatal day (P)5 C57BL/6 mouse pups were perfused with ice-cold PBS. After perfusion, the brains were dissected and immersed in 4% paraformaldehyde (PFA; Sigma) at 4°C overnight. The fixed brains were cryoprotected by incubating in PBS containing 30% sucrose at 4°C overnight, followed by embedding in OCT. After cryostat sectioning at 10 μm, samples were either used immediately for immunohistochemistry or stored at −80°C. Before immunofluorescence, sections were heated to 95°C in citrate buffer (pH 6.0) for 10 min for antigen retrieval. To prepare them for immunostaining, cortical neuron cultures were first washed in PBS, then fixed in ice-cold 4% PFA for 20 min.
To immunostain, cells or brain sections were blocked with 5% donkey serum in PBS containing 0.3% Triton X-100 at room temperature (RT) for 1 h and then incubated with primary antibodies in blocking solution at 4°C overnight. After rinsing with PBS, samples were incubated with fluorophore-conjugated secondary antibodies at RT for 1 h, followed by three washes in PBS and counter-staining with DAPI for 5 min. After rinsing, samples were mounted with Hydromount media (National diagnostics). Images were taken using Leica TCS SP8 confocal laser scanning microscope (63×, Z-stack specifically for IHC of P5 mouse brain sections) or Olympus DP80 fluorescent microscope (20×). For IHC of P5 mouse brain sections, the gray matter of cortex was imaged.
EdU-incorporation assay
EdU was used to monitor DNA synthesis in the cultured cortical neurons; 5 μm EdU was added to the cell culture for 6 h before fixation with 4% PFA. EdU labeling was performed according to the manufacturer’s protocol using the Click-iT EdU assay kit (Thermo Fisher Scientific). After EdU labeling, the samples were processed for immunofluorescence or DAPI labeling as described above.
Measurement of sizes of the MAP2+ cells
To measure cell size, neurons were stained with MAP2, and the boundaries of the labeled cells were marked using the free-hand selection tool of the Fiji software package. The selected region area was tabulated separately for MAP2+ cells that were positive or negative for cell cycle markers. Size-frequency histograms were then assembled with bin sizes of 20 μm2.
Antibodies
Prmary antibodies against Ki67 (#ab15580, RRID: AB_443209), cyclin D1 (#ab16663, RRID: AB_443423), cyclin A2 (#ab181591), PCNA (#ab29, RRID: AB_303394), MAP2 (#ab5392, RRID: AB_2138153), Nestin (#ab6142, RRID: AB_305313), GFAP (#ab7260, RRID: AB_305808), and β-III tubulin (#ab78078, RRID: AB_2256751) were purchased from Abcam. Mouse anti-GFAP (#G3893, RRID:AB_477010) antibody was purchased from Sigma. Olig2 (#AB9610, RRID: AB_570666) and NG2 (#AB5320, RRID: AB_91789) antibodies were purchased from Millipore. Alexa Fluor 488 or 647-conjugated secondary antibodies were purchased from Thermo Fisher Scientific. Anti-chicken Cy3 antibody was purchased from Jackson ImmunoResearch.
Statistical analysis
Statistical analysis was performed using Prism 6 (GraphPad software) with further details provided in Results and statistical table in Table 1. Data from at least three independent experiments were presented as mean ± SEM. Differences between each group were assessed with unpaired Student’s t test or one-way ANOVA; p < 0.05 was considered statistically different; *p < 0.05, **p < 0.01, ***p < 0.001, ****p < 0.0001.
Statistical tests used in this study
Results
Cycling MAP2+ cells are distinct from neurons
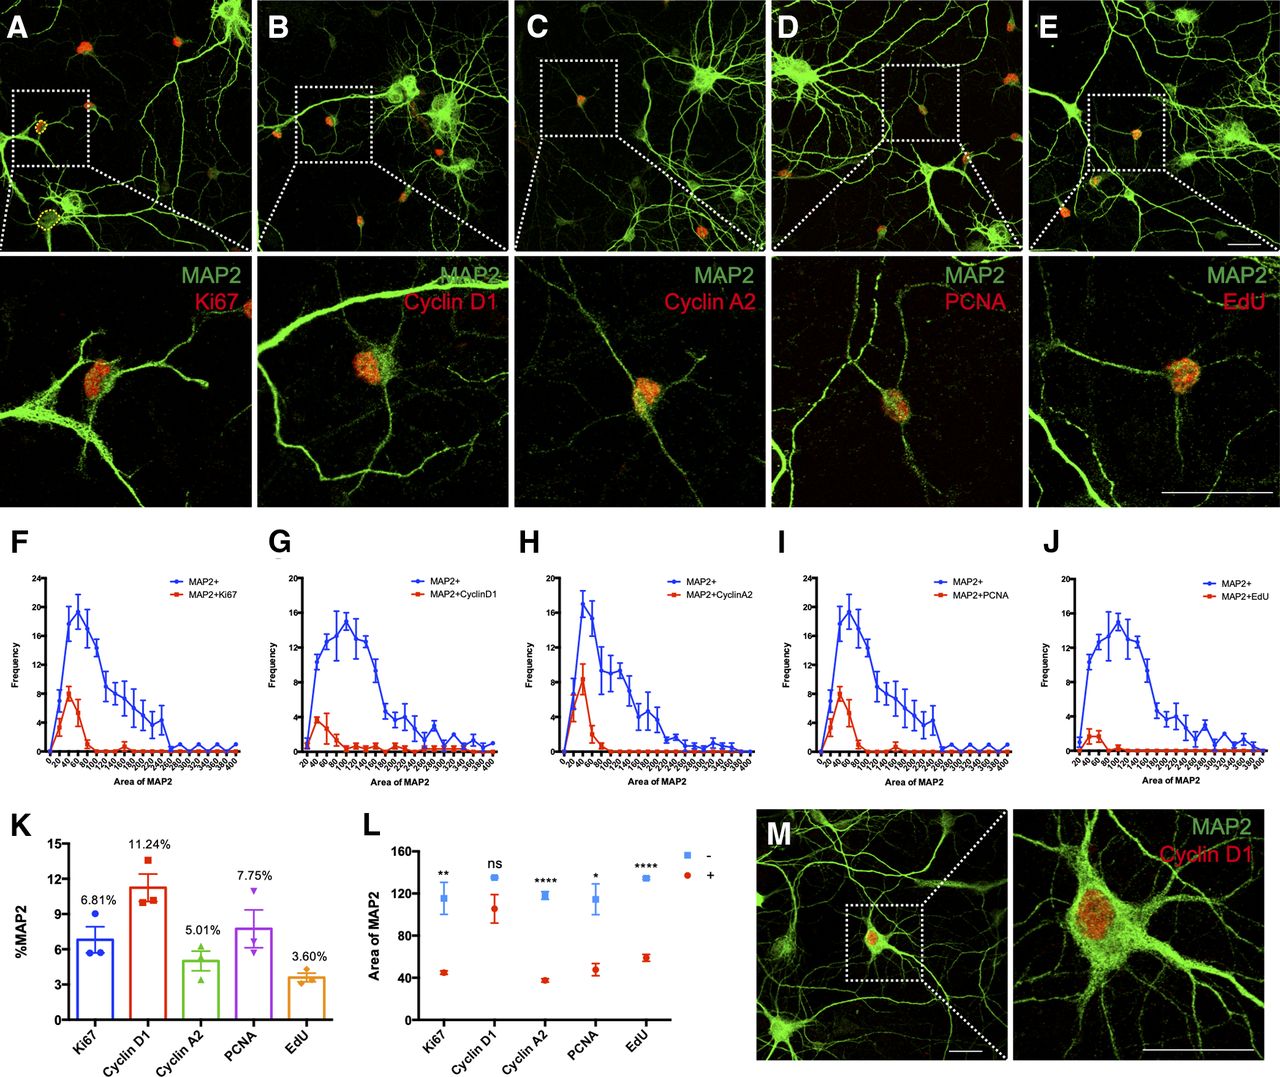
Embryonic cortical neurons in culture have been widely used to investigate the cell cycle events that accompany neuron death in a variety of neurodegenerative diseases. Most of these studies rely on the appearance and disappearance of different cell cycle proteins such as cyclin D1 as a marker for the G1 phase of the cell cycle, cyclin A2 and PCNA for S phase, and cyclin B1 for G2/M phase. Some studies also use the Ki67 protein as a marker for cells in any stage of the cell cycle. Thus, we and others have reported numerous examples of cell cycle activity in primary mouse cortical neurons using immunocytochemistry (Fig. 1A–D). As observed previously, when we quantify resting untreated cortical cultures after DIV14 (14 days in vitro), we found a small but significant background of “cycling” neurons ranging from 5% to 10% of the total, regardless of the protein marker used (Fig. 1K). To look specifically at DNA replication, we used EdU incorporation and found that ∼3% of the MAP2+ cells in our culture synthesized DNA (Fig. 1E,K).

Detection of cell cycle markers in E16.5 mouse primary cortical culture. A–D, Immunostaining for the indicated cell cycle regulatory proteins in DIV14 cortical culture. E, EdU incorporation assay was used to detect the cells that synthesized DNA. F–J, Cell body areas of MAP2+ cells were measured using Fiji software. Hand-traced measurement of cell body was conducted as illustrated by the yellow dashed line shown in A. Size-frequency histograms were constructed to compare the relative sizes of marker-positive and negative cells. More than 80 MAP2+ cells were quantified on each coverslip (N = 3). K, MAP2+/cell cycle marker double-positive cells expressed as a percentage of total MAP2+ cells. L, Average cell body areas of MAP2+ cycling cells (red) and their non-cycling counterparts (blue). M, Morphology of a big neuron expressing nuclear cyclin D1. Data from three batches of culture were presented as mean ± SEM. Scale bars: 25 μm. ns: not significant; *p < 0.05; **p < 0.01; ****p < 0.0001.
While we have repeated observations such as these many times, we became troubled that the cycling neurons were all relatively small compared with most of the other MAP2+ cells in our cultures. We had always assumed that their small size and weaker MAP2 staining intensity were because their unscheduled cell cycle event caused them to shrink and enter an unhealthy state. As we had never done anything to test this impression, we measured the area of the cell body of all MAP2+ cells and plotted the cell cycle positive and negative cells separately (Fig. 1F–J). We found that, regardless of the cell cycle marker used (except cyclin D1), the average cell body size of the cycling neurons was significantly smaller than the size of their non-cycling counterparts (Fig. 1L), suggesting that they are in a very different biological state. We had seen this result before. Inspecting the photographs from earlier publications (Hui et al., 2016) shows that the EdU-positive neurons in experiments such as these were small in size with weak MAP2 staining just like the cells shown in Figure 2A,B.

AM treatment does not influence the cell cycle or fate of small neurons. DIV14 cortical cultures from E16.5 mice were treated with 5% AM for 24 h. EdU labeling was used to detect cells with active DNA synthesis. A, B, Representative fields (20×) showing small neurons incorporating EdU (inset is a higher magnification of a single cell from the field). C, Quantification of the number of MAP2+ cells, separated by size, after AM treatment. D, Quantification of the ratio of double-positive EdU+/MAP2+ cells to total MAP2+ cells remaining after AM treatment. Data from three independent experiments, presented as mean ± SEM. Scale bars: 50 μm. ns: not significant; **p < 0.01; ****p < 0.0001.
There was one exception to the atrophic appearance of the cycling neurons. We consistently found a subpopulation of the neurons labeled with cyclin D that was larger and more normal in appearance. While ∼60% of the MAP2/cyclin D-positive cells were small in size (≤100 μm2), the remainder had cell sizes more similar to non-cycling cells (Fig. 1G). The morphology of the processes of the two sizes of cyclin D1 positive neurons was noticeably different as well (Fig. 1D,M). The bigger cells had healthy, large caliber, MAP2+ dendrites. One possible explanation of this finding is that since cyclin D is the first marker to appear in a normal cell cycle, perhaps we had caught these cells just as they entered a pathologic cell cycle.
To test this, we challenged our cells with an Alzheimer’s like environment to trigger cell cycle-related neuronal deaths. Our lab has previously used such an in vitro model system to investigate the contribution of inflammation to the pathogenesis of neurodegenerative disease. The paradigm involves treating microglia or THP-1 monocytes with β-amyloid, then using the conditioned medium from these cultures to treat primary neurons in culture (Wu et al., 2000; Hui et al., 2016). Typically, this amyloid-stimulated conditioned medium (AM) increases the percentage of EdU-positive neurons from ∼5% to ∼15% (Hui et al., 2016). We repeated this experiment for this study and obtained similar results (Fig. 2). Cell counts revealed that after 24 h of AM treatment, over 60% of the total MAP2+ cells had been lost and, of the survivors, the percentage of MAP2+ cells that was labeled with EdU increased more than two-fold (Fig. 2C,D).
While these results are consistent with earlier studies, a different picture emerged when we examined small and big neurons separately. After 24 h of AM treatment, over 60% of the population of large neurons was lost. Despite this, not a single EdU-positive neuron was observed in this group (Fig. 2C,D). By contrast, the small neurons suffered virtually no cell loss, and what is more, the percentage of small neurons that was EdU-positive was not significantly changed (Fig. 2C,D; statistical table is provided in Table 1). Therefore, the increase of the ratio of cycling to total MAP2+ cells after AM treatment was actually caused by the death of the large neurons not by an increase in cell cycle activity. While unexpected, these findings lead to the conclusion that that AM has no effect on either the cell cycle activity or the fate of the small neurons in our cultures and raises questions concerning their identity.
The “small neurons” have characteristics of neuronal progenitors
Since the small neurons were mitotically active cells, we asked whether they had any attributes that might mark them as neural progenitors. To do this, we stained our cultures with antibodies against nestin, an intermediate filament protein that is expressed in neural stem/progenitor cells found in the ventricular zone of the developing brain (Zimmerman et al., 1994). We found that virtually all of the small neurons were nestin+ (Fig. 3B). During a normal developmental progression, when nestin+ precursor cells in the ventricular zone exit the cell cycle and begin the process of migration, they stop producing nestin. During their migration and early maturation, the young postmitotic neurons begin expressing β-III tubulin, an embryonic isomer of adult β-tubulin (Menezes and Luskin, 1994; Sullivan, 1988). With further maturation β-III tubulin also disappears and adult cells end up expressing exclusively MAP2, a microtubule-associated protein found in mature dendrites. Finding nestin in MAP2+ cells is unexpected since these two markers are normally expressed at very different developmental stages. To further define the developmental identity of the small neurons, we stained our cultures with β-III tubulin. We found that the small MAP2+ neurons were β-III tubulin-negative, whereas all big neurons were strongly labeled (Fig. 3A). Finding β-III tubulin co-localized with MAP2+ neurons was unexpected, as it suggests that despite their morphology, the biochemistry of the cultured neurons has not fully matured. The absence of β-III tubulin in the dual presence of nestin and MAP2 can be taken as evidence that that the small neurons are much more like precursor cells and thus presumably not real neurons.

The small neurons in E16.5 mouse cortical culture express the neural progenitor marker nestin. A, DIV14 culture was immunostained with antibodies against neuronal markers MAP2 and β-III tubulin. B, Immunostaining of nestin in DIV14 cortical culture. A representative cell expressing nestin and MAP2 is shown enlarged in the bottom panels. Scale bars: 25 μm.
The small neurons express NG2 but do not develop into oligodendrocytes
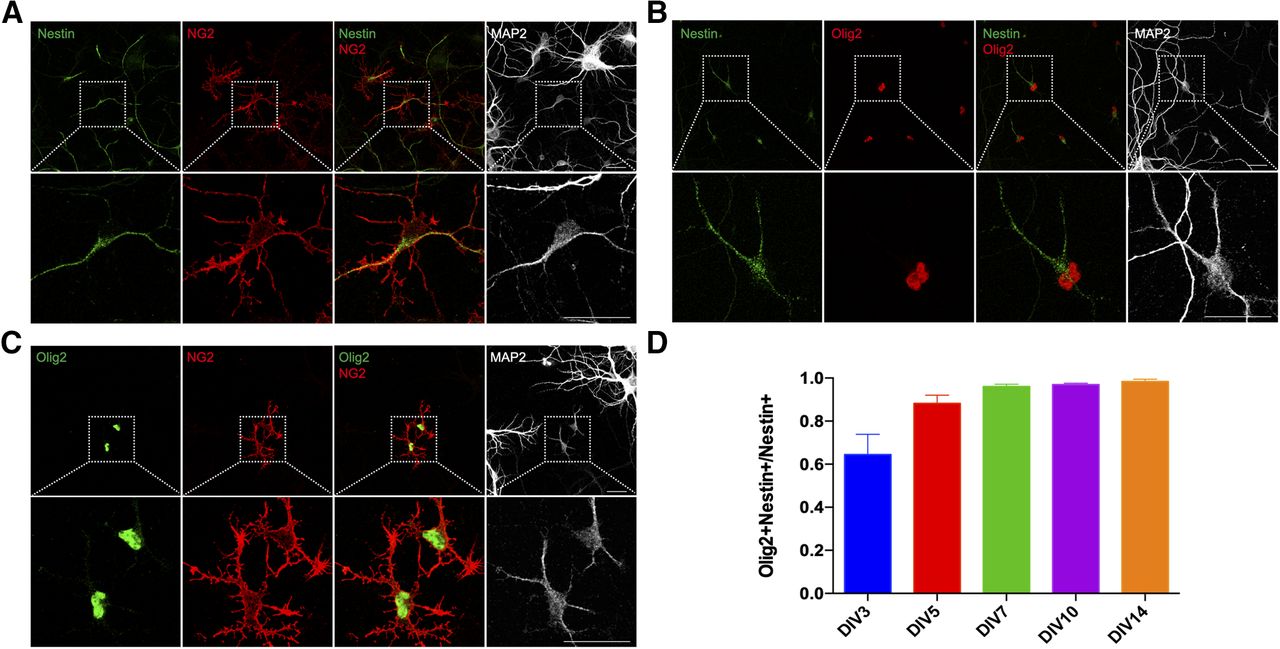
Neural progenitors have been shown to be able to differentiate into diverse cell types, including neurons, astrocytes, or oligodendrocytes (Mignone et al., 2004). While the small neurons express MAP2, it is unlikely that they are capable of developing into cortical neurons as they expressed neither β-III tubulin nor Tbr2, a marker of intermediate neuronal progenitor cells (Englund et al., 2005; data not shown). In testing whether they might be oligodendrocyte progenitors, we found that the small neurons were immunopositive for NG2 (Fig. 4A), a proteoglycan expressed specifically in OPCs or NG2-glia of the brain (Richardson et al., 2011). We, therefore, speculated that the small neurons were in reality cells of the oligodendrocyte lineage cells. We verified this possibility by immunostaining cultures with the oligodendrocytes lineage marker Olig2 (Fig. 4B,C; Zhou et al., 2000). While the presence of these two proteins would tend to identify the small neurons as OPCs, there was no sign of their further differentiation in our cultures. Thus, no cell in our culture was found to express the mature oligodendrocyte marker, myelin basic protein (MBP; data not shown).

The small neurons express Olig2 and NG2 but do not develop into oligodendrocytes in culture. DIV14 cortical cultures from E16.5 mice were double labeled with antibodies against (A) nestin and NG2, (B) nestin and Olig2, (C) Olig2 and NG2. D, Percentage of the number of nestin+/Olig2+ double-positive cells expressed as a fraction of total nestin+ cells. Scale bars: 25 μm.
The small neurons generate astrocytes
It seemed that the small neurons could not generate either neurons or oligodendrocytes; we therefore asked whether they were able to differentiate into astrocytes. In our cultures, we observed a number of nestin+ cells with a morphology that was distinct from that of the small neurons. These nestin+ cells were larger in size with more processes than were found on the small neurons. While they looked fully differentiated, they showed less MAP2 expression in processes (Fig. 5B). In DIV14 cultures, over 95% of the nestin+ cells, including the small neurons, expressed nuclear Olig2 (Fig. 4B,D). By contrast, these big nestin+ cells (also Olig2+) exhibited a weaker, diffuse NG2 signal. That raised the possibility that these larger cells were derived from small neurons and that the expression of NG2 declined during their transformation (Fig. 5B, arrow). In keeping with this idea, we found that a large proportion of the big nestin+ cells expressed the astrocyte marker GFAP, co-localized with the nestin immunoreactivity (Fig. 5C, lower panel). Nestin+Olig2+ small neurons did not express GFAP (Fig. 5C,D, upper panel), but many Olig2+ cells expressed GFAP as well (Fig. 5D, lower panel). From DIV3 to DIV14, the percentage of nestin+ cells that were GFAP+ gradually increased (Fig. 5F). During the same time period, the percentage of Olig2+ cells that were GFAP+ also significantly increased (Fig. 5G). Thus, almost all of the GFAP+ cells in the culture were nestin+Olig2+. NG2 immunostaining could be found in the large GFAP+ nestin+ cells, but it was always weak and diffuse (Fig. 5E, lower panel). This decline in NG2 staining distinguishes the GFAP+ cells from the small neurons where no GFAP expression could be detected despite the presence of NG2 (Fig. 5E, upper panel). Taken together, our data suggest that MAP2+/nestin+/Olig2+/NG2+ small neurons differentiate into GFAP+ astrocytes in the culture.

The small neurons generate astrocytes in E16.5 mouse cortical culture. A, Immunostaining reveals nestin+Olig2+ cells in addition to the small neurons in DIV14 culture. B, Double labeling of nestin (upper panels) or Olig2 (lower panels) and NG2 reveals large nestin-negative cells with weaker and diffuse NG2 signal (arrow) compared with that of the small neurons (arrowhead). C, Double labeling of nestin and GFAP in DIV14 culture reveals big nestin cells expressing GFAP (arrow), while the nestin+ small neurons are GFAP-negative (arrowheads). D, Double labeling of Olig2 and GFAP in DIV14 culture reveals big Olig2+ cells expressing GFAP (arrow); nestin+ small neurons do not express GFAP (arrowheads). E, Double labeling of NG2 and GFAP in DIV14 culture shows NG2 cells with weak and diffuse NG2 signals expressing GFAP (arrows); the NG2+ small neurons do not express GFAP (arrowheads). F, G, Ratio of GFAP/nestin double-positive cells to total nestin+ (F) or GFAP/Olig2 double-positive cells to total Olig2+ cells (G) gradually increases from DIV3 to DIV14. Data from at least three independent cultures are presented as mean ± SEM. Scale bars: 25 μm. *p < 0.05; ***p < 0.001; ****p < 0.0001.
The small neurons in mouse brain also give rise to astrocytes
It would appear that the cycling small neurons in cultures of E16.5 mouse cortical are progenitor cells that differentiate into astrocytes. However, the question arises: are such cells an artifact of culture, or can they also be found in vivo? In E16.5 cultures, GFAP+ astrocytes first appear around DIV5, after which their number gradually increases up to at least DIV14 (Fig. 5F,G). We isolated cortex from P5 mice and established dissociated cultures using the same protocol for E16.5 cortex. In the P5 cortical culture, after 3 d, many characteristic Olig2+NG2+ small neurons began to emerge (Fig. 6A) along with many GFAP+ astrocytes (many of which were also Olig2+; Fig. 6B, upper panel). This is much faster than such cells appeared in E16.5 cultures. During differentiation, as expected, these GFAP+ cells gradually lost their Olig2 (Fig. 6B, lower panel). That is to say, in P5 culture the emergence of Olig2+NG2+ small neurons and Olig2+GFAP+ astrocytes occurred more quickly than in E16.5 culture. This suggests that the small neurons are still present in the P5 brain and that they have begun to differentiate in vivo allowing them to establish themselves faster in dissociated culture. To further confirm this, we directly performed immunohistochemistry of the P5 mouse brain. Immunostaining of developing neocortex revealed a complex cellular landscape. Nonetheless, we were able to detect a small number of Olig2+nestin+ (Fig. 6C) and Olig2+NG2+ (Fig. 6D) small neurons in the cortex of P5 mice as predicted from the in vitro work. We also observed GFAP+/Olig2+ (Fig. 6E) cells, suggesting Olig2+ cells also differentiate into GFAP+ astrocytes in mouse brain. These cells were relatively rare and scattered throughout the cortex with no obvious regional variability. These data are consistent with the idea that a population of cells very similar to the small neurons we identified in vitro exist in the early postnatal mouse brain and further that these precursor-like cells develop into astrocytes in vivo.

Detection of small neurons in cortical cultures from P5 mice and in P5 mouse brain. A, Immunostaining of Olig2, NG2, and MAP2 reveals the presence of small neurons (arrows) in DIV3 cortical culture from P5 mouse. B, Double labeling of Olig2 and GFAP shows astrocytes expressing Olig2 (arrows) or not (arrowheads) in DIV3 (upper panel) or DIV7 (upper panel) cortical culture from P5 mouse. Stars denote the small neurons. C, Immunostaining of an Olig2+nestin+ cell (arrow) in the cortex of a P5 mouse. D, Immunostaining of an NG2+Olig2+ cell (arrow) in the dorsal (motor) cortex of a P5 mouse. E, Double labeling of Olig2 and GFAP showing astrocytes expressing Olig2 (arrows) or not (arrowheads) in the cortex of P5 mice. Scale bars: 25 μm.
Discussion
Ectopic neuronal cell cycle reentry is tightly associated with neuronal cell death and is often cited as an integral part of the pathogenesis of neurodegenerative disorders such as AD (Park et al., 1997; Busser et al., 1998; Copani et al., 1999; Kruman et al., 2004; Herrup and Yang, 2007; Folch et al., 2012; Seward et al., 2013; Norambuena et al., 2017). Most of the evidence supporting this disease model has come from descriptive correlations observed in neuropathological samples. Few if any controlled experimental manipulations have been done in vivo as such experiments are difficult to perform. For this reason, virtually all of the studies aimed at understanding the molecular mechanisms of cycle-related neuronal death have been done in vitro, in dissociated cultures of embryonic neurons. As with their in vivo counterparts, these cultured neurons exit the cell cycle and generate electrically active processes. The advantage of this preparation is that, in the controlled environment of a tissue culture dish, a variety of stimuli such as DNA damage (Park et al., 2000; Kruman et al., 2004; Liu et al., 2014), oxidative stress (Yang et al., 2014), proinflammatory cytokines (Varvel et al., 2009; Bhaskar et al., 2014) and other manipulations can and have been used to induce ectopic neuronal cell cycle events. For many labs including our own, the outcome measure used to monitor this process is the appearance of cells that are double-immunolabeled with MAP2 and a cell cycle protein (or BrdU/EdU incorporation). The assumption has always been that these double-labeled cells were mitotically active neurons.
Our current study challenges this assumption. We performed double-labeling of cultured neurons using antibodies against MAP2 and a variety of cell cycle proteins, including Ki67, cyclin D1, cyclin A2, and PCNA. We first showed that the double-labeled cells formed a distinct cell population that was small in size (<100 μm2) with thin dendritic branches and significantly weaker MAP2 immunolabelling. Consistent with the cell cycle protein staining, EdU incorporation was only found in these cells. Building on this observation, we used cell body size to divide our cultures into two groups for analysis. We challenged our cultures with conditioned medium from THP-1 cells stimulated with Aβ. As expected, this manipulation increased the total percentage of EdU/MAP2 double-labeled cells. The effects of conditioned medium, however, were drastically different in the two different size classes of neurons. Larger (normal looking) neurons were killed by the conditioned medium, but never incorporated EdU. The smaller MAP2+ cells continued to incorporate EdU but showed no response to AM, their numbers did not change, nor did the percentage that were EdU labeled.
These observations have direct implications for previous cell cycle/cell death studies in neurons. Figure 2C,D repeats findings that have been replicated by many authors, including our lab. The interpretation of this simple experiment is that after AM, neuronal cell cycling increases, and when it does, the cycling neurons die. This may yet be true in vivo, but in vitro Figure 2E–H tells a cautionary tale. Large, fully mature MAP2+ neurons die in response to microglial conditioned medium, but they do not enter a cell cycle before doing so. The MAP2+ cells we have called small neurons remain as the only mitotic cells in culture. When, after AM, the ratio of cycling to total MAP2+ cells increases in culture, the increase is caused entirely by the death of the large neurons (the denominator decreases) not by an increase in cell cycle activity (the numerator remains unchanged; Fig. 2H). The inescapable conclusion is that many studies in this field need to be re-examined and perhaps reinterpreted.
The cells we called small neurons are not real neurons although they have processes and express MAP2. Instead, we find that they are nestin+/Olig2+/NG2+ progenitor cells. They cannot be committed to a neuronal lineage, since we seldom detect cells that are double positive for β-III tubulin and nestin (or Olig2). Although they do express Olig2 and NG2, markers associated with the oligodendrocyte lineage, the absence of mature oligodendrocytes suggests that they do not differentiate into oligodendrocytes, at least in our culture conditions. Their most likely fate can be found in our observation of GFAP+ astrocytes that also express nestin and Olig2. While the co-expression of MAP2, Olig2, GFAP (neuron, oligodendrocyte, astrocyte proteins) along with proteins such as nestin that are found in immature ventricular zone precursor cells suggests that there are strong molecular cross-currents buffeting the fate decision of these cells, our data suggest that these unusual cells most probably give rise to astrocytes in our culture system with time. To begin, we find cells expressing both GFAP and NG2, and it has been reported that NG2 glia generate astrocytes in addition to oligodendrocytes (Zhu et al., 2008). We and others have also found that the number of astrocytes increases steadily with time. The nestin+/Olig2+/NG2+ small neurons thus serve as a precursor pool for an ever-enlarging population of astrocytes.
While the field has historically referred to the cycling MAP2+ cells in mouse embryonic cortical culture as neurons, the data show that they are instead glial progenitors that express NG2, MAP2, Olig2, and nestin. During their differentiation, these progenitors grow thicker processes and grow larger in size. At the same time, the MAP2 and NG2 proteins diffuse into their cytoplasmic processes and gradually degrade. During this same differentiation period, GFAP expression is established, and Olig2 and nestin are ultimately degraded (Olig2 preceding nestin). The expression of nestin and Olig2 in astrocytes finds precedent in the literature. While its exact function has yet to be determined, developing astrocytes in mouse brain are known to express Olig2 as they become specified and differentiated, gradually reducing expression as maturation is completed (Marshall et al., 2005). Nestin is a well-known component of radial glial cells – GFAP+ astroglial cells in developing mouse brain, so the co-expression of these two proteins also has precedence (Wei et al., 2002). Nestin is not expressed in mature astrocytes, but after injury, re-expression of nestin was observed in reactive astrocytes (Schmidt-Kastner and Humpel, 2002). The constant co-expression of nestin and GFAP in astrocytes in our culture suggests astrocytes in embryonic cortical culture are not fully mature, probably because of lack of astrocyte maturation factors. The existence of Olig2+/NG2+ and nestin+/NG2+ cells in the P5 mouse brain and cortical cultures established from P5 mouse indicates that the small neurons are not artifacts of culture. GFAP+ astrocytes expressing weak Olig2 in the nucleus confirms Olig2+ cells also develop into astrocytes in the brain of postnatal mice.
Confusion in the field has arisen largely because these small neurons/astroglial progenitors also express MAP2 in soma and processes. Traditionally, MAP2 is a neuron-specific cytoskeletal protein enriched in dendrites where it helps to stabilize microtubules. Like tau, however, of MAP2 has several alternatively spliced isoforms (Kalcheva et al., 1995). One of these includes exon 13 (MAP2 + 13) and has been found to be transiently expressed in oligodendrocyte/astrocyte precursor cells during human CNS development (Blümcke et al., 2001) and may well explain why the small neurons express MAP2. The expression of protein markers for both neurons and glia in small “neurons” or cells they generate suggest that they are probably a heterogeneous population. We noticed that in old embryonic cultures (DIV21), the number of small neurons did not greatly drop compared with that of younger cultures (DIV10 or DIV14), suggesting that not all the cells grow to generate astrocytes in the culture. The small neurons keep dividing, and some of them differentiate into astrocytes, but a proportion remain undifferentiated. Indeed, in DIV21 culture, we detected not many but a few NG2+/nestin+ cells that also express β-III tubulin (Fig. 7), but they seem not fully differentiated. Probably extra neurotrophic factors are needed for them to become mature neurons. In a word, the identity of these cells is complicated, and their fate is perhaps dependent on the extracellular environment.

Expression of β-III tubulin by some small neurons in DIV21 cortical culture from E16.5 mice. A, Immunostaining showing nestin+ small neurons expressing β-III tubulin. B, Immunostaining showing Olig2+ small neurons expressing β-III tubulin. Scale bars: 25 μm.
In summary, we have identified a population of neuron-like precursor cells in mouse embryonic cortical cultures that express MAP2 but also nestin, Olig2, and NG2. During the time in culture, they are highly proliferative but steadily differentiate, mostly into GFAP+ astrocytes. True cortical neurons are present in the dish, but they are postmitotic and do not incorporate BrdU. We submit that these neuron-like precursors have been mistaken for cortical neurons in previous reports investigating neuronal cell cycle events in vitro. These studies would bear re-examining and the data surrounding the measurement of ectopic neuronal cell cycles should be reinterpreted if the neuron-like precursor cells were targeted.
Footnotes
The authors declare no competing financial interests.
This work was supported by The Hong Kong University of Science and Technology Grant R9321, Research Grants Council of the Hong Kong SAR 16101315 and 16124916, the Leo and Anne Albert White Matter Trust, the National Health Medical Research Council of Australia Grant AWD00001421, and the University of Pittsburgh School of Medicine.
Y. Zhang’s present address: Institute of Modern Biology, Nanjing University, Nanjing, Jiangsu, China 210031.
B. Zhu’s present address: Eli and Edythe Broad Center for Regeneration Medicine and Stem Cell Research, Weill institute of Neuroscience, University of California, San Francisco, San Francisco, CA 94143.
F. Ma’s present address: Department of Neurobiology, University of Pittsburgh School of Medicine, Pittsburgh, PA 15261.
K. Herrup’s present address: Department of Neurobiology, University of Pittsburgh School of Medicine, Pittsburgh, PA 15261.
This is an open-access article distributed under the terms of the Creative Commons Attribution 4.0 International license, which permits unrestricted use, distribution and reproduction in any medium provided that the original work is properly attributed.
References
In this issue


