

Article Figures & Data
Figures
- Figure 1.
Training mice on a reversal paradigm based on 2-AC frequency discrimination. A, Schematic of the reversal paradigm using the tonecloud task for mice (top). Animals are first trained on one contingency, e.g., to pair a low-frequency tonecloud with reward on the right referred to as “low-right” (“learning”). Once they reach the performance criteria, the training contingency is reversed, requiring the same animal to now pair a low-frequency tonecloud with reward on the left, or “low-left” (“reversal”). The trial structure (bottom) shows the sequence of events in a single typical “correct” trial in the task. B, Example learning curves of mice trained in the reversal paradigm (black, low-left → low-right, n = 3 and red, low-right → low-left, n = 3), where 0 denotes the start of training on the reversed contingency. The performance of the animals is smoothed over three sessions for this plot. C, Animals require a comparable number of sessions to reach performance criteria during initial learning as during reversal.
- Figure 2.
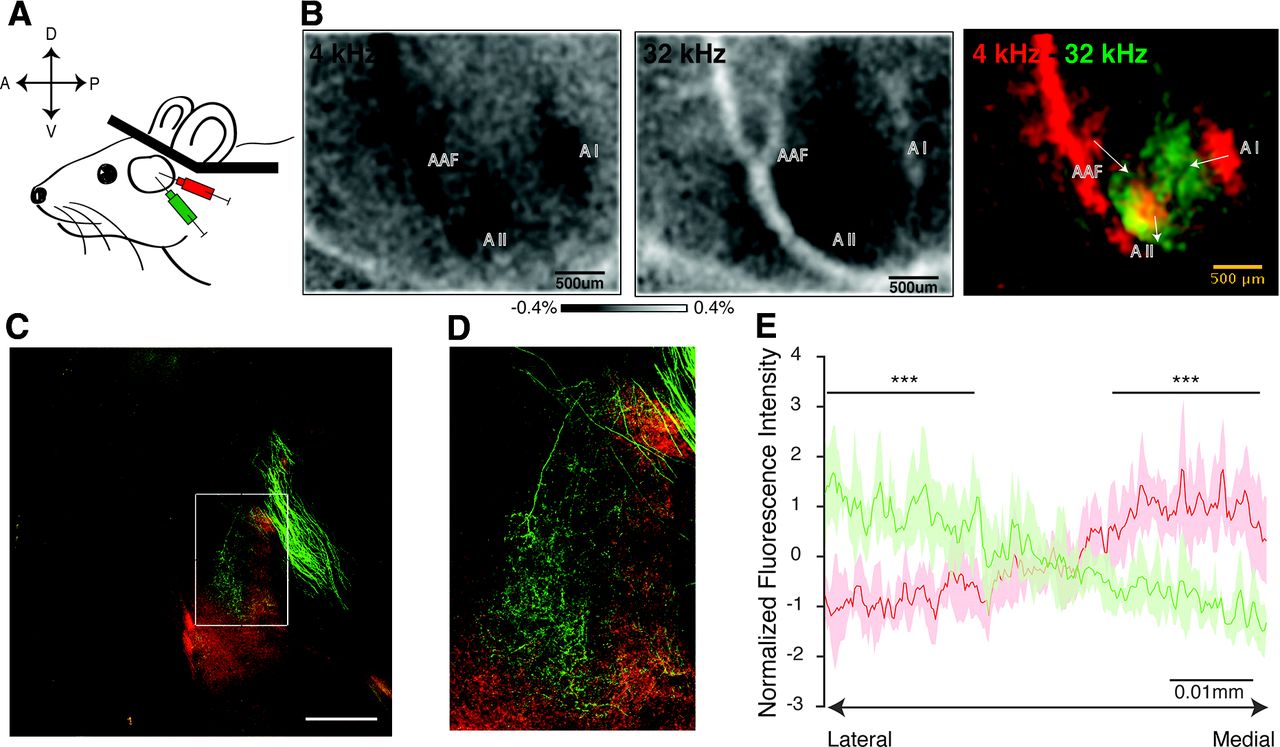
Auditory corticostriatal projections in mice are tonotopically organized. A, Intrinsic optical imaging of the auditory cortex in a head-fixed mouse through a window of thinned bone. B, Intrinsic optical images in response to pure tones of 4 and 32 kHz (left and middle) are shown for the example animal whose histology is shown later. The data shows high and low frequency loci as determined by the mean relative normalized change in reflectance between pre-stimulus period and during stimulus presentation repeated 15×. Composite image showing tonotopy in auditory cortex where green corresponds to high frequency and red to low frequency. The arrows indicate overall tonotopic gradient (low to high) in the individual tone responsive areas. C, Tonotopic separation of A1 projections into auditory striatum in a single example section showing high frequency A1 projects more laterally and low frequency A1 projects more medially (white rectangle). Scale bar = 500 μm. D, Enlarged view of auditory striatum (white rectangle) from C showing tonotopic separation. E, Z-score normalized fluorescence intensity of auditory corticostriatal projections plotted along the medio-lateral axis. The data represents mean and std. dev. of fluorescence intensity across 5 slices obtained from 2 animals after dual injections; paired t-test shows significant differences in red and green fluorescence intensity at the medial and lateral ends (p = 5.6 × 10⁻⁵, and p = 1.9 × 10⁻⁵ respectively; *** indicates p < 10-4). Additional data is available in Extended Data Figure 2-1.
- Figure 3.
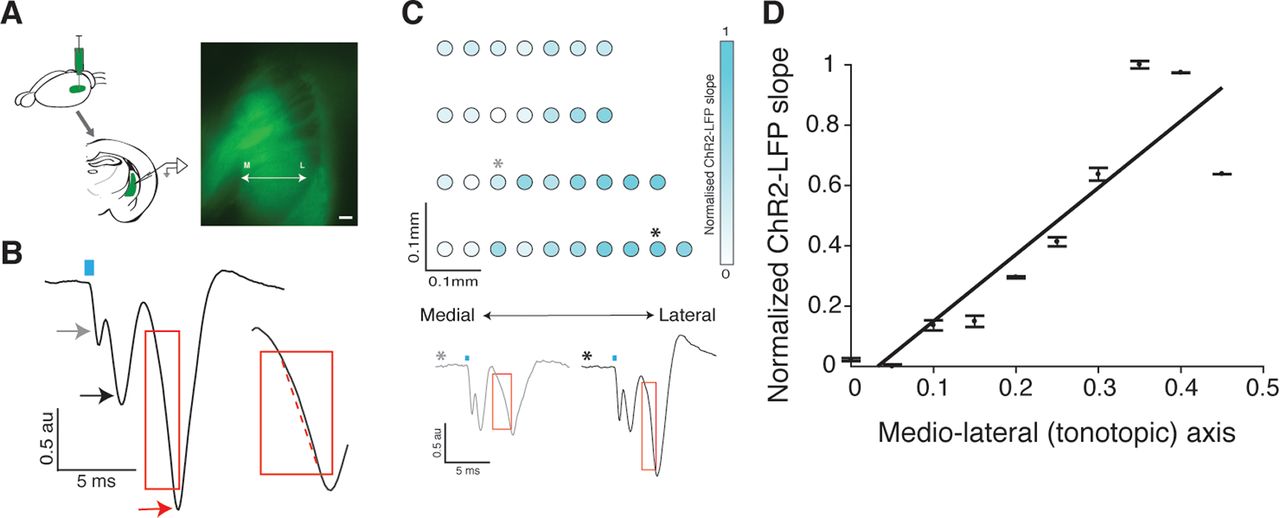
ChR2-LFP slope measurements reflect the learning induced plasticity gradient. A, AAV9-ChR2 is injected in auditory cortex and recordings are obtained from acute coronal slices of auditory striatum exhibiting ChR2-expressing corticostriatal fiber terminals. Right, Example of an acute slice showing ChR2-GFP expressed in corticostriatal fibers. B, Example trace of ChR2-LFP from one position in the slice. Gray arrow indicates a light artifact often observed soon after laser stimulation (blue rectangle). Black arrow indicates the depolarization of ChR2-expressing corticostriatal fibers. Red arrow indicates the postsynaptic response of downstream striatal neurons. The response is normalized to the fiber depolarization, and the normalized ChR2-LFP slope is calculated from the postsynaptic component (red rectangle). Inset, Calculation of ChR2-LFP slope by fitting a line (dotted red line) to the postsynaptic component. C, Representative image showing distribution of individual normalized ChR2-LFP slopes along the tonotopic axis of the left auditory striatum of an example animal trained on low-left contingency. Two example traces corresponding to two data points on top are shown in the bottom of panel C. The red rectangle encloses the initial depolarization phase showing a faster depolarization for the lateral data point (black *) compared with the medial one (gray *). D, Mean and standard deviation of the ChR2-LFP slope data from C, plotted along the tonotopic axis. Slope of the linear fit to these data points is the plasticity gradient (=0.33) for this animal. Additional control data are available in Extended Data Figure 3-1.
- Figure 4.
Learning-induced plasticity gradient in auditory corticostriatal circuit reflects initial learning contingency. A, Top - ChR2-LFP slope after either learning alone (cyan, n = 8 animals) or reversal (magenta, n = 7 animals) from Low-Left (left) or Low-Right (right) contingency on the tonecloud task. The intensity of each point represents magnitude of normalized ChR2-LFP slope value recorded at that position of the striatal slice. Bottom - mean • SEM vs. tonotopy. Correlation coefficient of data along the tonotopic axis - Low-Left: 0.95, p < 2 × 10⁻³, Low-Left → Low-Right: 0.93, p < 1 × 10⁻³, Low-Right: −0.88, p < 1 × 10⁻³, Low-Right → Low-Left: ⊟0.77, p < 1 × 10⁻². B, Summary of learning-induced plasticity gradient from 4 groups of animals: {Learning (cyan) or Reversal (magenta)} × {Low-Left (circle) or Low-Right(square)}. Points represent individual animals. Significant differences were only observed between groups trained on opposite contingencies : Low-Left vs. Low-Right (p = 8 × 10⁻⁵) and Low-Left → Low-Right vs. Low-Right → Low-Left (p = 2 × 10⁻³), *** indicates p < 0.005; Wilcoxon Rank Sum test. The same test showed no significance between groups trained on same contingencies (n.s. = not significant; p > 0.05, Wilcoxon Rank Sum test). The plasticity gradient from the example animal shown in Figure 3D (value = 0.3) is marked here with a red star. Additional data is available in Extended Data Figure 4-1.


Extended Data
Extended Data Figure 2-1
Injection site in primary auditory cortex confirming expression of tdTomato (top) and GFP (bottom). These images confirm little to no overlap of viral infections at the cortical injection site. Scale bar: 500 μm. Download Figure 2-1, TIF file.
Extended Data Figure 3-1
Controls of ChR2-LFP recordings and measurement of ChR2-LFP slopes. A, Neuronal responses to optical stimulation is absent in brain region not expressing ChR2 (somatosensory cortex). B, Magnitude of ChR2-LFP increases with increase in laser power, keeping the duration of stimulation at 0.5 ms. C, The magnitude of ChR2-LFP increases if duration of stimulation is increased at the highest laser power of 0.980 mW. D, 30 min of slice incubation with 50 μμ CNQX abolishes the postsynaptic response of striatal neurons without affecting the depolarization of cortical fiber terminals in striatum (red) in comparison to predrug control (black). E, Example of normalized ChR2-LFP slope distribution in the left auditory striatum of an animal trained on the low-right contingency. F, Mean and SD of the normalized ChR2-slope data from E plotted along the tonotopic axis. Download Figure 3-1, TIF file.
Extended Data Figure 4-1
A, Normalized ChR2-LFP slope of individual animals along the tonotopic axis. The raw data as shown in Figure 4A have been binned in 50-μm bins. The thin lines designate individual animals trained on each task contingency and the bold lines show the mean normalized ChR2-LFP values (cyan, learning; magenta, reversal). B, Summary of normalized plasticity gradient calculated along the dorsoventral axis (non-tonotopic axis) does not reflect a consistent difference between training contingencies (low-left vs low-right) or across training phases (learning vs reversal). Kruskal–Wallis test, p = 0.43. Download Figure 4-1, TIF file.
In this issue


