

Article Figures & Data
Figures
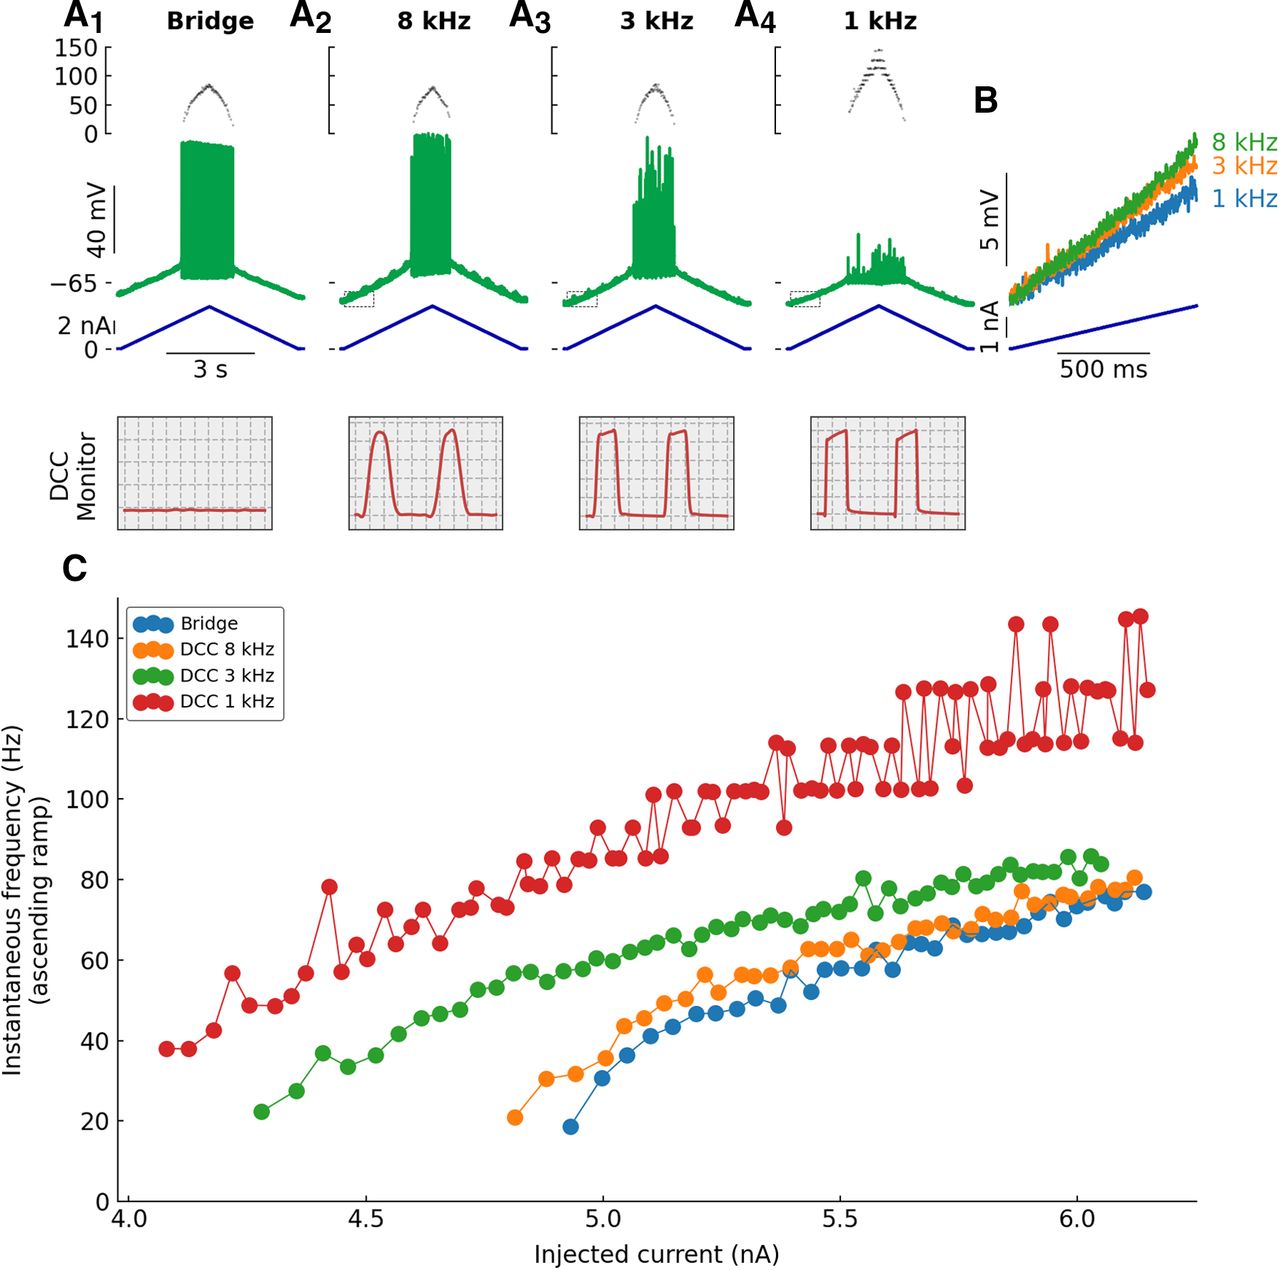
- Figure 1.
Typical example showing how DCC rates alter the response of a motoneuron to a slow ramp of current. A, Response of a triceps surae motoneuron (Rin = 3.9 MΩ; τm = 4.2 ms) to a slow (2 nA/s) triangular ramp of current, recorded in Bridge mode and in DCC mode with switching rates 8, 3, and 1 kHz. Bottom traces, Injected current. Middle traces, Voltage response. Top traces, Instantaneous firing frequency. The boxes on the bottom represent the monitoring traces used to check the settling of the electrode, recorded at the top of the ramp. Time bases from left to right: 25, 25, 66, and 195 μs per division. B, Expansions of the regions delimited with the dashed box in A. C, F-I curves showing the instantaneous firing frequency plotted against the injected current at the time of each spike.
- Figure 2.
Numerical simulations showing how the DCC rate affects the membrane potential. A, Recording with a DCC rate of 1 kHz (five cycles per time constant). B, Recording with a DCC rate of 5 kHz (25 cycles per time constant). C, recording with a DCC rate of 15 kHz (75 cycles per time constant). In A–C, the simulated cell had a resistance of 5 MΩ and a time constant of 5 ms. The electrode had a resistance of 1 MΩ and an effective time constant 200× faster than the membrane time constant. The cell was injected with a 1-nA square pulse of current. Vm: response of the cells to the continuous current as would be observed in an ideal situation where the electrode resistance was perfectly compensated for by the Bridge circuit. Vtotal: continuous voltage recorded at the tip of the electrode that includes the voltage drop through the electrode and the cell membrane. Vamp: voltage measured by the amplifier in DCC mode, which is the value of Vtotal sampled at the end of each DCC period and stored in a sample-and-hold circuit. Vm(DCC): actual potential across the membrane during a DCC injection. This value is not accessible to the experimenter. Icom: stationary current that the experimenter is imposing to the cell. IDCC: actual current injected in the cell. That current is 3× the amplitude of Icom, but injected for only 1/3 of the time. D, Apparent input resistance of the cell (normalized to the real input resistance Rin = 2.5 MΩ in this case) as a function of the normalized DCC rate (number of DCC periods per membrane time constant). The measurements were obtained with two different electrode resistances (5 and 10 MΩ) and three different electrode time constants (200×, 300×, and 400× faster than the membrane time constant).
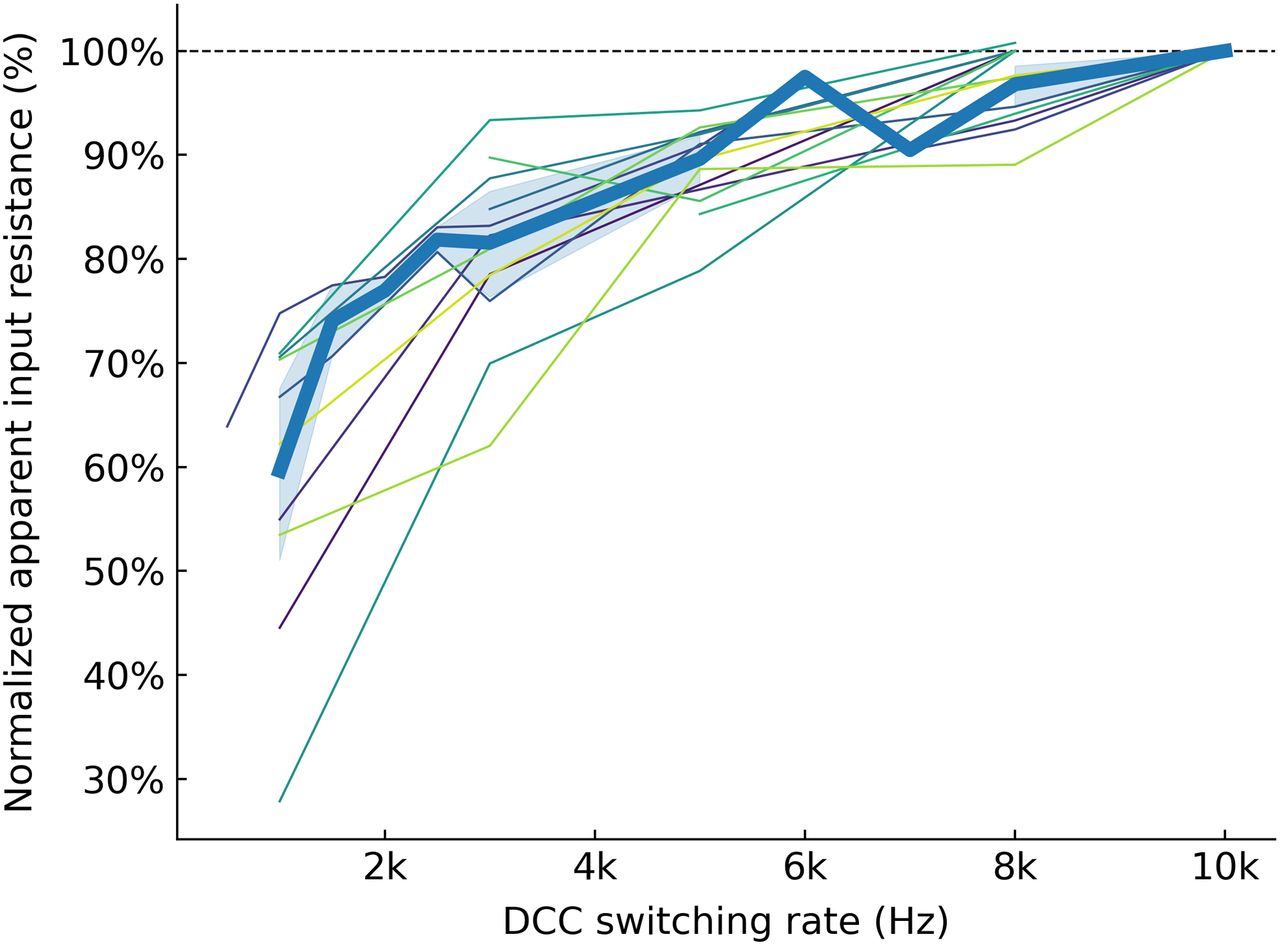
- Figure 3.
Effect of the DCC rate on the apparent input resistance of the cells. Experimental results showing the apparent cell input resistance as a function of the DCC switching rate. The input resistance of each cell was normalized to the value measured with the highest DCC rate. Each thin line corresponds to a different cell, and the thick line shows the average apparent resistance (±95%CI, shaded area).
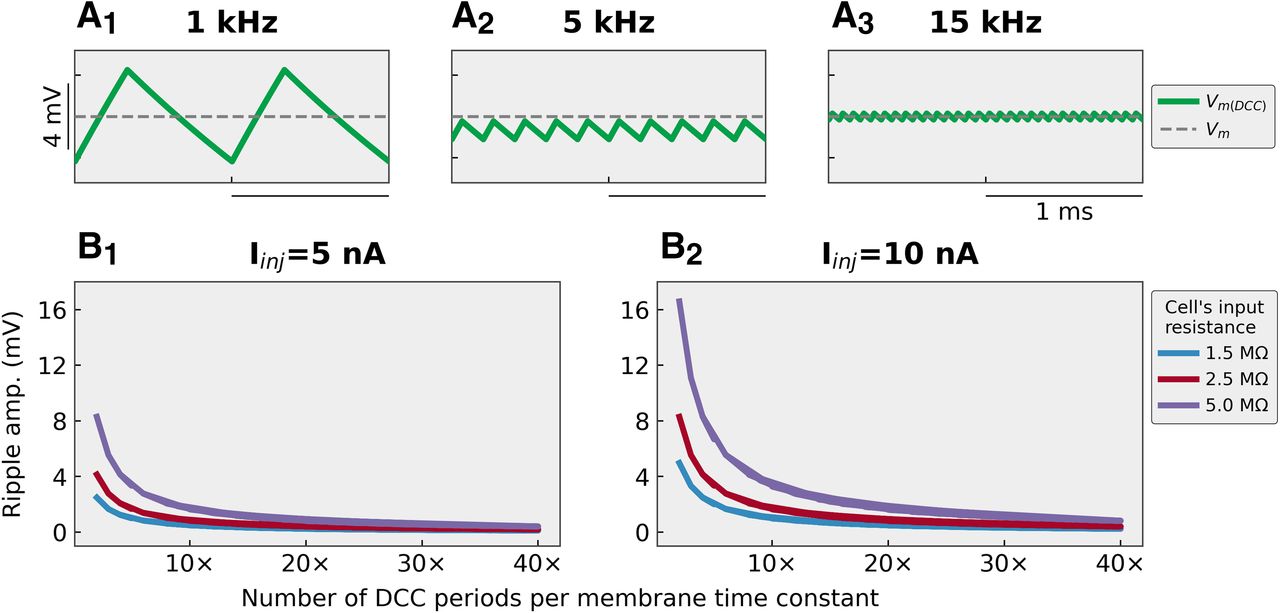
- Figure 4.
DCC recording mode induces ripples in the membrane potential. A, Traces showing the steady-state amplitude of the membrane potential ripples in a cell with an input resistance of 2.5 MΩ, time constant 3 ms, and injected current 10 nA when recorded in DCC mode at 1 kHz (A1), 5 kHz (A2), and 15 kHz (A3). B, Plots showing the amplitude of the ripples as a function of the normalized DCC frequency (number of DCC cycles per membrane time constant). The response was measured in steady-state for two current intensities that are routinely reached during our recordings in mouse spinal motoneurons [5 nA (B1) and 10 nA (B2)] and for three values of the cell’s input resistance 1.5, 2.5, and 5 MΩ (which correspond to typical values for FF, FR, and S motoneurons, respectively).
- Figure 5.
Relationship between parameters measured on the F-I curves and the DCC frequency used during the recording. In all panels, each line represents one motoneuron. Onset current, Current required to elicit the first spike on the ascending ramp. Offset current, Current at which the firing stops on the descending ramp. F-I gain, Slope of the F-I relationship measured on the ascending part of the ramp. Voltage threshold, Voltage measured at the foot of the first spike elicited on the ascending ramp. A–D, Value of each of the parameters normalized to the value measured at the highest DCC rate achieved in each motoneuron (dashed horizontal line) plotted against the DCC rate normalized by the time constant of each motoneuron. The thick line represents the average values across motoneurons (±95%CI, shaded area). The diamonds on the right side of each plot represent the measurement obtained in Bridge mode (mean ± SD).
- Figure 6.
Stepwise pattern is a sign of suboptimal DCC rate. A, F-I curves from a triceps surae motoneuron (Rin = 2.0 MΩ; τm = 3.8 ms), injected with a triangular ramp of current (1 nA/s) and recorded in DCC mode at three different DCC switching rates. At low DCC rates, a clear stepwise pattern is apparent, which corresponds to multiples of the switching rate (1050 Hz in this instance): 95.5 Hz (or one spike every 11 DCC periods), 87.5 Hz (1:12), 80.8 Hz (1:13), 75.0 Hz (1:14), 70.0 Hz (1:15), 65.6 Hz (1:16), etc. B, The same phenomenon can be observed in a simple integrate-and-fire motoneuron model. The model was that of a typical FF motoneuron (Rin = 1.5 MΩ; τm = 2.0 ms), injected with a 10-nA slow ramp of current (1 nA/s), and recorded in DCC mode at 8, 3, and 1 kHz. A stepwise pattern is apparent at the top of the F-I curve at 3 kHz and is evident at 1 kHz (see distinct peaks in the distributions of the firing frequencies in B2). The horizontal dotted lines represent the multiples of the period of the 1-kHz switching rates. The vertical dash-dotted line represents the region zoomed-in in C. C, Comparison of the behavior of the model recorded in Bridge (gray line) and DCC mode at 3 kHz. The thick black line represents the Vamp output of the amplifier, while the thin green line represents the true membrane potential Vm(DCC) which is hidden from the experimenter by the sample-and-hold circuit. The membrane potential ripples created by the DCC shorten the ISIs (gray arrows) and entrain the firing with ISIs that are multiples of the DCC period. D, Distribution of the ISIs obtained in DCC mode at 1, 3, and 8 kHz. The intervals have been normalized by the DCC period (1, 0.33, and 0.125 ms, respectively) and plotted on a logarithmic scale. At 1 kHz, the ISIs are concentrated at multiples of the DCC period.
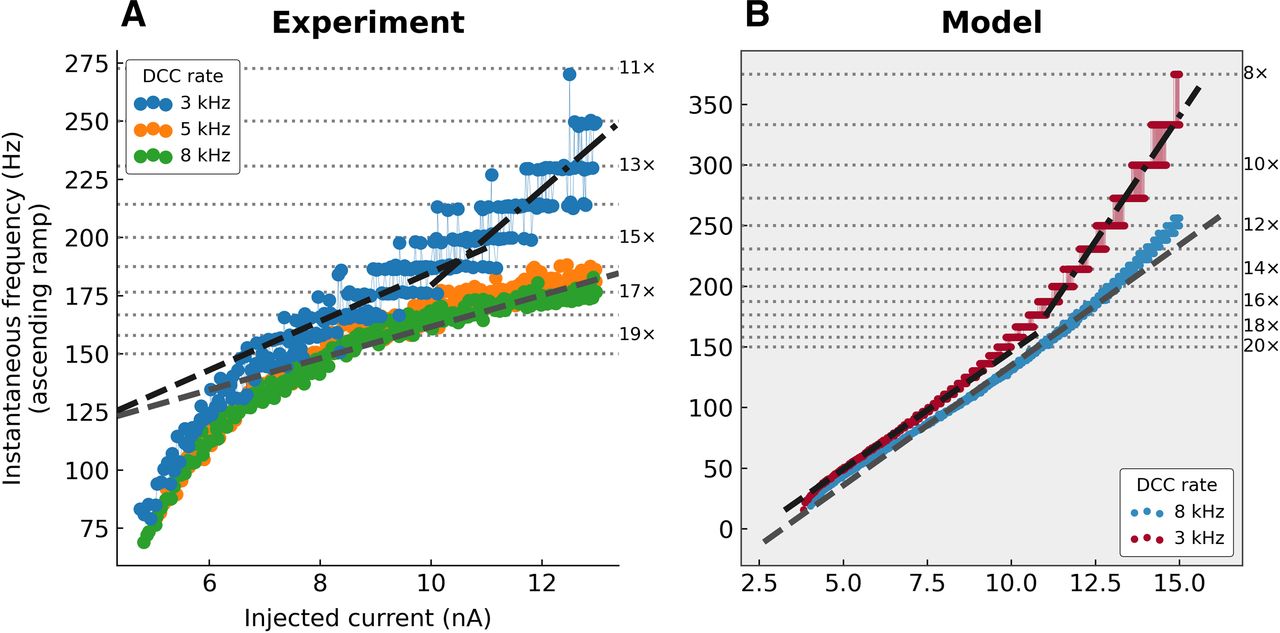
- Figure 7.
Apparent change of slope in the F-I curve associated with discrete firing intervals. A, F-I curves from a triceps surae motoneuron (Rin = 4.1 MΩ; τm = 3.3 ms). A fast triangular ramp of current (amplitude 13 nA, 5 nA/s) was injected to drive the firing at high frequency. The instantaneous firing frequency is plotted against the ascending ramp current intensity. Gray dashed line, Slope of the F-I curve recorded at 8 kHz measured in the second half of the curve. Black dashed line, Slope of the F-I curve recorded at 3 kHz, measured over the range 7–10 nA. Black dash-dotted line, Slope of the F-I curve recorded at 3 kHz, measured over the range 11–13 nA. Horizontal dotted lines, Subharmonics of the 3-kHz DCC rate. The numbers on the right of each line show the number of DCC period per ISI. B, F-I curves obtained in a model with Rin = 2.5 MΩ and τm = 2.0 ms. Compared with the F-I curve obtained with a high DCC rate of 8 kHz, which is mostly linear (gray dashed line), the F-I curve obtained with a DCC rate of 3-kHz changes slope at ∼10 nA, from a slope roughly equal to the one measured at 8 kHz to a much steeper slope.
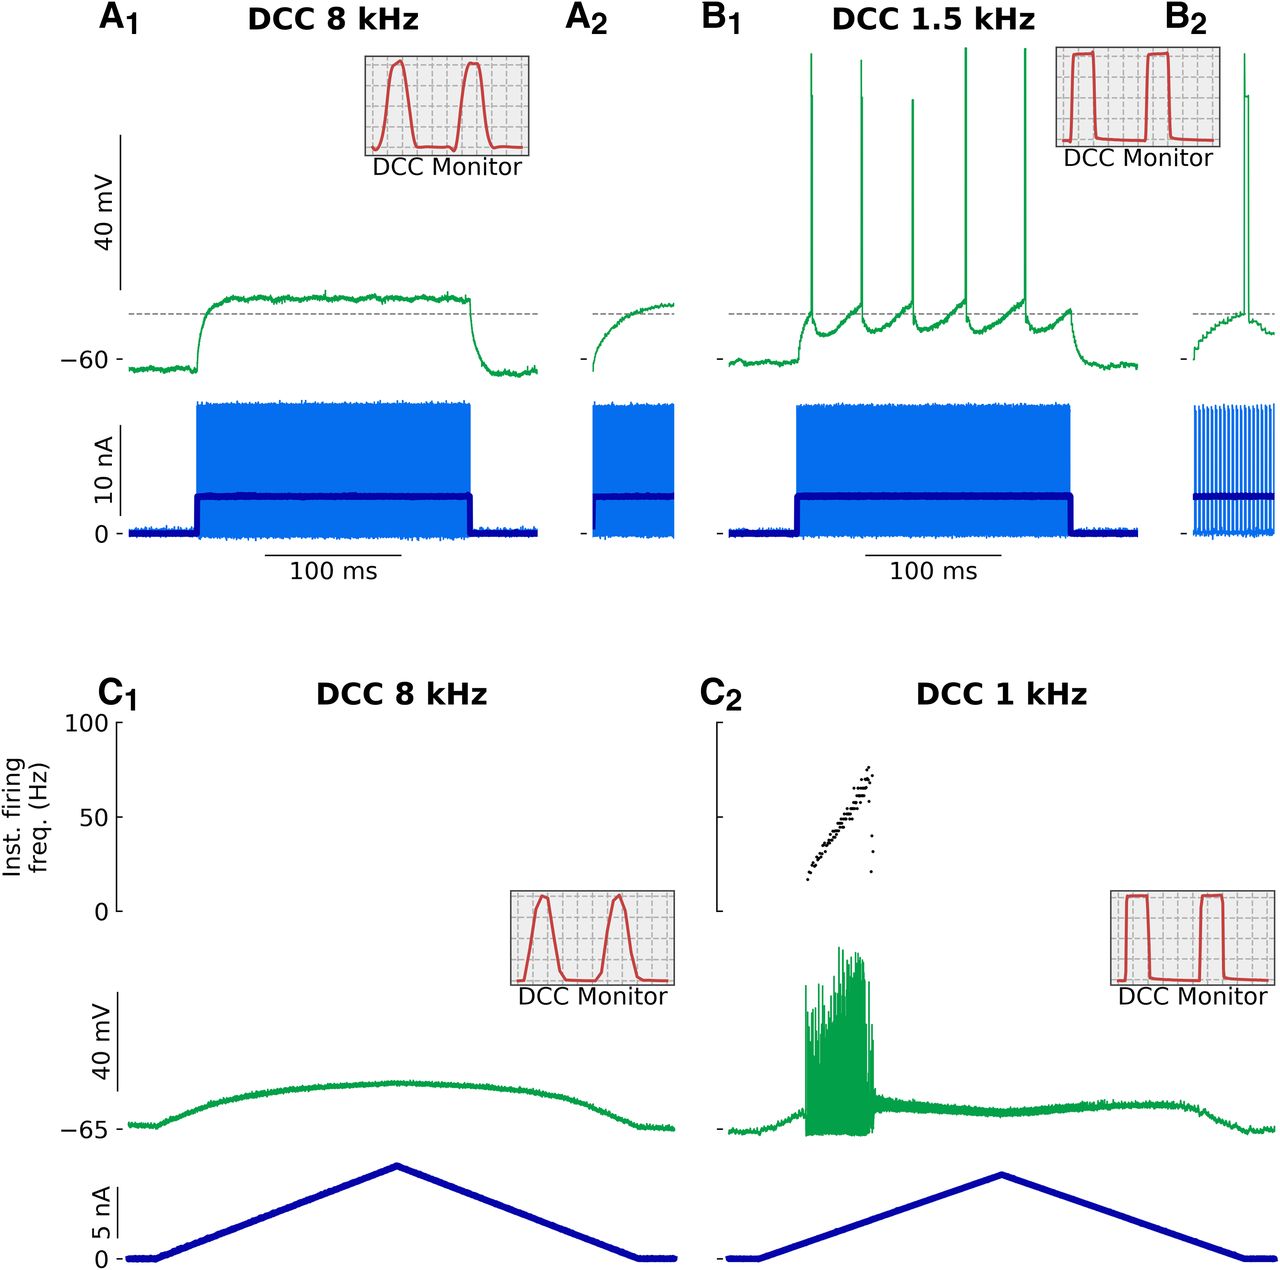
- Figure 8.
Spurious firing elicited by low DCC rates. A, B, Recording from a triceps surae motoneuron (Rin = 3.5 MΩ; τm = 4.9 ms) following the injection of a 200-ms-long 4-nA pulse of current. A, Response recorded with a DCC rate of 8 kHz. The inset in A2 is a zoom over the first 15 ms following the onset of the pulse. B, Response recorded with a DCC rate of 1.5 kHz. The inset in B2 is a zoom over the first 15 ms following the onset of the pulse. The horizontal dashed line represents the voltage threshold measured at the foot of the first spike of the response in B. The gray boxes in A, B represent the monitoring traces used to check the settling of the electrode, recorded at the top of the ramp. Time bases: 25 μs (C1) and 133 μs (C2) per division. C, Response of a triceps surae motoneuron (Rin = 5.0 MΩ; τm = 4.7 ms) to the injection of a triangular ramp of current (1 nA/s) with a DCC rate of 8 kHz (C1) and 1 kHz (C2). The bottom trace is the injected current, the middle trace is the membrane potential and the top graph is the instantaneous firing frequency. The insets represent the monitoring traces used to check the settling of the electrode, recorded at the top of the ramp. Time bases: 25 μs (C1) and 200 μs (C2) per division.


In this issue


