

Article Figures & Data
Figures
- Figure 1.
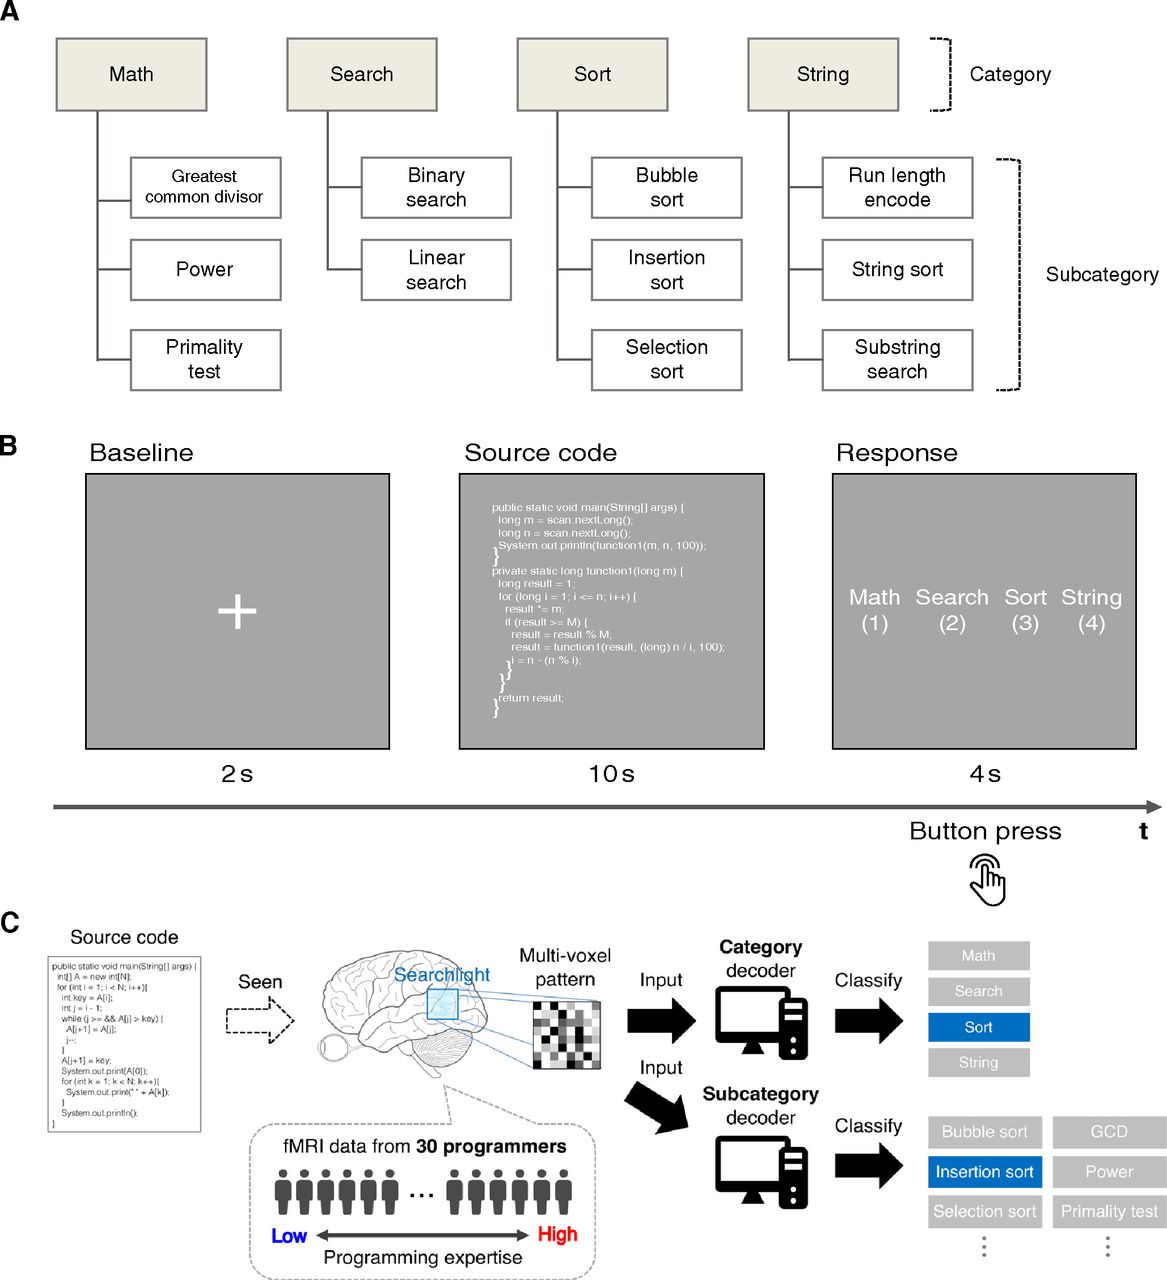
Experimental design. A, Hierarchy of categories used in this study. Category and subcategory represent abstract functionality and concrete algorithms, respectively, based on two popular textbooks of programming. Every code snippet used in this study belonged to one subcategory class and its corresponding category class. B, Program categorization task. After a fixation-cross presentation for 2 s, a Java code snippet was displayed for 10 s in white text without any syntax highlight. Then, subjects responded the category of given code snippet by pressing a button. C, Overview of the decoding framework. MRI data were collected from 30 subjects with different levels of programming expertise while they performed the program categorization task. Whole-brain searchlight analysis (Kriegeskorte et al., 2006) was employed to explore the potential loci of programming expertise. For each searchlight location, a linear-kernel SVM classifier (decoder) was trained on multivoxel patterns to classify category or subcategory of given Java code snippets.
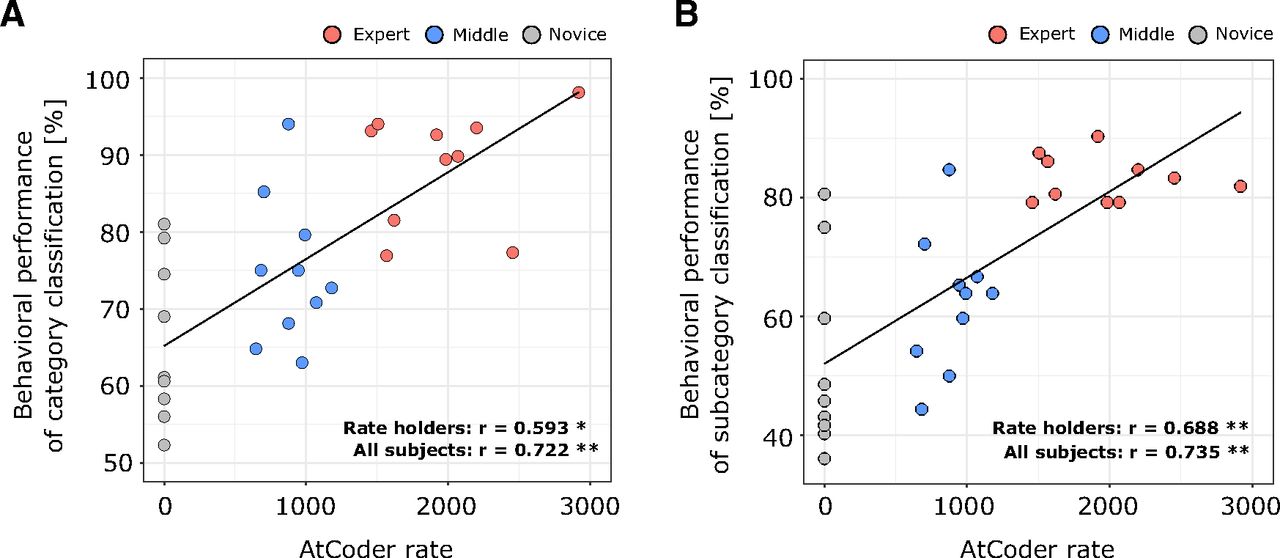
- Figure 2.
Correlations between behavioral performance and programming expertise indicator. A, Scatter plot of behavioral performances of category classifications against the values of adopted expertise reference (i.e., AtCoder rate). B, Scatter plot of behavioral performances of subcategory classifications against the values of the same expertise reference. Each dot represents an individual subject. Significance of the correlation coefficients (r) was denoted as *p < 0.05 and **p < 0.005. The solid lines indicate a fitted regression line estimated from all subject data.
- Figure 4.
Searchlight-based correlation analysis between behavioral performances and decoding accuracies. A, Locations of searchlight showing significant correlations. Significance was determined by a threshold of voxel-level p < 0.001 and cluster-level p < 0.05, FWE corrected for the whole brain. B, Slice-wise visualizations of the significant clusters using bspmview (http://www.bobspunt.com/software/bspmview). C, Correlation between behavioral performance and decoding accuracy. Each dot represents an individual subject data. For all significant clusters and peak correlations, see Table 2. SMG, supramarginal gyrus; IPL, inferior parietal lobule; MTG, middle temporal gyrus; IT, inferior temporal gyrus; SFG, superior frontal gyrus; MFG, middle frontal gyrus; IFG Tri, inferior frontal gyrus pars triangularis; IFG Orb, inferior frontal gyrus pars orbitalis; MCC, medial cingulate cortex.
- Figure 7.
Searchlight-based correlation analysis between behavioral performances and subcategory decoding accuracies. A, Locations of searchlight showing significant correlations. Significance was determined by a threshold of voxel-level p < 0.001 and cluster-level p < 0.05, FWE corrected for the whole brain. B, Slice-wise visualizations of the significant clusters. C, Correlation between behavioral performance and decoding accuracy. Each dot represents an individual subject data. Only one cluster (extent = 501 voxels) had significant correlation in this analysis and three peak correlations in the cluster were shown here. STG, superior temporal gyrus.
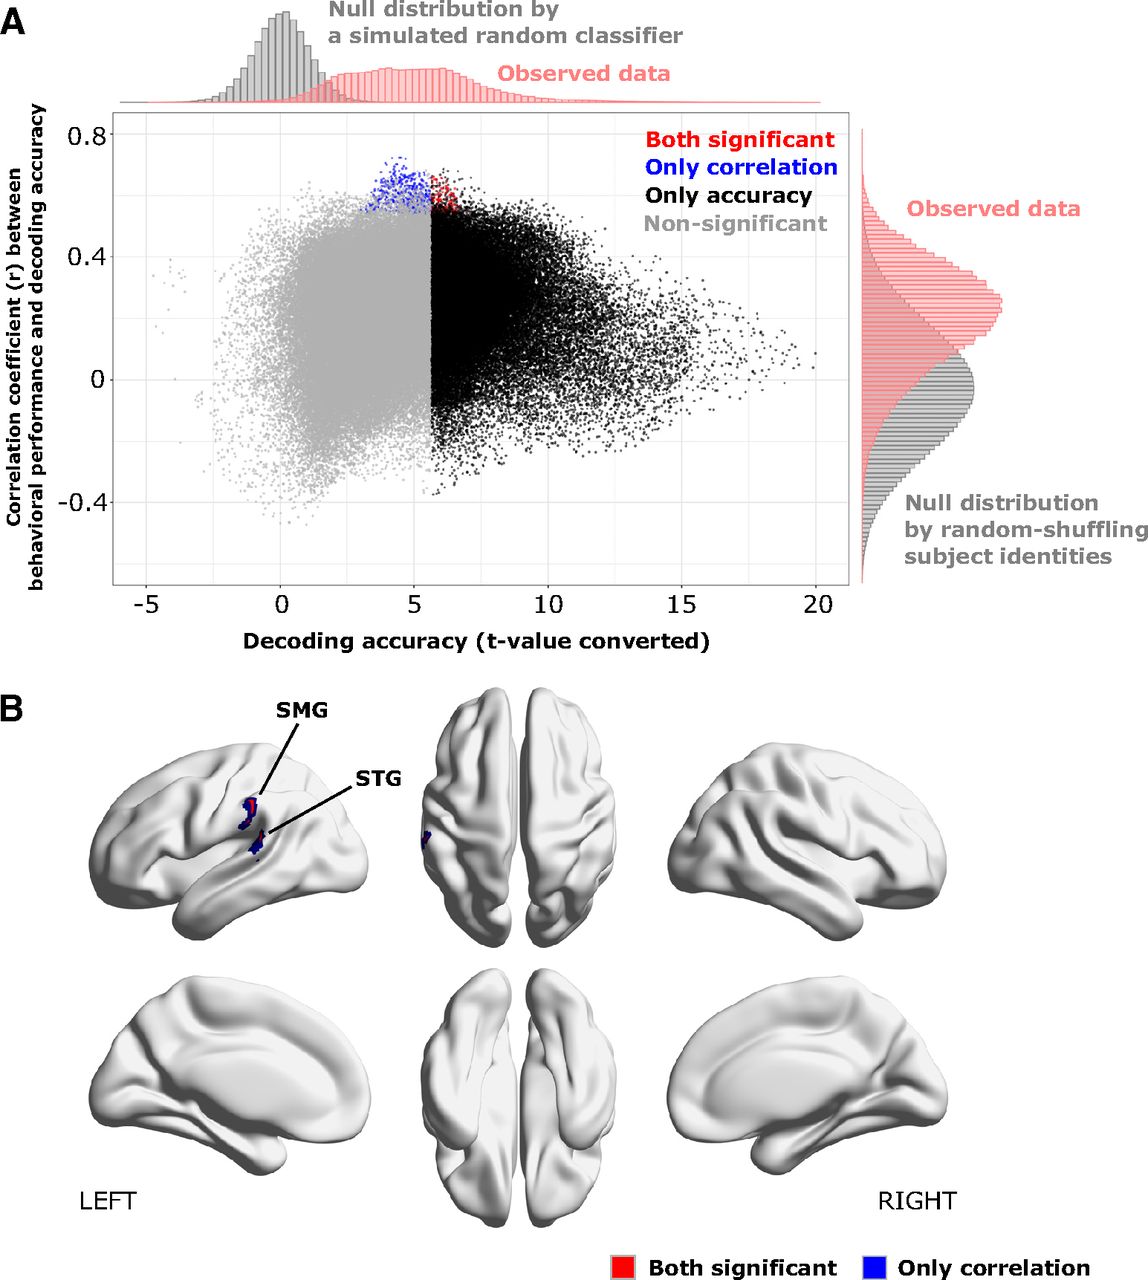
- Figure 8.
Identifying searchlight centers that showed both significant subcategory decoding accuracy and significant correlation to individual behavioral performances. A, Scatter plot of searchlight results; x-axis shows t values calculated from all subjects’ decoding accuracies on each searchlight locations; y-axis indicates correlation coefficients between subcategory decoding accuracies and behavioral performances. Red-colored dots denote the searchlights showing both significant decoding accuracy and correlation, while blue and black denote those only showed significant decoding accuracy or correlations. Non-significant searchlights were colored in gray. The observed distributions of subcategory decoding accuracies and correlations are respectively shown on top-side and right-side of the figure accompanied with null distributions calculated by randomized simulations. B, Locations of searchlight centers that showed both significant subcategory decoding accuracy and significant correlations to individual behavioral performances.


Tables
N Sex (M/F) Age AtCoder rate PE (year) JE (year) CPE (year) Expert 10 10 / 0 22.6 ± 1.1 1969 ± 467 6.9 ± 2.8 2.8 ± 2.4 4.1 ± 2.6 Middle 10 9 / 1 22.5 ± 0.8 894 ± 175 4.8 ± 1.7 1.1 ± 0.8 1.3 ± 0.8 Novice 10 9 / 1 21.7 ± 1.2 NA 2.8 ± 0.6 1.4 ± 1.0 NA Numerics from fourth (age) to last columns denote mean ± SD. PE, programming experience; JE, JAVA experience; CPE, competitive programming experience. Significant differences were observed between PE of expert-novice, middle-novice; CPE of expert-middle (two-sample t test, p < 0.05 FDR-corrected).
- Table 2
Clusters showing significant correlations between behavioral performance and category decoding accuracy (voxel-level p < 0.001 and cluster-level p < 0.05, FWE-corrected)
MNI coordinates Region name x y z Peak corr. (r) t value Cluster extent R IFG (Tri) 46 22 8 0.789 6.81 369 L posterior-medial frontal −12 0 66 0.711 5.36 298 R superior medial gyrus 6 52 42 0.699 5.17 587 L IPL −56 −28 50 0.698 5.16 649 R SFG 24 4 60 0.675 4.84 428 L IFG (Tri) −52 30 24 0.671 4.79 346 L IT −50 −54 0 0.635 4.35 347 Region names were identified using automated anatomic labeling atlas 2 (Rolls et al., 2015).
Extended Data Figure 1-1
Description of categories and subcategories provided to subjects in the experiment. Download Figure 1-1, XLSX file.
Extended Data Figure 1-3
Java code snippets used in the study. A total of 72 types of Java code snippet were used in this study. Each belonged to one subcategory and its corresponding category shown in Figure 1A. This figure shows example snippets for each subcategory class. Download Figure 1-3, EPS file.
Extended Data Figure 2-1
Behavioral performance of each category in the fMRI experiment. Numerics from 3rd (Math) to last columns denote mean ± SD. One-way ANOVA found no significant difference in behavioral performances between categories for any groupings (expert, F(3,36) = 1.38, p = 0.27; middle, F(3,36) = 2.99, p = 0.06; novice, F(3,36) = 2.81, p = 0.07; all, F(3,116) = 2.02, p = 0.12). Download Figure 2-1, XLSX file.
Extended Data Figure 3-1
Box plots of the voxel-level peak category decoding accuracies on several brain regions. Each dot represents decoding accuracy of individual subject. The dashed line indicates chance-level accuracy (25%). SMG, supramarginal gyrus; IPL, inferior parietal lobule; MTG, middle temporal gyrus; IT, inferior temporal gyrus; IFG Tri, inferior frontal gyrus pars triangularis. Download Figure 3-1, EPS file.
Extended Data Figure 6-1
Box plots of the voxel-level peak subcategory decoding accuracies on several brain regions. Each dot represents decoding accuracy of individual subject. The dashed line indicates chance-level accuracy (9.72%). SMG, supramarginal gyrus; IPL, inferior parietal lobule; MTG, middle temporal gyrus; IT, inferior temporal gyrus; IFG Tri, inferior frontal gyrus pars triangularis. Custom software code. The custom MATLAB code used for the decoding analysis in the paper. Download Figure 6-1, EPS file.
In this issue


