

Article Figures & Data
Figures
- Figure 1.
Ethanol-sensor response can be deconvolved using a difference of two exponential kernel. A, Representative traces of the PID (red) and the ethanol-sensor (blue) response to brief ethanol presentations. The duration of the ethanol pulse is indicated at the top of each column. B, Ethanol-sensor responses from individual presentations (gray) were averaged to estimate the rise time (τRise) to be around 60 ms (magenta) and the decay time (τDecay) to be around 3.5 s (cyan). C, Optimization of the deconvolution kernel by minimizing the mean error between the deconvolved ethanol responses and the PID responses (see Materials and Methods) using a family of kernels with varying τRise and τDecay values. D, The deconvolved ethanol signal (blue) from the raw recordings of the ethanol sensor shown in A compared with the PID recordings. The inset shows the zoomed-in view of the normalized deconvolved ethanol response and the PID response to compare the waveforms of the PID response and the deconvolved ethanol signal. The black bar in the inset shows the duration of ethanol presentation. E, A linear relation exists between the threshold time (time from the valve opening to 5% of the max) between the deconvolved ethanol signals and the PID responses. Inset shows the zoomed-in view of the cluster of points in the ranges shown.
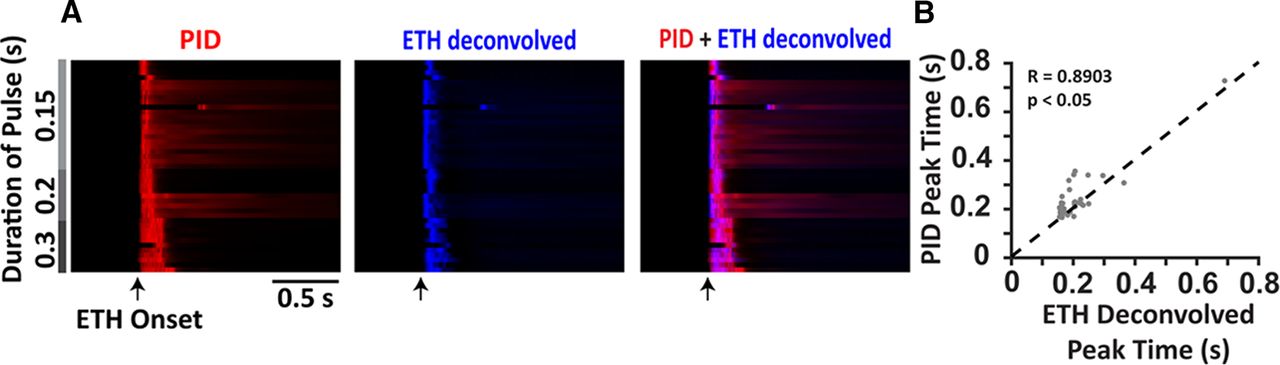
- Figure 2.
Peak times of the deconvolved ethanol signals coincide with the peak times of the PID responses for brief pulses of ethanol. A, Summary data of PID responses (red; left) and the deconvolved ethanol signals (blue; center) to brief durations of ethanol pulses (shown in gray) presented as a heatmap where each row is a single trial aligned with respect to the valve opening (arrow). Overlaying the deconvolved ethanol signals over the PID responses (right) shows coincidence of the peaks from the two signals (magenta). B, Linear relation between the peak times of the PID responses and the peak times of the deconvolved ethanol signals.
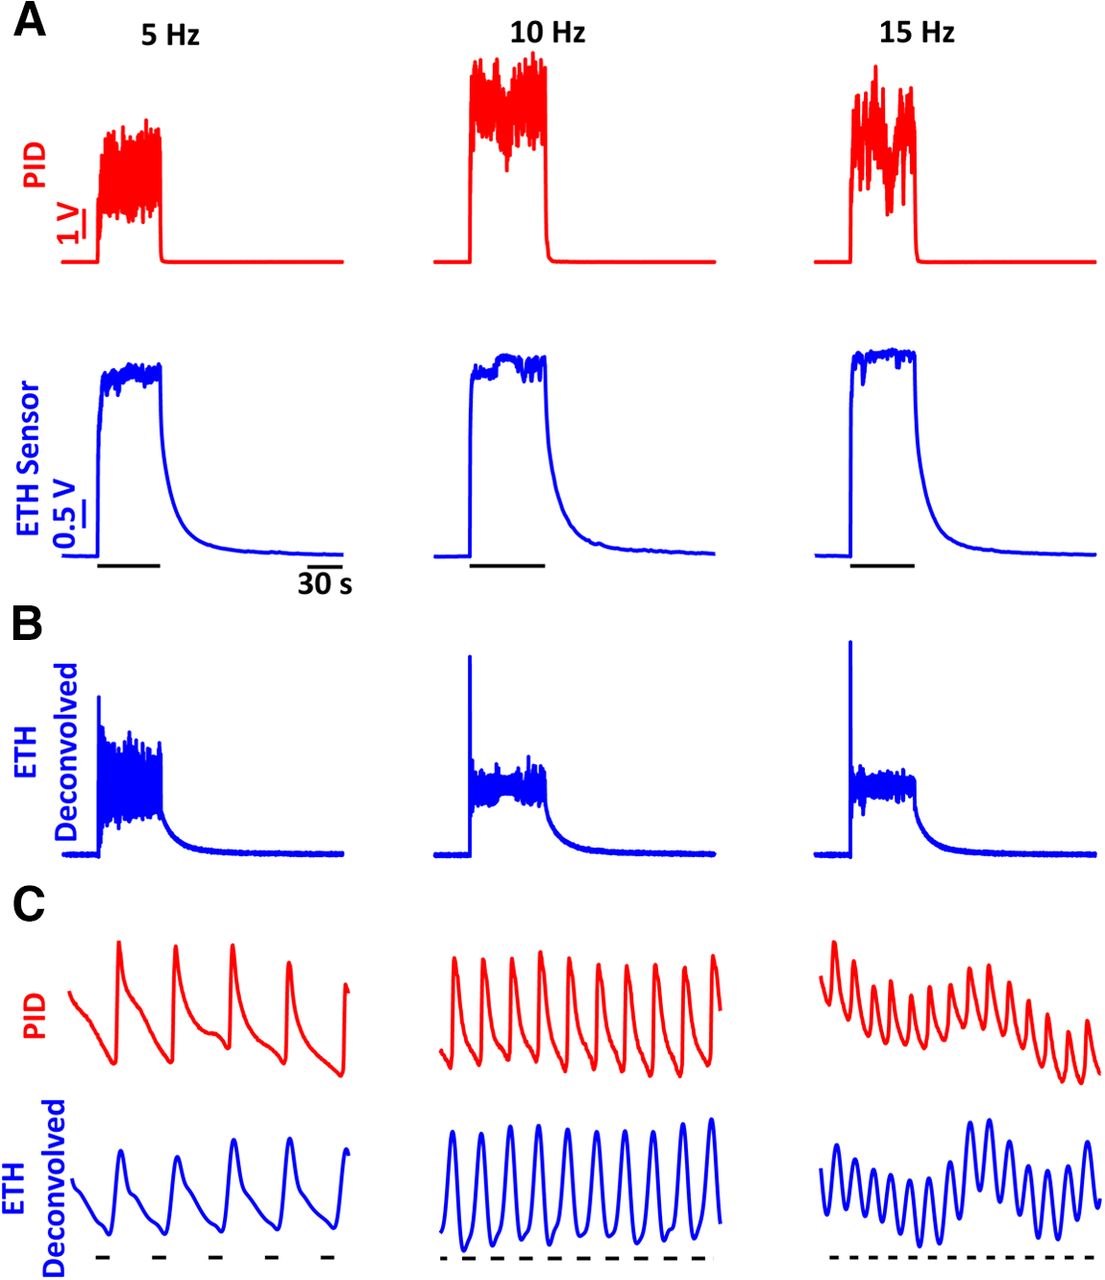
- Figure 3.
Frequency responses of the ethanol sensor show that the sensor can resolve frequencies of ethanol fluctuations up to 15 Hz. A, PID (red) and ethanol-sensor (blue) responses to single trials of ethanol fluctuations of 5 Hz (left), 10 Hz (center), and 15 Hz (right) frequencies. B, Deconvolved signals of the raw ethanol-sensor recordings presented in A. C, A 1-s zoomed-in view of the PID responses (red) and deconvolved ethanol signal (blue) showing near identical responses in the deconvolved signals and the PID recordings. The black bars underneath the traces indicate the times when the valve was open.
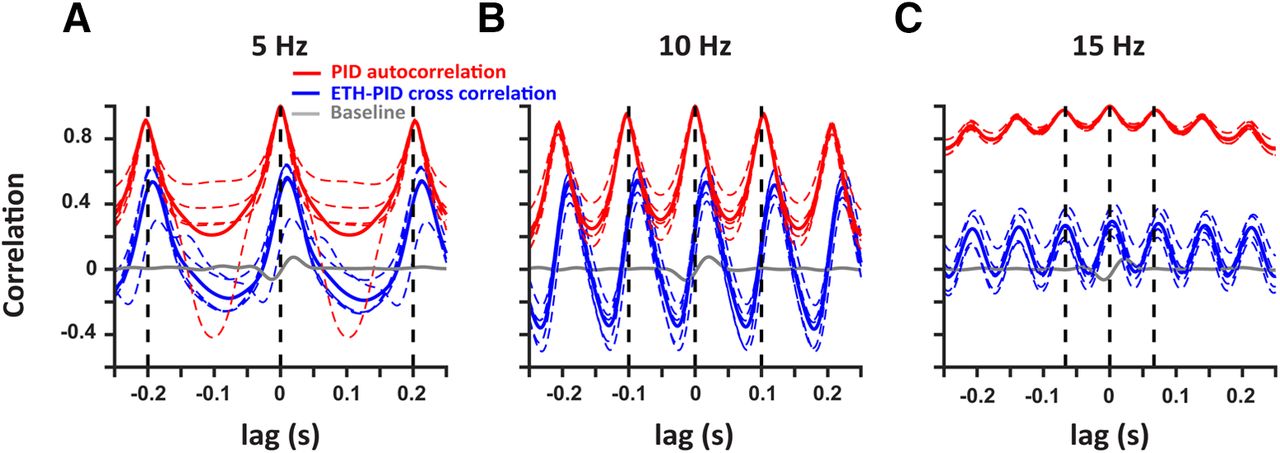
- Figure 4.
Deconvolved ethanol signals are correlated with the PID signals at multiple frequencies. Cross-correlation of the deconvolved ethanol signal with the PID signal during stimulation (blue) at 5 Hz (A), 10 Hz (B), and 15 Hz (C) shows robust correlation as compared with baseline (gray). In addition, autocorrelation of the PID signals within each trial are also presented (red). The colored dashed traces represent individual trials and solid traces represent the mean. The black vertical dashed lines indicate the period for each frequency.
- Figure 5.
Deconvolved ethanol signals are correlated with the PID responses in turbulent airflow. A, Overhead image of a custom-designed arena [2 m (l), 0.9 m (w), 0.9 m (h)] to create dynamic odor plumes. The dashed circle represents the location of the source of ethanol port while the arrow points out the wind direction. Also indicated are the approximate locations near the port (1), near the middle of the arena (2), and farthest downwind (3) where paired PID and ethanol-sensor recordings were conducted. B, Representative traces of the PID (red) and deconvolved ethanol (blue) signals at the locations indicated in A. The black bars represent the ethanol stimuli. Notice the changing scales for the amplitude at farther distances from the ethanol port. C, Cumulative distributions of PID correlations across pair-wise combinations of different trials (red) versus correlations between the PID and the ethanol signals within a trial (blue) for the different locations. D, Mean ± standard deviation (SD) correlations (bars) at locations near port (1), near the middle of the arena (2), and farthest downwind (3) from the ethanol port. Circles are the correlations of individual trials.
- Figure 6.
Ethanol plume detected by the ethanol sensor coincide with neural processing in the OB. A, A representative cranial window over the dorsal surface of the OB of a Thy1-GCaMP6f GP5.11 mouse. Left is at rest while right is the SD image after ethanol plume exposure. B, Representative traces showing different times of ethanol plume detection by the sensor after valve opening across six trials. C, Calcium traces from 10 different glomeruli aligned to the first peak of the ethanol plume (dashed line). D, Mean ± SEM traces from six glomeruli averaged over 40 different ethanol plume exposures zoomed in to focus the moment of plume contact. E, Movement in the first two PCs (accounting 48% of the variance) space post ethanol plume exposure from the data presented in C, D. F, Sum of the Euclidean distance from rest across all the PCs aligned to plume detection from five different imaging sessions. Each trace is the mean ± SEM across 40 ethanol plume presentations during each session.
- Figure 7.
Plume contacts detected by the head-mounted ethanol sensor correlate with behavioral changes in freely behaving rodents. A, An example trajectory of a mouse engaged in odor-guided navigation in our custom-designed arena. Overlaid are the points indicating the locations where plume contacts occurred with the color and size of the points varying by the magnitude of the ethanol plume signal, shown in B, measured by the head-mounted sensor. B, The deconvolved ethanol signal (top), recorded by the head-mounted sensor, with the body speed (bottom) of the animal over the course of a single trial trajectory, shown in A. The plume contacts, set by a threshold, and the magnitude, indicated by the change in color from red (low) to blue (high) are overlaid on the deconvolved ethanol signal. The plume contact is shown to reduce the body speed of the animal. In addition, the plume contact can also be seen to cause a change in the orientation of the animal apparent in A. C, D, Same as A, B but from another trial where the location of the ethanol source is changed. Inset in the top panel of D shows the zoomed-in view of the deconvolved ethanol signal within the window indicated by the dashed line.
- Figure 8.
Plume contacts are intermittent and on average are correlated with a reduction in the speed of freely behaving animals. A, Trajectories of multiple animals over different trials during a 2-s period before and after plume contacts for a single ethanol-source location are presented showing that the plume contacts are intermittent and guided by turbulence (left). The color of the trajectories corresponds to the log of the deconvolved ethanol signal (see Materials and Methods). For comparison, equal time-sized trajectories, randomly selected during the non-plume-contact portion of the trials, are presented (right). B, The body speed profile, denoted by the color, peri-plume contacts are presented for the trajectories shown in A. Black plus sign is the beginning of the trajectory while the white circle denotes the position at the time of the threshold crossings signifying plume contacts (left). For the randomized (right) case, the black plus sign again denotes the start of the trajectory while the white circle is the position at the middle of the time window. C, Heatmaps of the log of the deconvolved ethanol signal (Ci), head speed (Cii), and the body speed (Ciii) centered around the time of plume contact (dashed white line) sorted by the distance from the source at the time of contact reveal the decrease in the head and body speeds on plume contacts. For comparison, the randomized heatmaps during the non-plume-contact portion of the trajectories are also presented. Colormap for Ci corresponds with the colormap in A, while colormaps for Cii, Ciii correspond with the colormap in B. D, Mean ± SEM from multiple contacts over different trials and animals, shown in C, are presented for the deconvolved ethanol signal (i), head speed (ii), and the body speed (iii), showing clear reduction in the mean head and body speed on plume contact.


In this issue


