

Article Figures & Data
Figures
- Figure 1.
Microarray data suggest that P4H-TM regulates calcium signaling. A–D, Male P4H-TM KO mice and their WT littermates were killed at the age of 2.5 months, and cortexes were collected for microarray analysis. Gene expression was compared between WT and KO and significantly enriched datasets were selected according to GSEA with default settings, i.e., p < 0.05. Red color represents upregulated and blue color downregulated genes. Four individual mice were used per genotype in the experiment. Enrichment scores with a ranked list metrics (left) and heat map of 23 leading edge genes (right) are shown for the following biological pathways: (A) GSEA for calcium signaling pathway, (B) membrane trafficking, (C) oxidative phosphorylation, and (D) SNARE interactions in vesicular transport. E, WT mice were killed either for dissection of cortexes or for isolation of primary cortical astrocytes. Cortexes were isolated from E15, P1, and P27 mice, while primary astrocytes were isolated from P1 to P2 mice and cultured for 10 d for P4h-tm mRNA analysis by qRT-PCR; n = 4 mice for tissue dissection per time point and n = 3 individual cultures per genotype, 6 mice per genotype. F, qRT-PCR analysis of mRNA expression of different calcium pumps in primary cortical astrocytes. Plasma membrane calcium ATPase 2 (PMCA2) and 3 (PMCA3) and ER calcium ATPase 3 (SERCA3) mRNAs were found to be upregulated in P4H-TM KO versus WT cells; n = 9–12, 4 individual cultures per genotype with two to three technical replicates each, 12 mice per genotype. G–I, Western blot analysis of expression of PMCA2 (G), PMCA3 (H), and SERCA2 (I) proteins in P4H-TM KO versus WT primary cortical astrocytes. Representative blots are shown (upper panels) and the intensity of bands is quantitated by densitometry (lower panels), n = 3–4 individual cultures per genotype, 6–8 mice per genotype. β-Actin represents a loading control in G, I, while in H, it represents a control of equal protein amount in the samples, because the high amount of protein needed for PMCA3 detection resulted in overloading of β-actin, and it therefore could not be analyzed from the same gel. Data information: data (E–I) are presented as mean ± SEM; *p < 0.05, **p < 0.01, ***p < 0.001 (Student’s t test). r.u., relative unit.
- Figure 2.
P4H-TM inactivation affects agonist-evoked changes in cytosolic calcium concentrations. A–F, H, Primary cortical astrocytes were isolated from P4H-TM KO and WT mice and loaded with Fluo-4. Representative traces of P4H-TM KO and WT astrocytes are shown on the graphs. Changes in cytosolic calcium [Ca2+]i peak or plateau amplitudes are shown in the diagrams. A–E, The increase in [Ca2+]i was evoked by either ATP (100 μm) or TG (10 μm) in a calcium-containing buffer. A, Fluorescence of the Fluo-4 calcium indicator captured by a spinning disk confocal microscope. Panels show a time point before the treatment and two time points after stimulation with ATP and illustrate a massive increase in the signal a few seconds after addition of ATP, followed by a subsequent decay. Scale bar: 60 μm. B, Changes in [Ca2+]i in P4H-TM KO versus WT astrocytes on treatment with ATP, 2-APB + ATP, and TG. In 2-APB + ATP the cells were preincubated with 2-APB (25 μm; inhibitor of IP3R) 2 min before ATP addition; n = 46 cells per genotype in ATP, n = 14 cells per genotype in 2-APB-2 + ATP and n = 46–61 cells per genotype in TG, 4 mice per genotype. C–E, Changes in [Ca2+]i in HIF-P4H1 KO (C, n = 20 cells in ATP and n = 13–18 cells in TG per genotype, 3 mice per genotype), HIF-P4H2 hypomorph (D, n = 15–19 cells per genotype, 3 mice per genotype), and HIF-P4H3 KO (E, n = 18–25 cells per genotype, 3 mice per genotype) versus corresponding WT after stimulation with either ATP or TG. F,G, TG-evoked changes in [Ca2+]i in P4H-TM KO and WT astrocytes in EGTA (2 mm)-containing buffer and the effect of readdition of 20 mm calcium, n = 31–35 cells per genotype, 4 mice per genotype. H, qRT-PCR analysis of Stim and Orai isoform mRNA levels in P4H-TM KO and WT astrocytes, n = 7–11, 3–4 individual cultures per genotype with one to three technical replicates each, 9–12 mice per genotype. I,J, Changes in [Ca2+]i in P4H-TM KO and WT astrocytes evoked by ionomycin (1 μm) in the presence of EGTA (2 mm) in the buffer, n = 23–31 cells per genotype, 3 mice per genotype. Data information: data are presented as mean ± SEM in B–J; ##p < 0.01 by Tukey’s HSD test after one-way ANOVA method for multiple comparisons; *p < 0.05, **p < 0.01, ***p < 0.001 by Student’s t test. r.u., relative unit. ns, not significant.
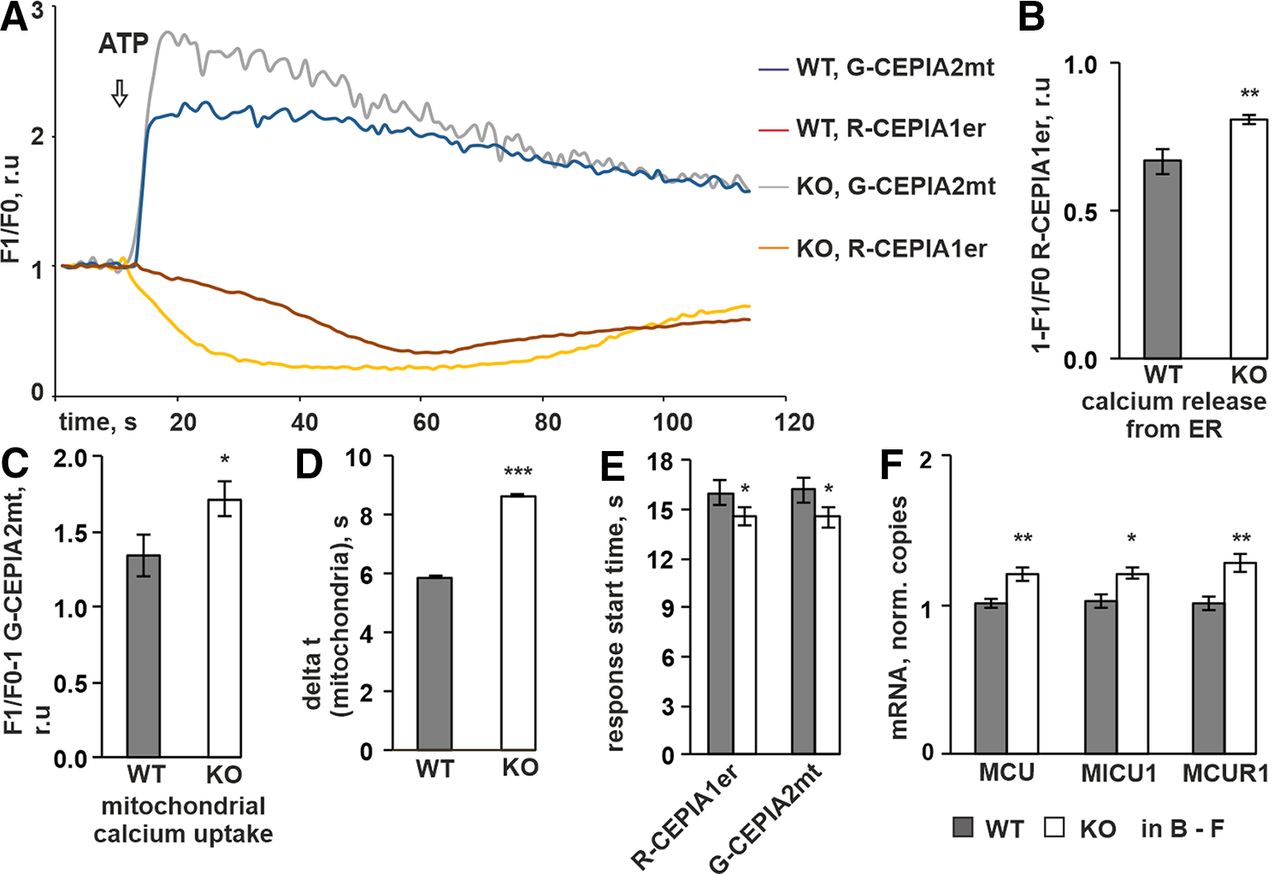
- Figure 3.
P4H-TM KO affects mitochondrial and ER calcium dynamics in response to ATP. A–E, P4H-TM KO and WT primary cortical astrocytes were co-transfected with G-CEPIA2mt (to measure mitochondrial calcium concentration) and R-CEPIA1er (to measure changes in ER calcium concentration), and fluorescence intensity was recorded during time-lapse imaging in a calcium-containing buffer. The astrocytes were stimulated with 100 μm ATP. Analysis of time-lapse images was done on n = 26 cells per genotype, 6 mice per genotype. A, Representative traces of the ATP-induced changes in ER and mitochondrial calcium concentrations. Time course of F1/F0 ER calcium signal indicates red fluorescence decrease on ATP treatment proportional to decrease of free calcium amount inside the ER. Time course of F1/F0 mitochondrial calcium signal indicates sudden increase in green fluorescence on ATP treatment proportional to rapid accumulation of calcium inside mitochondria. In the majority of cells, decrease in ER calcium signal preceded increase in mitochondria calcium signal. B–D, Amplitudes of ER and mitochondria calcium response to ATP were defined as maximum change in F1/F0 (fluorescence intensity after ATP application normalized by the resting value) within a 2-min time window after ATP application. B, The ATP-evoked release of ER calcium was higher in P4H-TM KO astrocytes. C, The ATP-evoked increase in mitochondrial calcium was higher in P4H-TM KO astrocytes. D, Time necessary for mitochondria to reach the maximum amplitude of calcium response starting from the resting level. E, Time point when the red fluorescence (ER signal) starts to decrease and the green fluorescence (mitochondrial signal) starts to increase on ATP treatment. The data indicate that P4H-TM KO astrocytes overall react faster to ATP stimulation than WT astrocytes. F, qRT-PCR analysis of mRNA levels for the mitochondrial uniporter channel complex components MCU, MICU1, and MCUR1 in P4H-TM KO and WT astrocytes, n = 8–12, 3–4 individual cultures per genotype with two to three technical replicates each, 9–12 mice per genotype. Data information: data are presented as mean ± SEM in B–F; *p < 0.05, **p < 0.01, ***p < 0.001 by Student’s t test. r.u., relative unit.
- Figure 4.
P4H-TM KO affects passive calcium leak through translocon complex and IP3R. A, B, P4H-TM KO and WT primary cortical astrocytes were loaded with Fluo-4, and live cell calcium imaging was performed in the presence of the indicated pharmacological inhibitors. Representative traces of P4H-TM KO and WT astrocytes are shown on the graphs. Changes in cytosolic calcium [Ca2+]i peak or plateau amplitudes are shown in the diagrams. A, The increase in [Ca2+]i evoked by stimulating the cells with TG (10 μm) was attenuated by the translocon inhibitor anisomycin (200 μm, 10 min before TG), but not by the IP3R inhibitor 2-APB (25 μm, 2 min before TG), n = 22–38 cells per genotype, 5 mice per genotype per condition. Imaging was performed in a calcium-containing buffer. B, Application of an inhibitor of translation (puromycin, PURO, 200 μm) induced a higher increase in [Ca2+]i in P4H-TM KO astrocytes versus WT in EGTA-containing buffer, n = 16 cells per genotype, 3 mice per genotype. C, qRT–PCR analysis of mRNA expression levels for the translocon complex subunits SEC61 A, B, and G in P4H-TM KO and WT astrocytes, n = 7–12, 3–4 individual cultures per genotype with one to three technical replicates each, 9–12 mice per genotype. D, E, Western blot analysis of expression of translocon subunits SEC61 A, B, and G, in P4H-TM KO and WT astrocytes. Representative Western blots (D) and their quantification, n = 4 individual cultures per genotype, 4 mice per genotype (E) are shown. β-Actin represents a loading control. F, G, Western blot analysis of phosphorylation of elF2a and Erk1/2 and p38 kinases in P4H-TM KO and WT astrocytes after treatment with 10 μm TG for the indicated time points. Representative Western blots (F) of the phospho and total forms are shown. β-Actin is shown to confirm equal protein amount in the samples. Western blot quantification, n = 3–4 individual cultures per genotype, 3–4 mice per genotype (E) are shown. Data information: data are presented as mean ± SEM in A–C, E. In A: *p < 0.05, **p < 0.01 by Holm test after one-way ANOVA for multiple comparisons. In B, C, E, G: *p < 0.05, **p < 0.01, ***p < 0.001 by Student’s t test. r.u., relative unit.
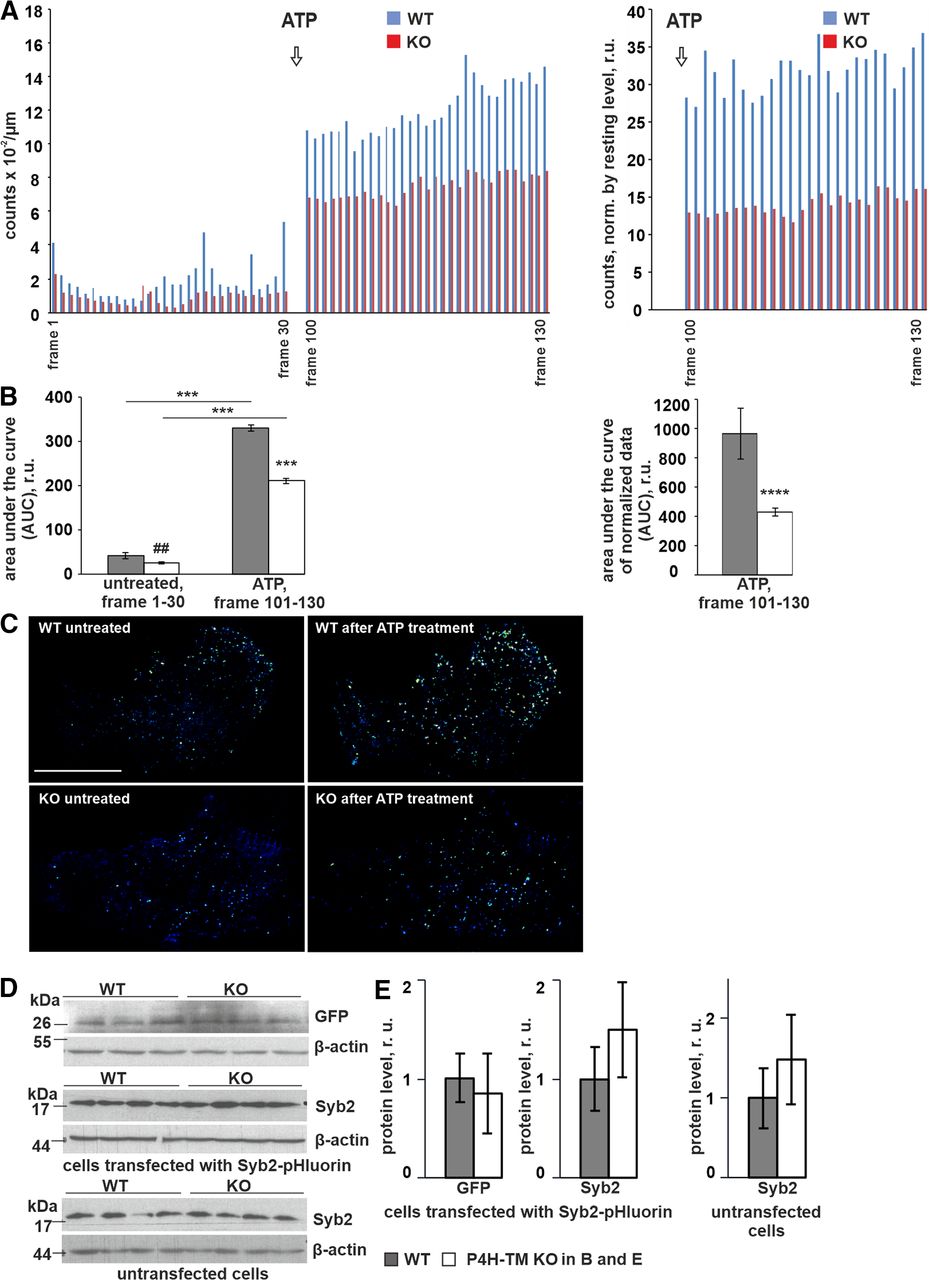
- Figure 5.
P4H-TM KO affects vesicular exocytosis induced by ATP. Primary cortical astrocytes were transiently transfected with Syb2-pHluorin to label small vesicles. To characterize the time course of vesicle release on the basal plasma membrane, time-lapse image series were generated by taking TIRF images every 1 s over ∼2 min (130 frames). Cells were treated with 100 μm ATP to stimulate calcium-dependent exocytosis, and bright punctate that appeared and then disappeared in the evanescent field was classified as a fusion/release event. A, Analysis of TIRF images was done on 22–25 cells per genotype, 3 individual cultures per genotype, 6 mice per genotype. Number of fusion/release events, which is proportional to the exocytosis rate was quantified using ZEN and then ImageJ software. Each column indicates the average number of fusion/release events in each imaging frame. The number of both spontaneous and ATP-induced fusion/release events (left panel) as well as the number of ATP-induced events normalized by spontaneous signal (right panel) was lower in P4H-TM KO astrocytes when compared with WT. Data are presented as mean. B, Quantification of TIRF data displayed in panel A. The area under the curve (AUC) was calculated using GraphPad Prism software from raw data (left panel) and from normalized data (right panel) from time 0 to 30 s (before ATP treatment, left panel) and from time 100 to 130 s (after ATP treatment, left and right panels) in P4H-TM KO and WT astrocytes, n = 22–25 cells per genotype, 3 individual cultures per genotype, 6 mice per genotype. C, Representative background subtracted ratio images of TIRF microscopy showing secretion of Syb2-pHluorin-positive vesicles on the basal plasma membrane. Panels show a time point before and after the ATP treatment and illustrate an overall lower exocytosis rate in P4H-TM KO astrocytes when compared with WT. Scale bar: 20 μm. D, E, Western blot analysis of GFP and Syb2 protein expression in untransfected cells and cells transfected with Syb2-pHluorin as indicated. Representative blots are shown (D), and the intensity of bands is quantitated by densitometry (E), n = 4 individual cultures per genotype, 4 mice per genotype. β-Actin represents a loading control. Data information: data (B) are presented as mean ± SEM; ##p < 0.01 and ****p < 0.0001 by Student’s t test; ***p < 0.001 by Tukey’s HSD test after one-way ANOVA method for multiple comparisons. Data (E) are presented as mean ± SEM, not significant by Student’s t test, r.u., relative unit.
- Figure 6.
P4H-TM KO affects intracellular ATP content, cellular ATPase activity and mitochondrial membrane potential, without an influence on the amount of mitochondrial respiratory complexes and O2 consumption. A–F, Experiments were carried on P4H-TM KO and WT primary cortical astrocytes. A, ATP content in whole-cell lysate, n = 5 freshly prepared individual protein lysates per genotype, 5 mice per genotype. B, Comparison of ATPase activity in whole-cell lysate, n = 9–10 freshly prepared individual protein lysates, 4–5 mice per genotype. C, D, Astrocytes were incubated in growth medium containing 1 g/l glucose under normoxic conditions (N) or in a medium containing no glucose under hypoxic (1% O2) conditions (OGD) for 20 h. C, Intracellular oxygen content within the astrocyte monolayer. Normoxic or hypoxic culture was conducted in the presence of the oxygen-sensitive probe MitoXpress-Intra (10 μg/ml). After 20 h, time resolved fluorescence was measured on FLUOstar Omega microplate reader. Phosphorescent intensity of the probe was converted to O2 content using the plate reader software Mars; n = 4 individual cultures per genotype, 4 mice per genotype per condition. D, Analysis of mitochondrial membrane potential in living astrocytes. After 20 h of normoxia or OGD astrocytes were loaded with TMRM fluorescent dye (150 nm) for 5 min. Fluorescence was measured on FLUOstar Omega microplate reader. The signal reflects accumulation of TMRM in the mitochondrial membrane and is proportional to membrane potential; n = 4 individual cultures per genotype, 4 mice per genotype per condition. E, BN-PAGE analysis of mitochondrial RC complexes in astrocytes. Mitochondrial protein complexes were separated on a 5% – 15% BN-PAGE. Fully assembled Complexes I–V (CI–CV) were assessed using antibodies against the Complex I 39-kDa subunit (NDUFS3), Complex II succinate dehydrogenase complex flavoprotein subunit A (SDHA), Complex III core protein 2 (UQCRC2), Complex IV cytochrome c oxidase subunit I (COX I), and Complex V ATP synthase subunit α (ATP5A). The fully assembled Complex IV was under the detection limit. Representative blots of three individual cultures per genotype are shown. F, SDS-PAGE and Western blot analysis of individual RC subunits in whole-cell protein lysates using the antibodies indicated in E. β-Actin represents a loading control. Representative blots of three individual cultures per genotype are shown. Data information: data are presented as mean ± SEM in A–D, *p < 0.05, **p < 0.01 by Student’s t test in A, B and by Tukey’s HSD test after one-way ANOVA method for multiple comparisons in C, D. r.u., relative unit.
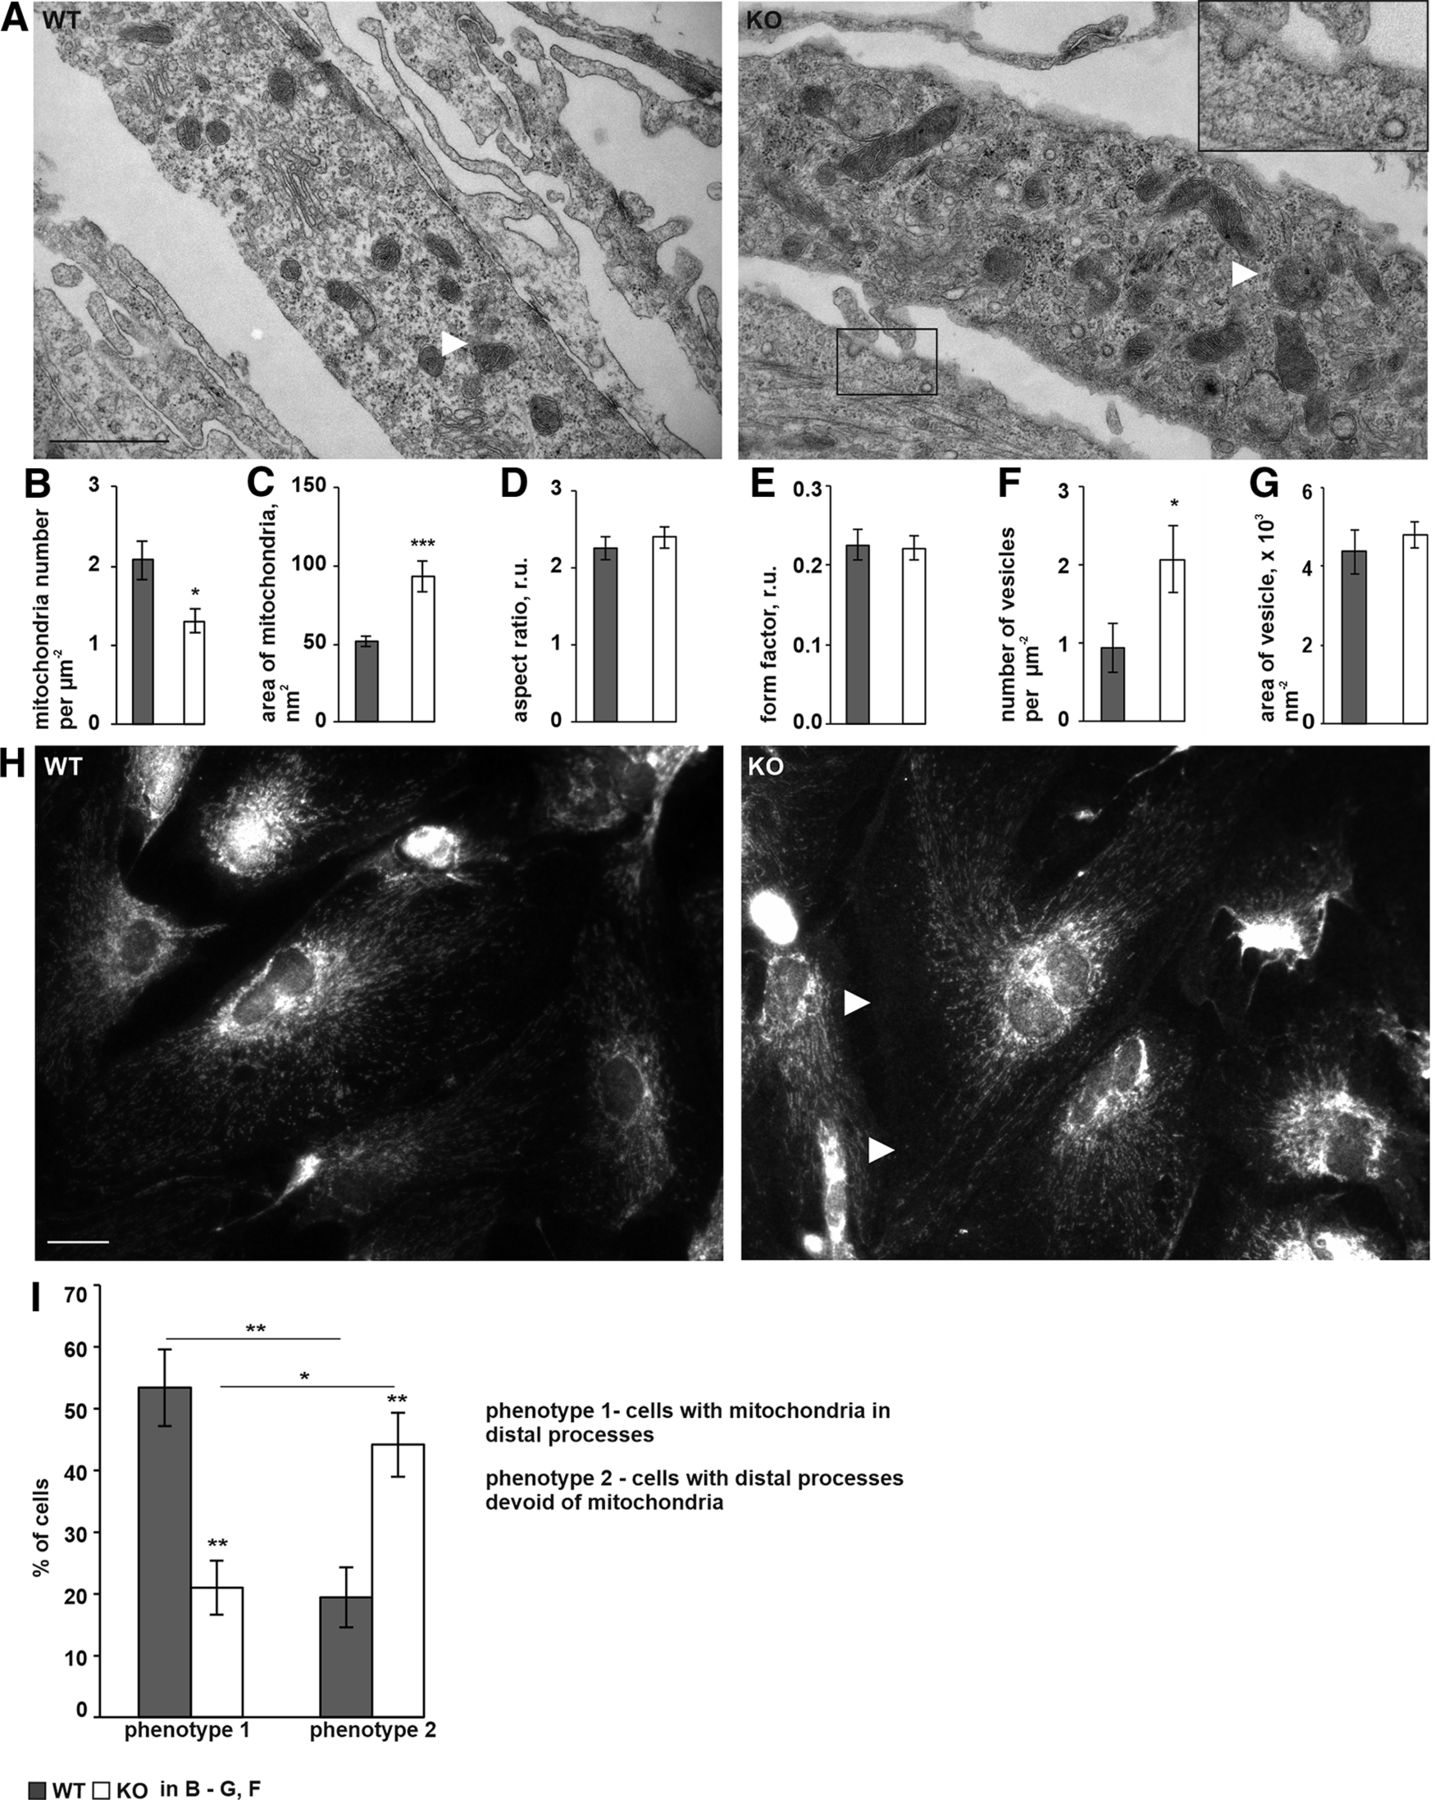
- Figure 7.
P4H-TM KO affects mitochondrial morphology and leads to accumulation of electron-lucent small vesicles (SLMVs) in the cytosol. A–G, P4H-TM KO and WT astrocytes were analyzed by TEM. Morphometric analysis was performed on randomly selected fields. A, Representative electron micrographs. Multiple mitochondria are visible (white arrows). The boxed area represents a 2.3× magnification: two SLMVs are apparent in the field of view, one of which is releasing its content to the extracellular space. Scale bar: 1 μm. B–E, Morphometric analysis of mitochondrial number per cell area (B) and shape (C–E), n = 7 astrocytes per genotype in B, n = 84–103 mitochondria per genotype in C–E, 3 mice per genotype. F, G, Analysis of the number (F) and size (G) of SLMVs; n = 7 astrocytes per genotype in F, n = 46 and n = 160 SLMVs in WT and KO cells, respectively, in G, 3 mice per genotype. H, I, Primary cortical astrocytes were immunostained with anti-Tom20 antibody for analysis of mitochondrial morphology. Representative images (H) demonstrate the observed reduced mitochondrial density within the distal part of the cell processes (white arrows) in the P4H-TM KO astrocytes when compared with WT. Scale bar: 20 μm. The number of cells (I) with clear punctate mitochondrial staining in distal processes (phenotype 1) and number of cells with distal processes virtually devoid of any staining (phenotype 2) was quantified as percent to total number of cells, n = 6–7 cultures per genotype (corresponds to ∼150 cells analyzed per genotype). Data information: data are presented as mean ± SEM in B–G, I, *p < 0.05, ***p < 0.001 by Student’s t test in B–G; *p < 0.05, **p < 0.01 by Tukey’s HSD test after one-way ANOVA method for multiple comparisons in I. r.u., relative unit.
- Figure 8.
HIF1 mediates the P4H-TM effects on calcium signaling in primary cortical astrocytes. A, B, Western blot analysis of HIF1α stabilization (A, upper panel; B, left panel) and SERCA2 protein expression (A, lower panel; B, right panel) in primary cortical astrocytes incubated in normoxic (N) or oxygen (1% O2)-glucose deprived (OGD) conditions for 6 and 24 h, respectively. Representative blots are shown in A, and the intensity of bands was quantitated by densitometry (B), n = 3 individual cultures per genotype per condition, 6 mice per genotype. β-Actin represents a loading control in (A). C, qRT-PCR analysis of HIF1α mRNA level in normoxic astrocytes. D–G, WT and P4H-TM KO astrocytes were transfected with either negative control siRNA (siNC), HIF1α siRNA (siHIF1α #1–2) or HIF2α siRNA (siHIF2α #1–2) and cultured for a further 24 h. D, qRT-PCR analysis of HIF1α (left panel) and HIF2α (right panel) mRNA levels in WT astrocytes after transfection with indicated siRNAs, n = 2 independent cultures per siRNA. E, HIF1α siRNA and HIF2α siRNA transfected WT astrocytes were exposed to OGD for 3 h and HIF1α and HIF2α stabilization was analyzed by Western blotting. Representative Western blots are shown. β-Actin represents a loading control. F, Representative Western blots of SERCA2 expression in siRNA-transfected cells. β-Actin represents a loading control. G, siRNA transfected astrocytes were loaded with Fluo-4 and stimulated with 100 μm ATP in a calcium-containing buffer. Representative traces of P4H-TM KO and WT astrocytes are shown on the graphs. Changes in cytosolic calcium [Ca2+]i peak amplitudes are shown in the diagrams. The attenuated ATP-evoked increase in [Ca2+]i observed in P4H-TM KO cells relative to WT is eliminated by siHIF1α treatment, but not by siHIF2α, n = 22–33 cells per condition. Data information: data are presented as mean ± SEM in B–E, G; #p < 0.05, ##p < 0.01 by Student’s t test and *p < 0.05, **p < 0.01 by Tukey’s HSD test after one-way ANOVA method for multiple comparisons. r.u., relative unit.


Tables
Gene Forward primer Reverse primer P4H-TM AGCCAGTGCCAACCTTG AAGCCTGGGATTTCAAAAAG β-Actin CAATAGTGATGACCTGGCCGT AGAGGGAAATCGTGCGTGAC PMCA2 AGAGATAGACCACGCAGAGC CTGGGAATCTTCGATCCGGA PMCA3 GCAGGACGTGACTCTCATCA CACCAGACACATTCCCACAG PMCA4 CTTAATGGACCTGCGAAAGC ATCTGCAGGGTTCCCAGATA Orai1 TTACTCCGAGGTGATGAGCC TGGTGGGTAGTCATGGTCTG Orai2 AGCTACCTGGAACTCGTCAC CAAACAGATGCACGGCTACC Orai3 CCAACGACTGCACAGATACG GCTTTGGAAGGCTGTTGTGA STIM1 ACGATGCCAATGGTGATGTG CACCTCATCCACAGTCCAGT STIM2 CAATCGTGCCACAGTTTCCA GGCAACTTGACACAGACAGG SEC61A GCTCCTGTGCATTCTTCTCC GGAAGTCAGCCAGGACAGAG SEC61B CCGTTCTTAGGCATCAGCAT TTCTCTGCCGAACAGTGGAT SEC61G CGGTTCTCTCCTGAGCTACG TAACCAGCCGAATTGAGTCC SERCA2A GCTCCATCTGCTTGTCCATG TTTCGGGCCACAAACTTGAG SERCA2B CTGTGGAGACCCTTGGTTGT CAGAGCACAGATGGTGGCTA SERCA3 CCACTCTCCTGCATCTCCTC TCCAATCCCTCAGACACACA SPCA1 Quantitect primer assays (QIAGEN: QT00166278, QT01542072, QT01542079) MCU CGCCAGGAATATGTTTATCCA CTTGTAATGGGTCTCTCAGTCTCTT MICU1 GAACTAGCTGTGGGCTCTCG GGTGGCAAAATATCGGAAAA MCUR1
HIF1αAGCCCTCAGAGCAGAAAATG
GGCGAGAACGAGAAGAAAAACCAGCATCTTCTTCTCGTTCA
AAGTGGCAACTGATGAGCAA
In this issue


