
Main menu

  • HOME
  • CONTENT
    • Early Release
    • Featured
    • Current Issue
    • Issue Archive
    • Blog
    • Collections
    • Podcast
  • TOPICS
    • Cognition and Behavior
    • Development
    • Disorders of the Nervous System
    • History, Teaching and Public Awareness
    • Integrative Systems
    • Neuronal Excitability
    • Novel Tools and Methods
    • Sensory and Motor Systems
  • ALERTS
  • FOR AUTHORS
  • ABOUT
    • Overview
    • Editorial Board
    • For the Media
    • Privacy Policy
    • Contact Us
    • Feedback
  • SUBMIT

User menu

Search

  • Advanced search
eNeuro

eNeuro

Advanced Search


  • HOME
  • CONTENT
    • Early Release
    • Featured
    • Current Issue
    • Issue Archive
    • Blog
    • Collections
    • Podcast
  • TOPICS
    • Cognition and Behavior
    • Development
    • Disorders of the Nervous System
    • History, Teaching and Public Awareness
    • Integrative Systems
    • Neuronal Excitability
    • Novel Tools and Methods
    • Sensory and Motor Systems
  • ALERTS
  • FOR AUTHORS
  • ABOUT
    • Overview
    • Editorial Board
    • For the Media
    • Privacy Policy
    • Contact Us
    • Feedback
  • SUBMIT
PreviousNext
Research ArticleResearch Article: New Research, Disorders of the Nervous System

Effects of L-DOPA on Gene Expression in the Frontal Cortex of Rats with Unilateral Lesions of Midbrain Dopaminergic Neurons

Anna Radlicka, Kinga Kamińska, Malgorzata Borczyk, Marcin Piechota, Michał Korostyński, Joanna Pera, Elżbieta Lorenc-Koci and Jan Rodriguez Parkitna
eNeuro 30 November 2020, 8 (1) ENEURO.0234-20.2020; DOI: https://doi.org/10.1523/ENEURO.0234-20.2020
Anna Radlicka
1Department of Molecular Neuropharmacology, Maj Institute of Pharmacology, Polish Academy of Sciences, Kraków 31-343, Poland
  • Find this author on Google Scholar
  • Find this author on PubMed
  • Search for this author on this site
Kinga Kamińska
2Department of Neuro-Psychopharmacology, Maj Institute of Pharmacology, Polish Academy of Sciences, Kraków 31-343, Poland
  • Find this author on Google Scholar
  • Find this author on PubMed
  • Search for this author on this site
Malgorzata Borczyk
1Department of Molecular Neuropharmacology, Maj Institute of Pharmacology, Polish Academy of Sciences, Kraków 31-343, Poland
  • Find this author on Google Scholar
  • Find this author on PubMed
  • Search for this author on this site
Marcin Piechota
1Department of Molecular Neuropharmacology, Maj Institute of Pharmacology, Polish Academy of Sciences, Kraków 31-343, Poland
  • Find this author on Google Scholar
  • Find this author on PubMed
  • Search for this author on this site
Michał Korostyński
1Department of Molecular Neuropharmacology, Maj Institute of Pharmacology, Polish Academy of Sciences, Kraków 31-343, Poland
  • Find this author on Google Scholar
  • Find this author on PubMed
  • Search for this author on this site
Joanna Pera
3Department of Neurology, Faculty of Medicine, Jagiellonian University Medical College, Kraków 31-503, Poland
  • Find this author on Google Scholar
  • Find this author on PubMed
  • Search for this author on this site
Elżbieta Lorenc-Koci
2Department of Neuro-Psychopharmacology, Maj Institute of Pharmacology, Polish Academy of Sciences, Kraków 31-343, Poland
  • Find this author on Google Scholar
  • Find this author on PubMed
  • Search for this author on this site
Jan Rodriguez Parkitna
1Department of Molecular Neuropharmacology, Maj Institute of Pharmacology, Polish Academy of Sciences, Kraków 31-343, Poland
  • Find this author on Google Scholar
  • Find this author on PubMed
  • Search for this author on this site
  • ORCID record for Jan Rodriguez Parkitna
  • Article
  • Figures & Data
  • Info & Metrics
  • eLetters
  • PDF
Loading

Article Figures & Data

Figures

  • Extended Data
  • Figure 1.
    • Download figure
    • Open in new tab
    • Download powerpoint
    Figure 1.

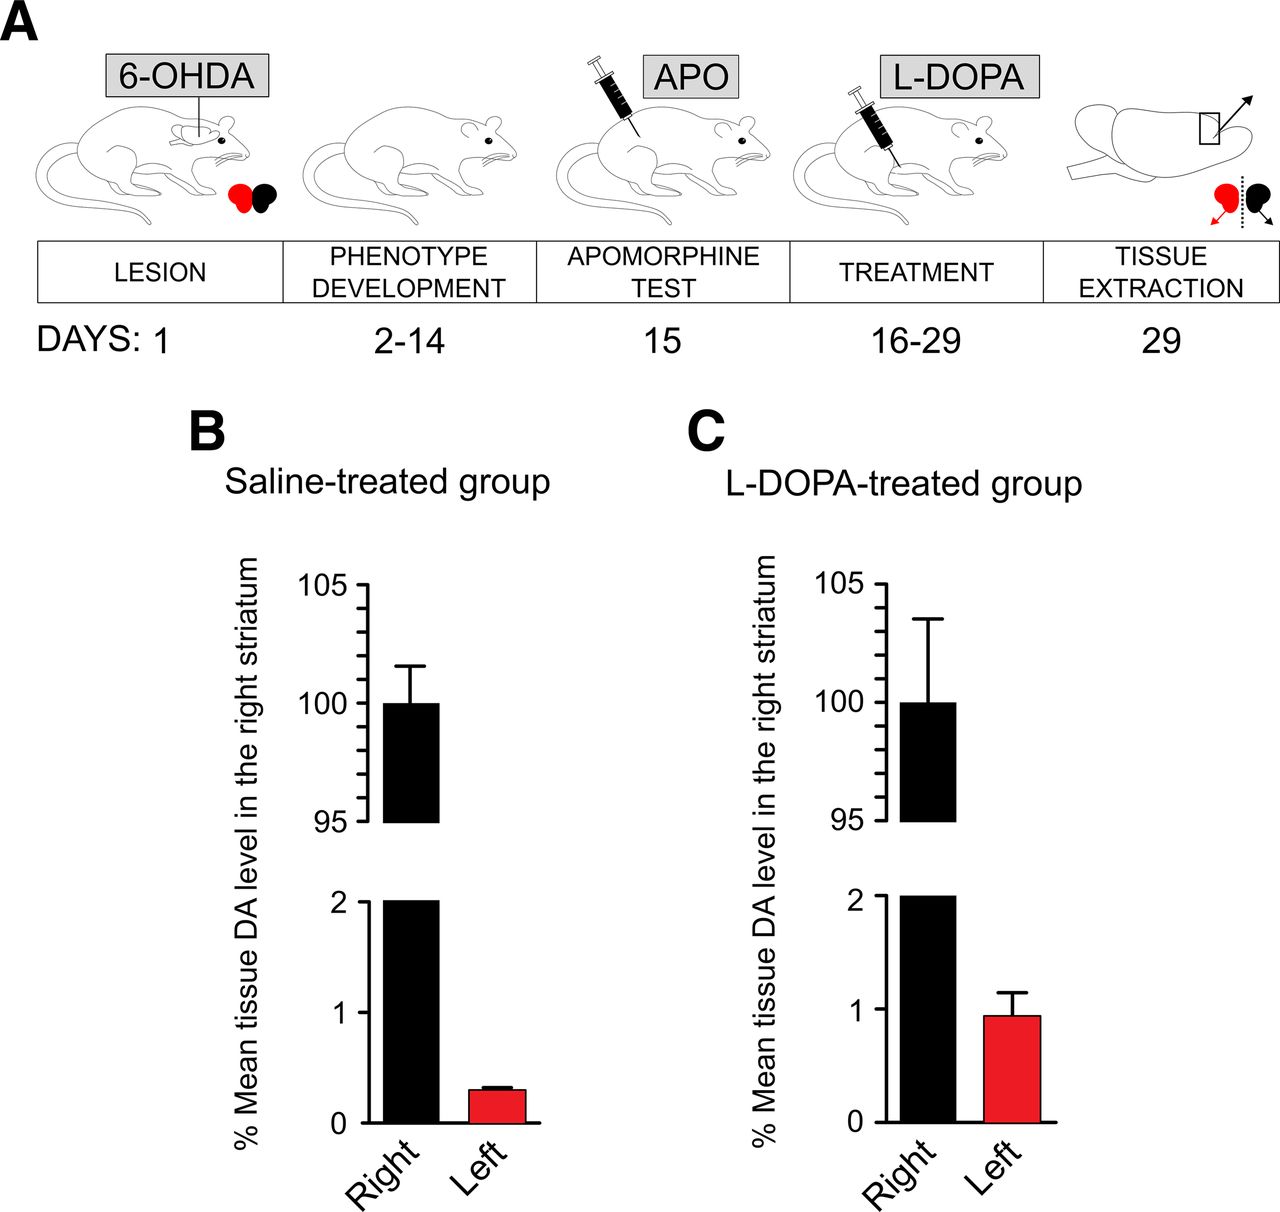
    A, Treatment scheme of rats with unilateral lesions of dopaminergic neurons as a model of PD. Male adult rats were infused with 8 μg/4 μl 6-OHDA into their left MFB. The toxin was used to kill dopaminergic neurons to produce an animal model of PD. Two weeks later, the animals were injected subcutaneously with 0.25 mg/kg apomorphine (APO) to induce rotational behavior. The number of rotations in 1 h was scored, and only the animals that exhibited at least 98 contraversive rotations (as an indication of sufficient nigral degeneration; for detailed information on number of rotations, see Extended Data Figure 1-1) were used in the following procedures. One day after the APO test, the treatment regime started. Control rats received intraperitoneal saline, whereas the experimental group received intraperitoneal benserazide (6.25 mg/kg) once daily for 14 d followed by L-DOPA (12.5 mg/kg). The animals were decapitated 1 h after the last dose of saline or L-DOPA, and their frontal cortex and striatum tissue was individually dissected from each hemisphere. B, Dopamine (DA) content in the striatum of saline-treated (C) and L-DOPA-treated animals is presented as % of the mean of the samples from the right hemisphere.

  • Figure 2.
    • Download figure
    • Open in new tab
    • Download powerpoint
    Figure 2.

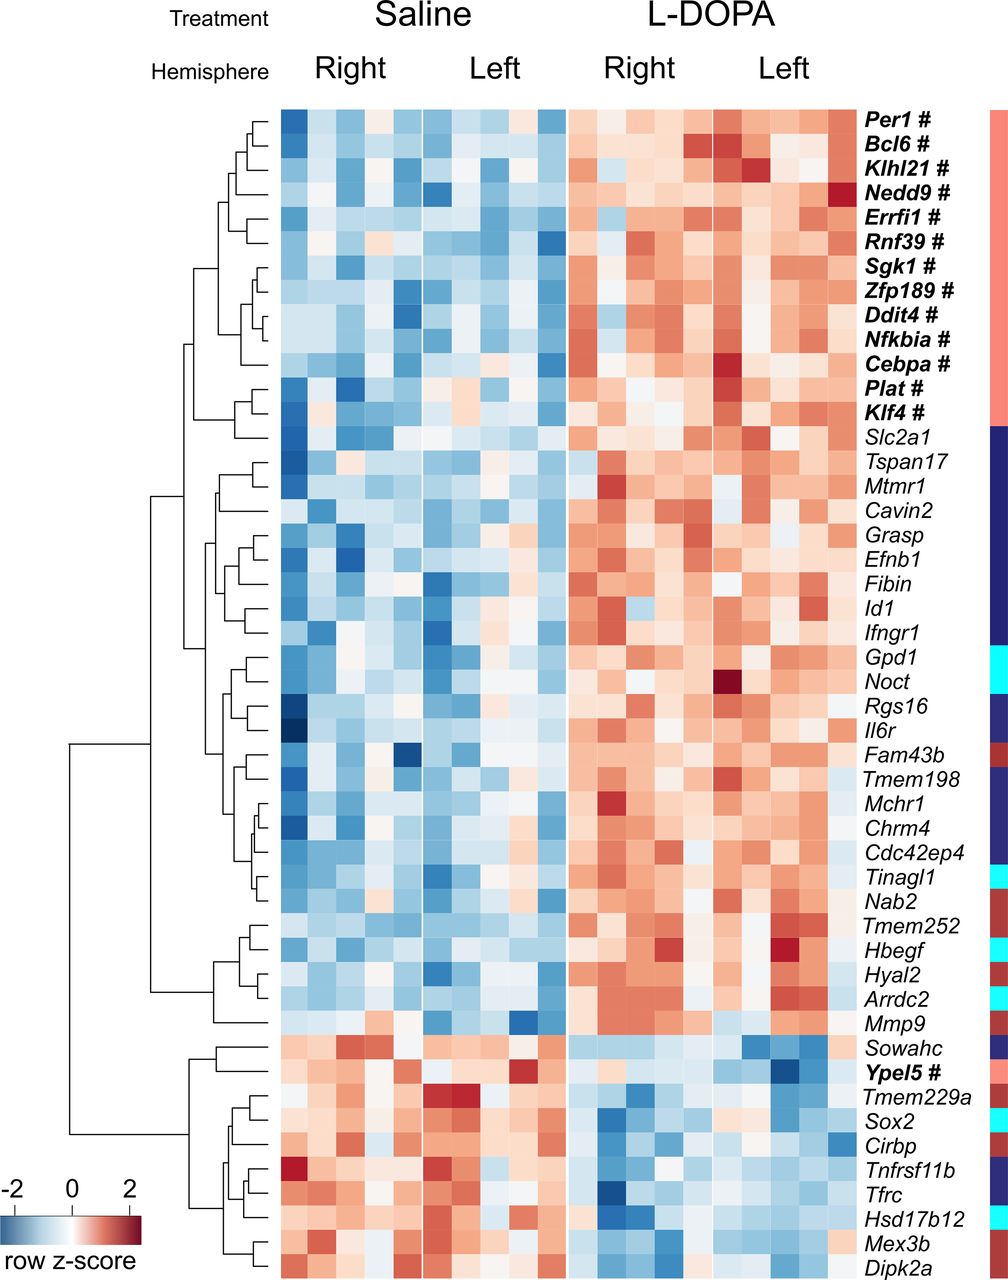
    Gene expression changes evoked by L-DOPA in the frontal cortex of rats with unilateral lesions of the dopaminergic system. A total of 48 genes exhibit altered transcript abundance after L-DOPA treatment in the frontal cortex of rats with unilateral 6-OHDA lesions (two-way ANOVA, FDR < 0.05). Each column represents one sample (left or right frontal cortex), and rows correspond to genes as indicated on the right. Colors represent normalized expression levels. Genes are ordered based on hierarchical clustering, and the dendrogram is presented on the left. Additionally, the colored stripe on the right shows the assignment of genes to modules from the WGCNA. Genes belonging to the salmon module are highlighted in bold and marked with a #. For detailed data on the differentially expressed genes, see Extended Data Figure 2-1. For detailed data on alternative transcript isoforms of the differentially expressed genes, see Extended Data Figures 2-2, 2-3. Additionally, the results of overrepresentation analyses are presented in Extended Data Figures 2-4 (transcription factor-binding sites) and 2-5 (drug-induced expression signatures).

  • Figure 3.
    • Download figure
    • Open in new tab
    • Download powerpoint
    Figure 3.

    L-DOPA-regulated gene coexpression networks in the rat frontal cortex. A, Graphic representation of gene assignment of the 12,455 genes [with log2(FPKM + 1) values >1] to WGCNA modules. Each branch of the dendrogram and colored stripe represent one gene, and the colors indicate assignment to a particular module named by color. The dynamic tree cut method detected 17 modules (the upper block of colored stripes), which were further joined with the “merge dynamic” method at a threshold of 0.5 into five resulting modules (the lower block). The numbers below the blocks indicate the total number of genes in a module, and those in brackets represent the number of genes in the module that overlap with the differentially expressed genes. The module eigengenes for each sample are shown in Extended Data Figure 3-1. B, The salmon module included many immediate early genes and was enriched in GO terms related to the process of transcription. Biological process GO terms are on the left, and molecular function terms are on the right. Gray lines connect the terms with the corresponding genes. For full results of overrepresentation analyses of the salmon module, please refer to Extended Data Figures 3-2 (transcription factor-binding sites), 3-3 (GO), and 3-4 (drug-induced expression signatures).

  • Figure 4.
    • Download figure
    • Open in new tab
    • Download powerpoint
    Figure 4.

    Analysis of cell-type specificity of the expression of genes differentially expressed in the rat frontal cortex after L-DOPA treatment. The heatmap includes genes that passed the differential expression criterion and had mouse homologs. Each column reflects a cell subtype, based on the Allen Atlas classification, and rows correspond to genes. The color of the squares in the heatmap indicates the fraction of the cells belonging to the subtype that was found to express a particular gene (legend shown in the bottom left). Symbols above the heatmap mark broader cell categories: triangles, neurons; diamonds, glia; dots, cells associated with the vascular system. The colored stripe on the right indicates the assignment of genes to modules from the WGCNA. Genes belonging to the salmon module are highlighted in bold and marked with a #. Astro, astrocytes; CR, Cajal–Retzius cells; CT, corticothalamic neurons; Endo, endothelial cells; IT, intratelencephalic neurons; L, cortical layer; NP, near-projecting neurons; Oligo, oligodendrocytes; Peri, pericytes; PT, pyramidal tract neurons; SMC, smooth muscle cells; VLMC, vascular leptomeningeal cells.

Extended Data

  • Figures
  • Extended Data Figure 1-1

    Number of contraversive (rightwise) and ipsiversive (leftwise) rotations recorded for 1 h in 10-min intervals in rats from both treatment groups, RINs for frontal cortex samples and information on whether the animals were included in the RNA-Seq study. The rats were tested 14 d after administration of 6-OHDA into the left MFB after injection of apomoprhine (0.25 mg/kg/2 ml, s.c.). N/A, not measured. Download Figure 1-1, XLSX file.

  • Extended Data Figure 2-1

    List of differentially expressed genes with Ensembl IDs, gene symbols, mean log2(FPKM +1) values, FDR values for all factors, fold changes for each contrast, and the WGCNA modules to which the genes were assigned. Download Figure 2-1, XLSX file.

  • Extended Data Figure 2-2

    List of alternative transcripts of the differentially expressed genes with Ensembl transcript IDs and names, gene symbols, log2(FPKM +1) values in each sample and mean for all samples, uncorrected p and FDR values for all factors, and fold changes for each contrast. Download Figure 2-2, XLSX file.

  • Extended Data Figure 2-3

    Sashimi plots of two of the differentially expressed genes with alternative transcript isoforms: (A) Mmp9 and (B) Sgk1. The upper parts represent splice junctions and mean coverage for each sample group in accordance with genome coordinates of the aligned isoforms. The coverage is presented only for sites with more than two reads. Asterisk (*) marks transcript isoforms whose abundances were significantly altered by L-DOPA (FDR for treatment < 0.05), whereas the $ indicates the Mmp9 isoform with significant abundance differences between hemispheres. Download Figure 2-3, TIF file.

  • Extended Data Figure 2-4

    Enrichment of transcription factor-binding sites in the loci of the differentially expressed genes. Download Figure 2-4, XLSX file.

  • Extended Data Figure 2-5

    Significant overlaps between differentially regulated genes and transcriptomic signatures from GEO upregulated and downregulated genes (GEOPertUp, GEOPertDown) and the Drug Signature Database (DSigDB). Download Figure 2-5, XLSX file.

  • Extended Data Figure 3-1

    Module eigengenes (MEs) of the five WGCNA modules after merging the modules identified by the dynamic tree cut method. The columns indicate modules, and the rows represent samples. Download Figure 3-1, XLSX file.

  • Extended Data Figure 3-2

    Enrichment of transcription factor-binding sites in the loci of genes assigned to the salmon WGCNA module. Download Figure 3-2, XLSX file.

  • Extended Data Figure 3-3

    Significantly enriched GO terms from the biological process and molecular function branches in the list of genes assigned to the salmon WGCNA module. Download Figure 3-3, XLSX file.

  • Extended Data Figure 3-4

    Significant overlaps between genes in the salmon WGCNA module and transcriptomic signatures from upregulated and downregulated genes in the GEO (GEOPertUp and GEOPertDown, respectively), the Drug Signature Database (DSigDB) and the DrugMatrix Database. Download Figure 3-4, XLSX file.

Back to top

In this issue

eneuro: 8 (1)
eNeuro
Vol. 8, Issue 1
January/February 2021
  • Table of Contents
  • Index by author
  • Ed Board (PDF)
Email

Thank you for sharing this eNeuro article.

NOTE: We request your email address only to inform the recipient that it was you who recommended this article, and that it is not junk mail. We do not retain these email addresses.

Enter multiple addresses on separate lines or separate them with commas.
Effects of L-DOPA on Gene Expression in the Frontal Cortex of Rats with Unilateral Lesions of Midbrain Dopaminergic Neurons
(Your Name) has forwarded a page to you from eNeuro
(Your Name) thought you would be interested in this article in eNeuro.
CAPTCHA
This question is for testing whether or not you are a human visitor and to prevent automated spam submissions.
Print
View Full Page PDF
Citation Tools
Effects of L-DOPA on Gene Expression in the Frontal Cortex of Rats with Unilateral Lesions of Midbrain Dopaminergic Neurons
Anna Radlicka, Kinga Kamińska, Malgorzata Borczyk, Marcin Piechota, Michał Korostyński, Joanna Pera, Elżbieta Lorenc-Koci, Jan Rodriguez Parkitna
eNeuro 30 November 2020, 8 (1) ENEURO.0234-20.2020; DOI: 10.1523/ENEURO.0234-20.2020

Citation Manager Formats

  • BibTeX
  • Bookends
  • EasyBib
  • EndNote (tagged)
  • EndNote 8 (xml)
  • Medlars
  • Mendeley
  • Papers
  • RefWorks Tagged
  • Ref Manager
  • RIS
  • Zotero
Respond to this article
Share
Effects of L-DOPA on Gene Expression in the Frontal Cortex of Rats with Unilateral Lesions of Midbrain Dopaminergic Neurons
Anna Radlicka, Kinga Kamińska, Malgorzata Borczyk, Marcin Piechota, Michał Korostyński, Joanna Pera, Elżbieta Lorenc-Koci, Jan Rodriguez Parkitna
eNeuro 30 November 2020, 8 (1) ENEURO.0234-20.2020; DOI: 10.1523/ENEURO.0234-20.2020
del.icio.us logo Digg logo Reddit logo Twitter logo Facebook logo Google logo Mendeley logo
  • Tweet Widget
  • Facebook Like
  • Google Plus One

Jump to section

  • Article
    • Abstract
    • Significance Statement
    • Introduction
    • Materials and Methods
    • Results
    • Discussion
    • Acknowledgments
    • Footnotes
    • References
    • Synthesis
    • Author Response
  • Figures & Data
  • Info & Metrics
  • eLetters
  • PDF

Keywords

  • frontal cortex
  • gene expression
  • L-DOPA
  • Parkinson’s disease

Responses to this article

Respond to this article

Jump to comment:

No eLetters have been published for this article.

Related Articles

Cited By...

More in this TOC Section

Research Article: New Research

  • The Impact of Chemical Fixation on the Microanatomy of Mouse Organotypic Hippocampal Slices
  • Dopamine Receptor Type 2-Expressing Medium Spiny Neurons in the Ventral Lateral Striatum Have a Non-REM Sleep-Induce Function
  • How Sucrose Preference Is Gained and Lost: An In-Depth Analysis of Drinking Behavior during the Sucrose Preference Test in Mice
Show more Research Article: New Research

Disorders of the Nervous System

  • Chemogenetic Perturbation of the Posterior But Not Anterior Cerebellum Reduces Voluntary Ethanol Consumption
  • Energy Expenditure Homeostasis Requires ErbB4, an Obesity Risk Gene, in the Paraventricular Nucleus
  • In Utero Electroporated Neurons for Medium-Throughput Screening of Compounds Regulating Neuron Morphology
Show more Disorders of the Nervous System

Subjects

  • Disorders of the Nervous System

  • Home
  • Alerts
  • Visit Society for Neuroscience on Facebook
  • Follow Society for Neuroscience on Twitter
  • Follow Society for Neuroscience on LinkedIn
  • Visit Society for Neuroscience on Youtube
  • Follow our RSS feeds

Content

  • Early Release
  • Current Issue
  • Latest Articles
  • Issue Archive
  • Blog
  • Browse by Topic

Information

  • For Authors
  • For the Media

About

  • About the Journal
  • Editorial Board
  • Privacy Policy
  • Contact
  • Feedback
(eNeuro logo)
(SfN logo)

Copyright © 2023 by the Society for Neuroscience.
eNeuro eISSN: 2373-2822

The ideas and opinions expressed in eNeuro do not necessarily reflect those of SfN or the eNeuro Editorial Board. Publication of an advertisement or other product mention in eNeuro should not be construed as an endorsement of the manufacturer’s claims. SfN does not assume any responsibility for any injury and/or damage to persons or property arising from or related to any use of any material contained in eNeuro.