

Article Figures & Data
Figures
- Figure 1.
A, Multiple (>200) trials of the PN task were performed. For each trial, an image from the Boston naming test (Kaplan et al., 1983) was shown; patient articulated when the image was identified. B, The z scores of mean hγ power responses across trials are shown for a patient in three time windows. B1, In the window 200–456 ms relative to stimulus onset, increased power in visual cortex and decreased power in frontal regions compared with the baseline are observed. B2, The prearticulation window has multiple electrodes with an increase in hγ power in frontal, motor, and temporal regions. B3, The postarticulation window has increase in power in the auditory cortex, aligning with the task wherein the patient hears themselves speak.
- Figure 2.
SA windows are aligned to stimulus onset, AA to onset of articulation. The last SA window did not overlap with the first AA window, to ensure temporal continuity. 11 SA (start times 0–320 ms, sliding by 32 ms) and 41 AA (start times −480–768 ms, sliding by 32 ms) windows were used in analysis.
- Figure 3.
A, Coreness of a node is a measure of the node’s centrality in the network. While typically, a higher coreness value corresponds to a higher node degree, it is not always the case. For example, both nodes P and Q have a degree of 6, yet node P has a coreness value of 1, while node Q has a coreness value of 3. B, Louvain communities. C, Fine scale network measures given by in-degrees and out-degrees.
- Figure 4.
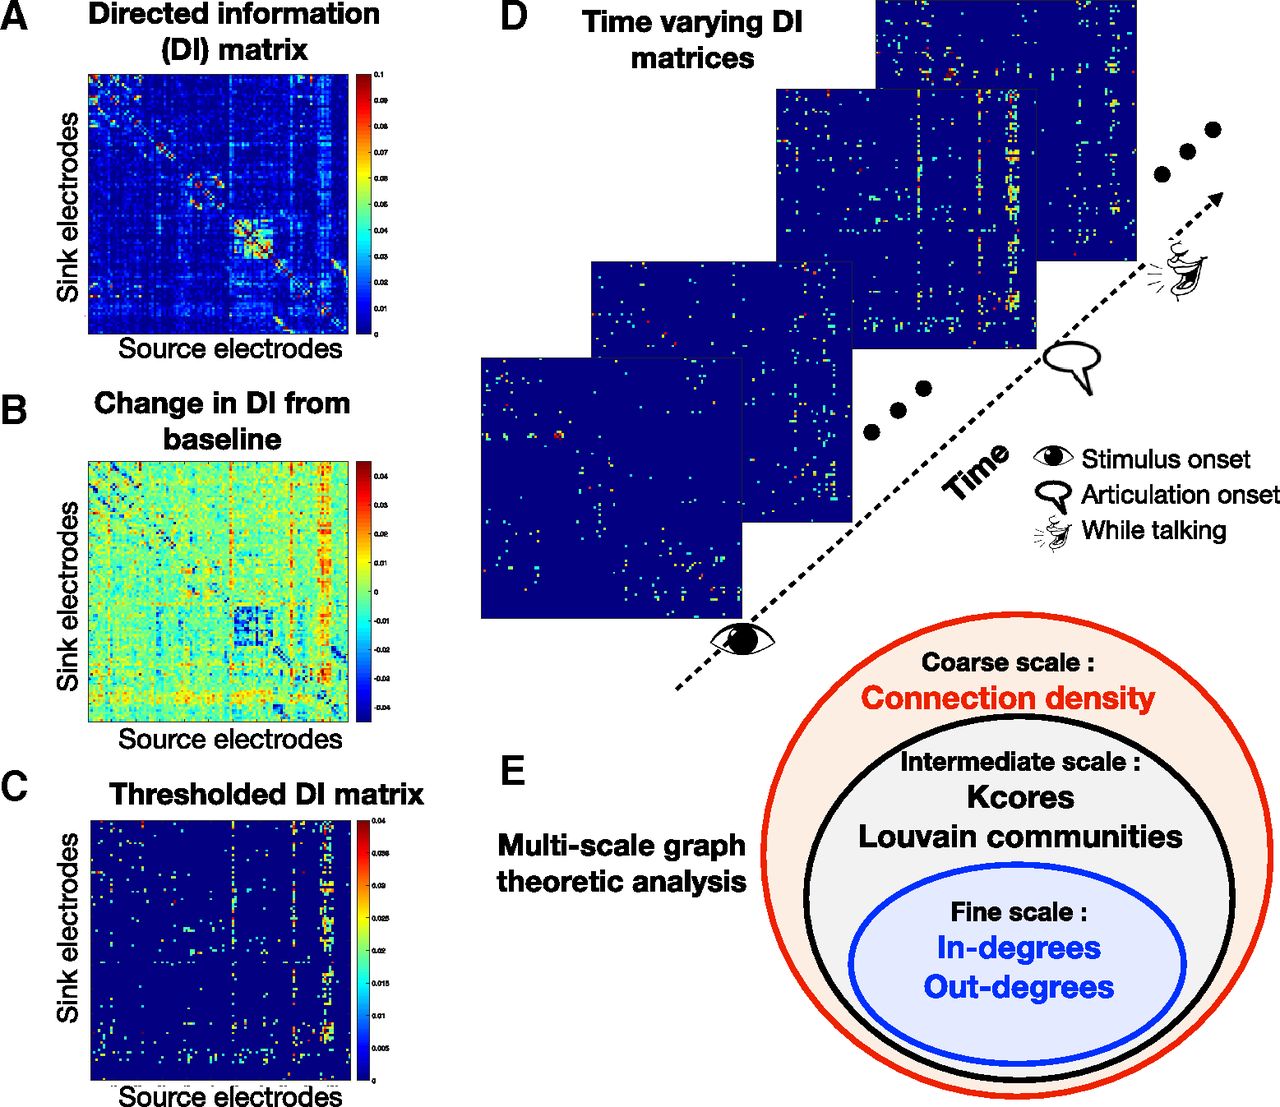
A, DI matrix in a window; x- and y-axes are the electrodes and the
 element represents DI from the
to the
electrode. B, The DI matrix relative to the baseline (“change in DI” matrix) is obtained by subtracting the baseline DI matrix from the DI matrix of that window. C, The thresholded DI matrix, which only retains the top positive increases in DI, based on a threshold value T (described in Materials and Methods). D, W = 52 “increase in DI” matrices were generated per patient. E, Multiscale graph analysis.
element represents DI from the
to the
electrode. B, The DI matrix relative to the baseline (“change in DI” matrix) is obtained by subtracting the baseline DI matrix from the DI matrix of that window. C, The thresholded DI matrix, which only retains the top positive increases in DI, based on a threshold value T (described in Materials and Methods). D, W = 52 “increase in DI” matrices were generated per patient. E, Multiscale graph analysis. - Figure 5.
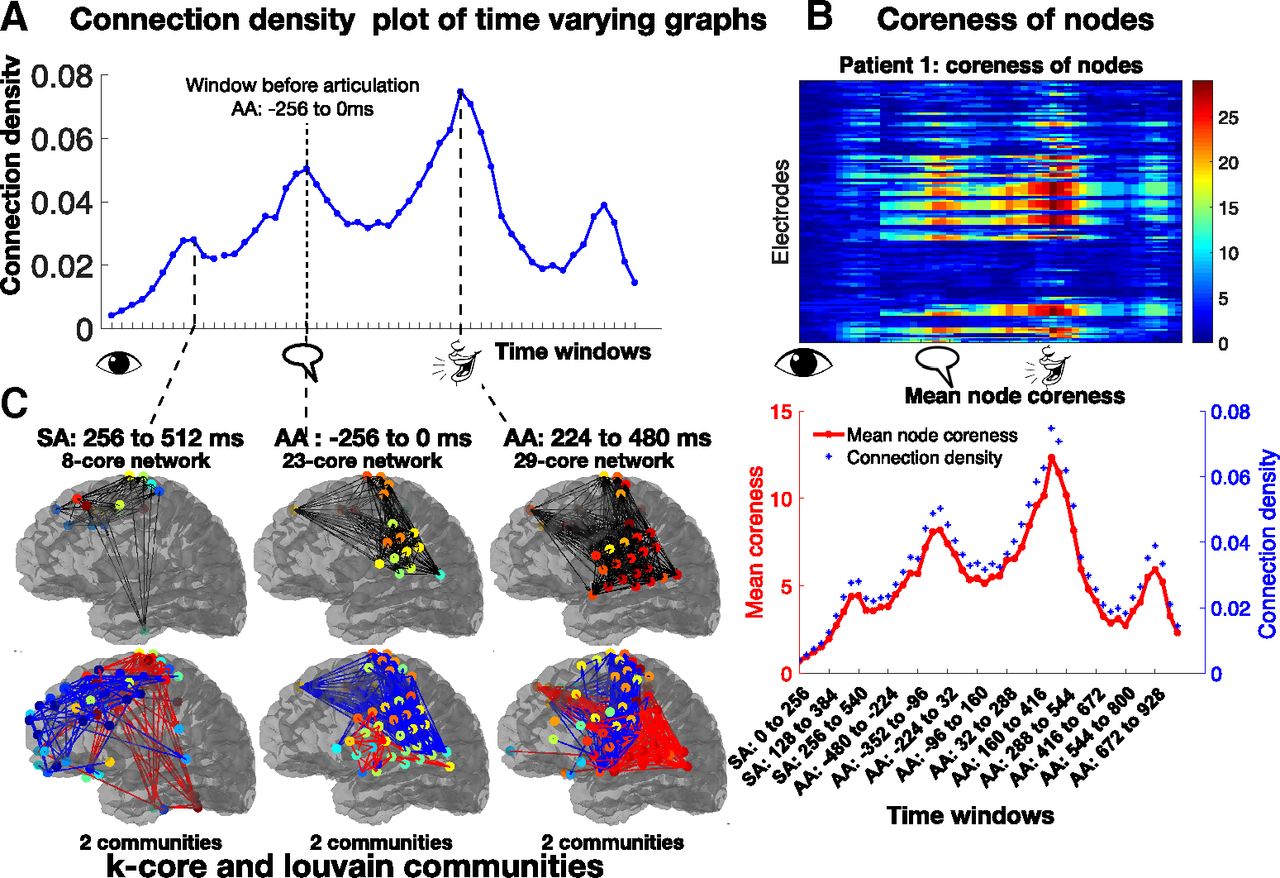
A, Connection densities vary smoothly across time windows, with a local maximum occurring before articulation. B, Coreness of nodes heatmap identifies sets of nodes in the brain related to changes in connection density. The average coreness across nodes (shown in red below the heatmap), provides the same information as the coarse scale metric (in blue). C, The first row shows the maximal k-core network in windows where peaks were found in the coarse metric. Connections are shown in black lines. The max k-core network is a very strongly interconnected core of the graph. The second row shows the results of the Louvain analysis. The colors of directed lines only indicate that the nodes belong to the same community. Significant communities, Bonferroni corrected p < 0.05 are shown.
- Figure 6.
A, An inf-frontal gyrus pars opercularis electrode from patient 1, that shows positive correlation between hγ power and the network features. B, A negatively correlated orbital frontal cortex from patient 6. The coreness of nodes can be seen as a combined effect of in and out degrees. A detailed figure that shows the correlation coefficient of in/out degrees with other frequency bands is shown in Extended Data Figures 6-1, 6-2. A pictorial understanding of how in/out degrees correlates with power is shown in Extended Data Figure 6-3. R represents the correlation coefficient.
- Figure 7.
Every three-ring electrode on the brain denotes the correlation coefficient value of three feature spaces with power. The significant correlation coefficient of in-degrees and hγ power time-series are shown in the innermost circle, the correlation coefficient of out-degrees with power is denoted by the color of the middle ring, while the outer ring for each electrode’s color denotes the correlation coefficient of coreness of nodes with power. The absence of color in the outer ring, or the absence of either the middle or inner ring, denotes the lack of significant correlation in that electrode, with that feature space. This figure denotes the correlation coefficient calculated using the entire time-series, SA and AA time windows considered separately are shown in Extended Data Figure 7-1. The bar plot to the right shows the average percentage of electrodes that showed significant correlation for each feature space, after correcting for multiple comparisons (FDR, p < 0.05 for each feature space, per patient). It can be noted that most electrodes’ feature spaces show correlation in the same direction. Across patients, more electrodes have significant correlation of coreness of nodes feature space with power, than the other two feature spaces.
- Figure 8.
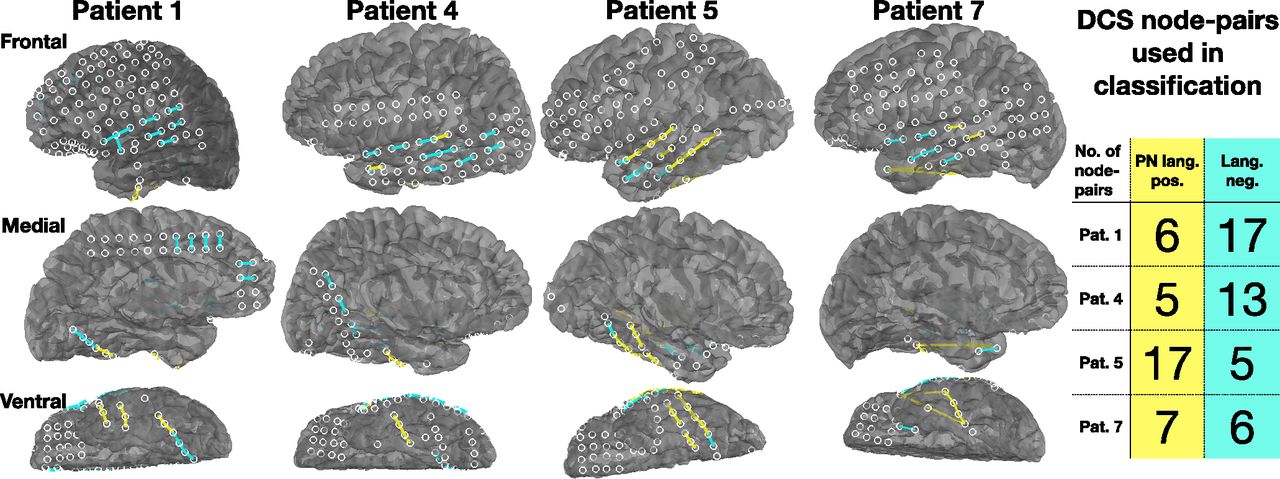
Location of PN positive and language negative node-pairs obtained after DCS. These node-pairs are used as ground truth labels for classification.
- Figure 9.
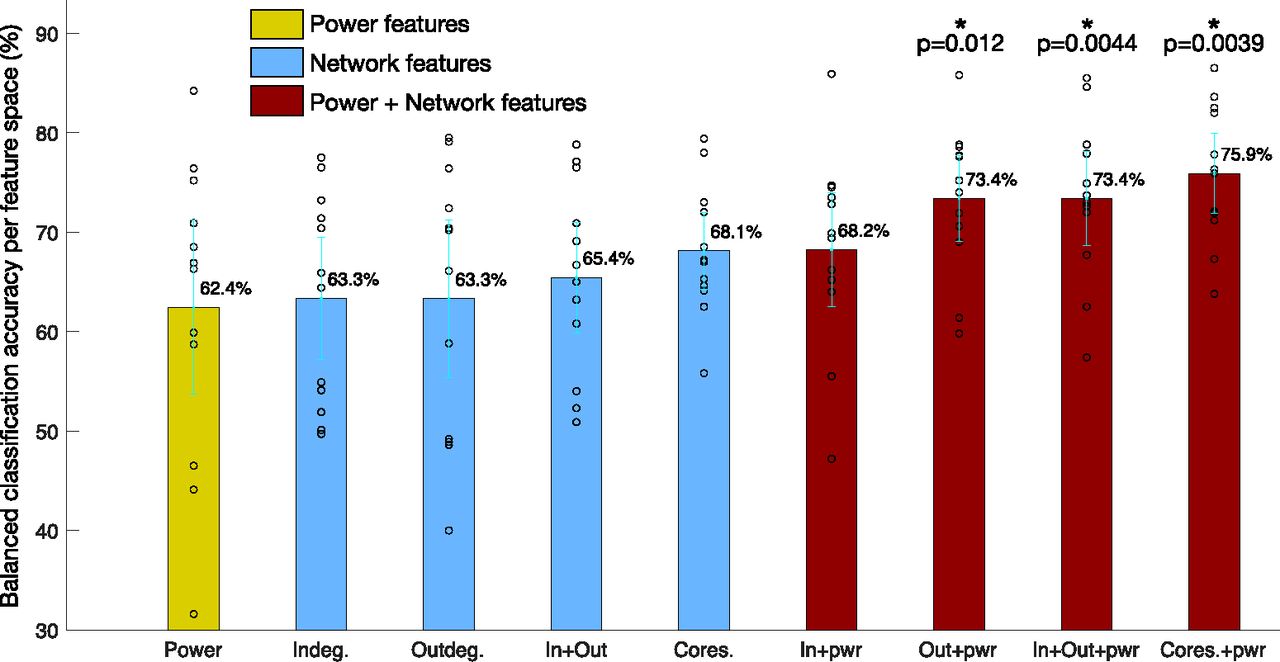
Comparison of binary classification accuracy between PN positive and language negative node-pairs using different feature spaces. The average accuracy in each feature space across all classifiers and patients are shown, with their 95% confidence intervals. While classification accuracy is greater when using network features alone than using the power, it is not significantly greater. However, combining network features and power, “out-degrees+power,” “both in-out degrees+power,” and “coreness+power” perform significantly better than power alone, with “coreness+power” being the best feature space. * indicates p < 0.05, the cyan lines indicate the 95% confidence interval, while the black dots are the original data points.
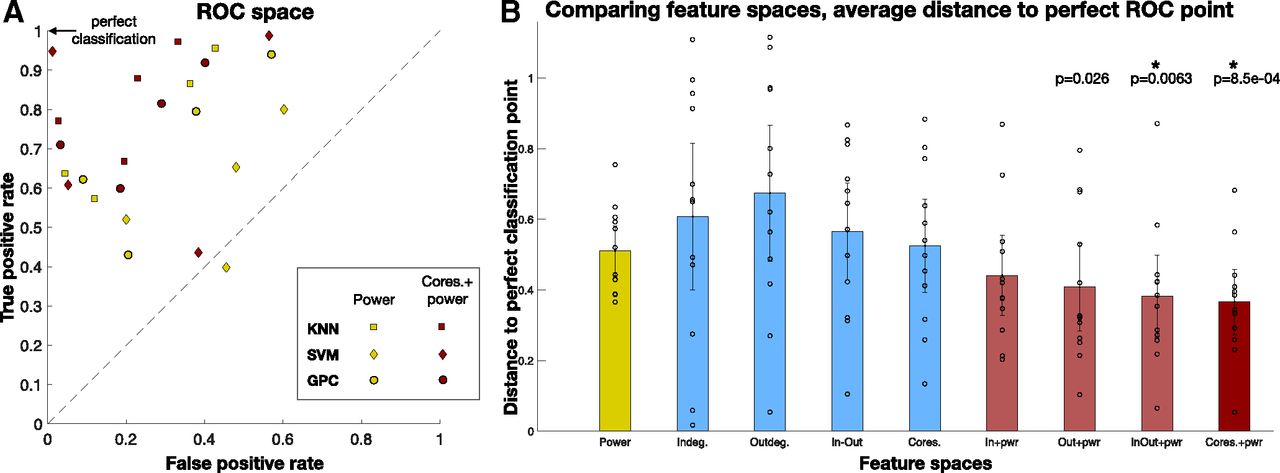
- Figure 10.
A, Each classifier was plotted in the ROC space. TPR = 1, FPR = 0 is the perfect classification point in this space. There are four points for each colored shape, for four patients. B, The average L2 distance to the perfect classification point, for each feature space is shown in the bar plot, with the 95% confidence interval. Coreness+power feature space is the closest to perfect classification, across all patients, and accounting for classifier variability. Feature spaces “in-out degrees+power” and “coreness+power” perform significantly better than power alone (
, t test, FDR corrected).


Tables
Patient # Age(gender) # Electrodes # trials Grid side 1 42(M) 136 262 Left 2 23(M) 89 264 Left 3 34(F) 91 275 Left 4 23(M) 107 206 Left 5 45(F) 112 223 Left 6 51(F) 85 203 Left 7 24(M) 91 250 Left Number of Total DCS PN positive Language negative Other Excluded node- node- node- node- language positive node- pairs pairs pairs pairs pairs pairs Patient 1 46 6 17 8 15 Patient 2 25 0 24 1 0 Patient 3 18 1 4 9 4 Patient 4 37 5 13 3 16 Patient 5 35 17 5 7 6 Patient 6 20 1 3 15 1 Patient 7 21 7 6 4 4 The bolded patients are the ones used in the subsequent DCS analysis, as they had sufficient number of node-pairs for analysis.
- Table 3
Balanced accuracy results (%) for binary classification between PN positive and language negative node-pairs
Features used for Patient 1 Patient 4 Patient 5 Patient 7 KNN, SVM, GPC n = 46 n = 36 n = 44 n = 26 classifiers (p: length of feature) KNN SVM GPC KNN SVM GPC KNN SVM GPC KNN SVM GPC Mean Power……………………….p = 104 75.2 ± 1.4 58.7 ± 1.4 68.5 ± 1.3 44.1 ± 0.6 31.6 ± 1.0 46.5 ± 0.7 76.4 ± 1.2 59.9 ± 1.3 70.9 ± 1.4 66.9 ± 1.7 66.3 ± 1.8 84.2 ± 1.4 62.4 Indeg………………………..p = 104 65.9 ± 1.3 76.5 ± 0.8 73.2 ± 1.5 50.1 ± 0.2 54.9 ± 1.4 51.9 ± 0.7 54.1 ± 1.7 64.4 ± 1.1 49.7 ± 0.2 71.4 ± 1.6 77.5 ± 1.2 70.4 ± 1.7 63.3 Outdeg……………………..p = 104 58.8 ± 1.4 79.1 ± 0.7 66.1 ± 1.7 79.5 ± 1.1 70.4 ± 0.7 49.2 ± 0.4 40.0 ± 1.0 48.6 ± 1.7 48.9 ± 0.7 72.4 ± 1.3 76.4 ± 1.3 70.2 ± 1.5 63.3 Indeg+Outdeg……………p = 208 60.8 ± 1.6 78.8 ± 0.7 63.2 ± 1.7 50.9 ± 0.8 69.1 ± 0.8 52.3 ± 0.8 54.0 ± 1.7 66.7 ± 1.5 65.0 ± 1.6 70.9 ± 1.3 77.1 ± 1.2 76.5 ± 1.6 65.4 Cores………………………..p = 104 67.2 ± 1.5 79.4 ± 0.7 55.8 ± 1.2 64.1 ± 1.5 65.3 ± 1.3 72.0 ± 1.7 62.5 ± 1.5 64.6 ± 1.4 68.5 ± 1.7 78.0 ± 1.4 67.0 ± 1.9 73.0 ± 1.7 68.1 Indeg + Power……………p = 208 85.9 ± 1.2 74.7 ± 1.3 72.8 ± 1.4 69.4 ± 1.5 47.2 ± 1.6 65.2 ± 1.6 73.5 ± 1.5 55.5 ± 1.3 64.0 ± 1.6 66.2 ± 1.4 74.5 ± 1.3 69.9 ± 1.7 68.2 Outdeg + Power…………p = 208 78.6 ± 1.2 75.2 ± 1.3 61.4 ± 1.4 74.0 ± 1.4 59.8 ± 1.4 71.9 ± 1.7 78.8 ± 1.4 70.6 ± 1.2 85.8 ± 1.0 69.0 ± 1.6 77.7 ± 1.3 77.6 ± 1.4 73.4 In+Outdeg + Power……p = 312 84.6 ± 1.2 78.8 ± 0.7 72.0 ± 1.5 62.5 ± 1.4 57.4 ± 1.4 73.7 ± 1.5 73.0 ± 1.5 67.7 ± 1.2 85.5 ± 0.9 72.6 ± 1.5 74.9 ± 1.2 77.9 ± 1.3 73.4 Cores. + Power………….p = 208 82.5 ± 1.3 77.8 ± 1.1 75.9 ± 1.3 63.8 ± 1.6 67.3 ± 1.6 86.5 ± 1.3 82.0 ± 1.0 71.2 ± 0.9 76.3 ± 1.4 71.9 ± 1.5 72.1 ± 1.5 83.6 ± 1.2 75.9 Sensitivity, specificity and precision for each classifier are in Extended Data Tables 3-1, 3-2, 3-3. The bolded entries indicate the feature space which had the highest classification accuracy, for each classifier.
Extended Data Table 3-1
Sensitivity (recall or TPR), specificity (selectivity or TNR), precision for kNN classification Download Table 3-1, DOC file.
Extended Data Table 3-2
Sensitivity (recall or TPR), specificity (selectivity or TNR), precision for SVM classification Download Table 3-2, DOC file.
Extended Data Table 3-3
Sensitivity (recall or TPR), specificity (selectivity or TNR), precision for Gaussian process classification Download Table 3-3, ZIP file.
Extended Data Figure 6-1
A matrix representation of correlation coefficients of in and out degrees with powers in five frequency bands are shown for each of the seven patients. Rows of all matrices are electrodes grouped by brain region, and there are 10 columns for each patient. First two columns are correlation coefficient of in-degrees and out-degrees with hγ power (60–200 Hz), next two columns are in/out-degrees with γ power (30–60 Hz), next two columns are correlation coefficient of in/out-degrees β power (13–30 Hz), next two columns are correlation coefficient of in/out-degrees α power (8–13 Hz), while the last two columns are with θ power (4–8 Hz). It can be observed that while the electrode coverage of all the patients is different, there exist similar trends of high positive correlation with hγ power and negative correlation with the θ power, particularly in language-related brain regions. The brain regions are labeled with numbers and are enumerated in Extended Data Figure 6-2. The exact number of electrodes that were positively and negatively correlated for in-degrees and out-degrees are also shown, and more electrodes were found to be negatively correlated with out-degrees than in-degrees, while greater number of electrodes are positively correlated with in-degrees than out-degrees. Download Figure 6-1, EPS file.
Extended Data Figure 6-2
Table depicting the brain regions and number of recording electrodes in each region for all patients. Download Figure 6-2, TEX file.
Extended Data Figure 6-3
A, A positively correlated occipital-temporal-lateral-fusiform-gyrus electrode from patient 5. B, A negatively correlated Inf-temporal electrode from patient 5. The colors of the nodes in A, B represent the power in the window, while the dark blue lines are in-degrees to the node, and the light blue lines are the out-degrees. These figures demonstrate that coreness of nodes is due to the combined effect of in and out degrees and provide a pictorial understanding of how in/out degrees correlates with power. Download Figure 6-3, EPS file.
Extended Data Figure 7-1
Every three-ring electrode on the brain denotes the correlation coefficient value of three feature spaces with power. The significant correlation coefficient of in-degrees and hγ power time-series are shown in the innermost circle, the correlation coefficient of out-degrees with power is denoted by the color of the middle ring, while the outer ring for each electrode’s color denotes the correlation coefficient of coreness of nodes with power. The absence of color in the outer ring, or the absence of either the middle or inner ring denotes the lack of significant correlation in that electrode, with that feature space. The first row denotes the correlation coefficient calculated using the entire time-series, and is the same as the main figure in the paper. The second row shows the correlation coefficient of the three feature spaces with power, when only the SA time windows are considered, while the third row shows the correlation coefficient when only the AA windows are considered. The bar plots to the right denote the average percentage of electrodes that showed significant correlation for each feature space, after correcting for multiple comparisons (FDR, p < 0.05 for each feature space, per patient). It can be noted that most electrodes’ feature spaces show correlation in the same direction. There are electrodes where the correlation in SA and AA are in the opposite directions, and are canceled out in the combined SA+AA correlation space. Overall, more electrodes have significant correlation of coreness of nodes feature space with power, than the other two feature spaces, in all three various time-window considerations. Download Figure 7-1, EPS file.
In this issue


