

Article Figures & Data
Figures
- Figure 1.
Expression of taste cell genes in taste buds in FuP. Double-fluorescence in situ hybridization was performed to study expression of genes required for sweet, umami, bitter, or salty taste perception. Numbers of cells showing signals were counted, and the ratios of cells positive and negative for one gene (A–C, middle images; D–F, Trpm5) to the total population of cells positive for the other gene (A–C, Calhm3; D–F, middle image) are shown at the right (n = 3). A–C, Trpm5 (A), Plcb2 (B), and Itpr3 (C) compared with Calhm3. D–F, Itpr3 (D), Plcb2 (E), and Gnat3 (F) compared with Trpm5. Blue arrowheads indicate Calhm3, Itpr3, or Plcb2 single-positive cells. Scale bar: 25 μm.
- Figure 2.
Requirement of Skn-1a for the expression of Plcb2, Itpr3, Calhm1, and Calhm3 in taste buds in FuP. In situ hybridization analyses revealed that the expression of Plcb2, Itpr3, Calhm1, and Calhm3 observed in WT mice (top) were not detected in taste buds in Skn-1a–/– mice (bottom). Scale bar: 25 μm.
- Figure 3.
Co-expression of Skn-1a with taste cell genes in taste buds in FuP. Double-fluorescence in situ hybridization was performed to study the relationship of expression of Skn-1a with Calhm3 (A), Itpr3 (B), Plcb2 (C), and Trpm5 (D). Numbers of cells showing signals were counted, and the ratios of cells positive and negative for Calhm3 (A), Itpr3 (B), Plcb2 (C), and Trpm5 (D) to the total population of cells positive for Skn-1a are shown at the right (n = 3). Blue arrowheads indicate Skn-1a single-positive cells. Scale bar: 25 μm.
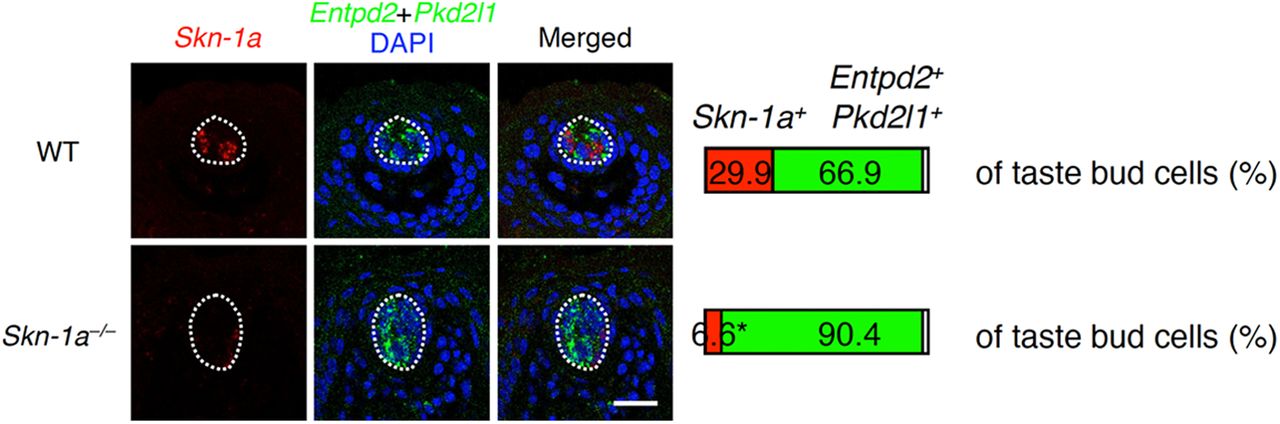
- Figure 4.
Disappearance of Skn-1a-dependent taste bud cells by Skn-1a deficiency. Populations of Skn-1a+ and Skn-1a– cells (i.e., positive to a mixed probe to Entpd2 and Pkd2l1) in taste buds in FuP were quantified by double-fluorescence in situ hybridization analyses. Taste bud profiles are outlined by broken white line. Asterisk indicates the ratio expressing mutant Skn-1a mRNA. The decrease of the Skn-1a+ cell population was statistically evaluated by Welch’s t test: p = 0.0056. Scale bar: 25 μm.
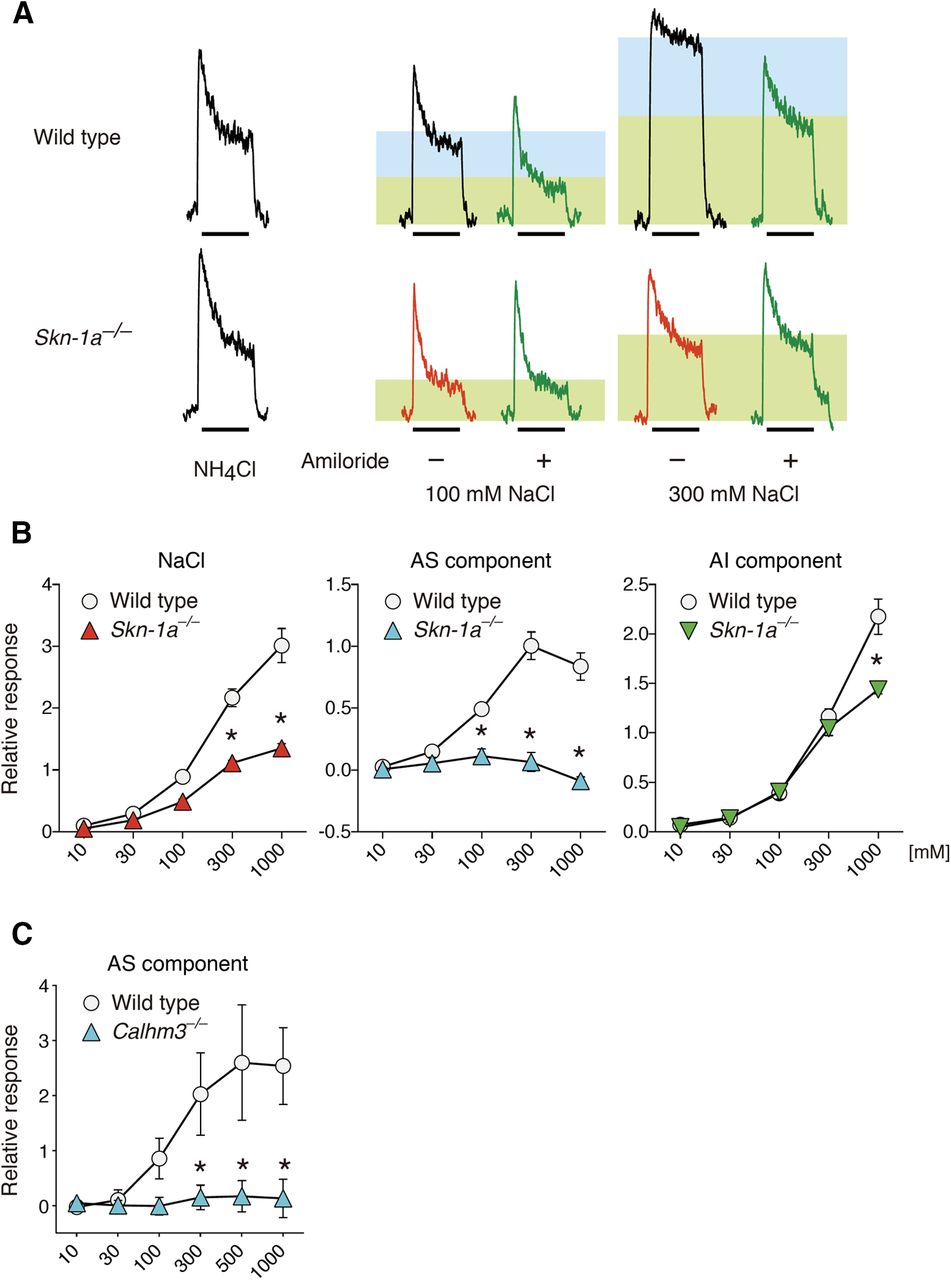
- Figure 5.
Skn-1a deficiency extinguishes AS chorda tympani nerve responses to NaCl. A, Representative charts of chorda tympani nerve responses of WT and Skn-1a–/– mice to NaCl in the presence (green traces) or absence of 100 μm amiloride. Shaded rectangles depict the AS (blue) and AI (green) components in response to NaCl. The bars under the traces show the duration (30 s) of the taste stimulus. B, C, Whole chorda tympani nerve responses of Skn-1a–/– (n = 3) and WT (n = 4) mice (B) and Calhm3–/– (n = 6) and WT (n = 5) mice (C) to NaCl. AS salt responses (AS component; B, middle) were measured by subtracting the AI response (AI component; B, right) from the whole salt response (B, left). Significance was assessed by a repeated-measures two-way ANOVA and the Tukey–Kramer test: *p < 0.05. Data are expressed as the mean ± SEM; where error bars are not visible, they are smaller than the symbol depicting the mean. For details, see Table 2.
- Figure 6.
ENaCα expression in Calhm3+Trpm5– sodium–taste cells in FuP. Double-labeling in situ hybridization was performed to study expression of ENaCα in Calhm3+Trpm5– sodium–taste cells. A–C, ENaCα expression and that of Skn-1a (A), Calhm3 (B), and Trpm5 (C). Numbers of cells showing signals were counted, and the ratios of cells positive and negative for ENaCα (middle images) to the total population of cells positive for the gene (left images) are shown at the right (n = 3). White arrowheads indicate Skn-1a, Calhm3, or Trpm5 single-positive cells, and red arrowheads indicate cells co-expressing ENaCα and Skn-1a, Calhm3, or Trpm5. D, Robust decrease of ENaCα-expression in non-sour taste cells by Skn-1a deficiency in taste buds. Populations of Pkd2l1+ and Pkd2l1– cells in ENaCα-expressing cells were quantified by double-labeling in situ hybridization analyses. White and red arrowheads indicate representative Pkd2l1+ENaCα+ and Pkd2l1–ENaCα+ cells, respectively. Decrease of the Pkd2l1–ENaCα+ cell population was evaluated by Welch’s t test: p = 0.0422. Scale bars: 25 μm.


Tables
Gene name Accession no. Probe region ENaCα BC133688 913–2333 Trpm5 AF228681 310–3491 Calhm1 LC270870 1–1407, 2148–2369 Calhm3 LC270871 1–1653 Itpr3 BC023776 1–3447 Plcb2 BC145249 588–3123 Gnat3 AK040065 41–1019 Skn-1a NM_011139 72–2363 Entpd2 NM_009849 20–1822 Pkd2l1 NM_181422 226–3275 Component Genotype Concentration Interaction Concentrations differing
significantly with p valueSkn-1a KO vs WT Whole to NaCl F(1,5) = 42.156 p = 0.0013 F(4,20) = 138.85 p < 0.0001 F(4,20) = 19.995 p < 0.0001 300 mM (p < 0.0001) 1000 mM (p < 0.0001) AS F(1,5) = 44.941 p = 0.0011 F(4,20) = 34.275 p < 0.0001 F(4,20) = 38.247 p < 0.0001 100 mM (p = 0.0149) 300 mM (p < 0.0001) 1000 mM (p < 0.0001) AI F(1,5) = 10.019 p = 0.0249 F(4,20) = 174.55 p < 0.0001 F(4,20) = 8.0069 p = 0.0005 1000 mM (p < 0.0001) Calhm3 KO vs WT AS F(1,9) = 35.852 p = 0.0002 F(5,45) = 47.097 p < 0.0001 F(5,45) = 37.400 p < 0.0001 300 mM (p < 0.0001) 500 mM (p < 0.0001) 1000 mM (p < 0.0001) - Table 3
Details of double-label in situ hybridization analyses for ENaCα with taste cell marker genes
Tissue Mouse Marker
geneNo. of
taste budsRatio (%)* FuP B6, n = 3 Skn-1a 40 12.8 ± 2.2 B6, n = 3 Calhm3 25 13.9 ± 3.2 B6, n = 3 Trpm5 27 0 B6, n = 3 Pkd2l1 20 38.0 ± 7.2 Skn-1a–/–, n = 3 Pkd2l1 27 7.2 ± 2.0 Palate B6, n = 3 Skn-1a 32 13.0 ± 4.7 B6, n = 3 Calhm3 28 8.8 ± 0.6 B6, n = 3 Trpm5 25 0 B6, n = 3 Pkd2l1 22 44.5 ± 3.0 Skn-1a–/–, n = 3 Pkd2l1 39 2.9 ± 1.7 Double-positive cells to marker gene-positive cells (Skn-1a, Calhm3, and Trpm5) or to Pkd2l1–ENaCα+ cells to ENaCα+ cells.
Extended Data Figure 1-1
Immunohistochemical identification of sodium–taste cells. A, Double-fluorescence immunohistochemistry using anti-Itpr3 and anti-Gnat3 antibodies. Itpr3+Gnat3– cells in taste buds of FuP (top) and soft palate (middle) are indicated by blue arrowhead in the merged image (right). In taste buds of CvP (bottom) where cells identified by the expression of Gnat3 and/or T1R3 are equivalent to Trpm5+ cells (Ohmoto et al., 2011), Itpr3+ cells are always positive to Gnat3 and/or T1R3. N = 3. B, Double-fluorescence immunohistochemistry using anti-Itpr3 and anti-Skn-1a (top) or anti-Ddc (bottom) antibodies. Itpr3 signals are present in Skn-1a+ cells and absent in Ddc+ cells. N = 2. Scale bars: 25 μm. Download Figure 1-1, TIF file.
Extended Data Figure 1-2
Expression of taste cell genes in taste buds in soft palate. Double-fluorescence in situ hybridization was performed to study the relationship of expression of Trpm5 with Calhm3 (A), Itpr3 (B), Plcb2 (C), and Gnat3 (D) required for sweet, umami, bitter, or salty taste reception. Numbers of cells showing signals were counted, and the ratios of cells positive and negative for Trpm5 to the total population of cells positive Calhm3 (A), Itpr3 (B), Plcb2 (C), and Gnat3 (D) are shown at the right (n = 3). Blue arrowheads indicate Calhm3, Itpr3, or Plcb2 single-positive cells. Scale bar: 25 μm. Download Figure 1-2, TIF file.
Extended Data Figure 2-1
Requirement of Skn-1a for the expression of Plcb2, Itpr3, Calhm1, and Calhm3 in taste buds in soft palate. In situ hybridization analyses revealed that the expression of Plcb2, Itpr3, Calhm1, and Calhm3 observed in WT mice (top) were not detected in taste buds in Skn-1a–/– mice (bottom). Scale bar: 25 μm. Download Figure 2-1, TIF file.
Extended Data Figure 3-1
Co-expression of Skn-1a with taste cell genes in taste buds in soft palate. Double-fluorescence in situ hybridization was performed to study the relationship of expression of Skn-1a with Calhm3 (A), Itpr3 (B), Plcb2 (C), and Trpm5 (D). Numbers of cells showing signals were counted, and the ratios of cells positive and negative for Trpm5 to the total population of cells positive Calhm3 (A), Itpr3 (B), Plcb2 (C), and Trpm5 (D) are shown at the right (n = 3). Blue arrowheads indicate Skn-1a single-positive cells. Scale bar: 25 μm. Download Figure 3-1, TIF file.
Extended Data Figure 4-1
Disappearance of Skn-1a-dependent taste bud cells by Skn-1a deficiency. Populations of Skn-1a+ and Skn-1a– cells (i.e., positive to a mixed probe to Entpd2 and Pkd2l1) in taste buds in soft palate were quantified by double-fluorescence in situ hybridization analyses. Taste bud profiles are outlined by broken white lines. Asterisk indicates the ratio expressing mutant Skn-1a mRNA. Decrease of Skn-1a+ cell population was statistically evaluated by Welch’s t test: p = 0.0001. Scale bar: 25 μm. Download Figure 4-1, TIF file.
Extended Data Figure 6-1
Co-expression of Calhm1 and Calhm3 in taste buds. Double-fluorescence in situ hybridization was performed to study the relationship of expression of Calhm1 with Calhm3. Numbers of cells showing signals were counted, and the ratios of cells positive and negative for Calhm1 to the total population of cells positive Calhm3 are shown at the right (n = 3). Scale bars: 25 μm. Download Figure 6-1, TIF file.
Extended Data Figure 6-2
ENaCα expression in Calhm3+Trpm5– sodium–taste cells in soft palate. Double-labeling in situ hybridization was performed to study expression of ENaCα in Calhm3+Trpm5– sodium–taste cells. A–C, ENaCα expression and that of Skn-1a (A), Calhm3 (B), and Trpm5 (C). Numbers of cells showing signals were counted, and the ratios of cells positive and negative for ENaCα (middle images) to the total population of cells positive for the gene (left images) are shown at the right (n = 3). White arrowheads indicate Skn-1a, Calhm3, or Trpm5 single-positive cells, and red arrowheads indicate cells co-expressing ENaCα with Skn-1a, Calhm3, or Trpm5. D, Robust decrease of ENaCα-expression in non-sour taste cells by Skn-1a deficiency in taste buds. Populations of Pkd2l1+ and Pkd2l1– cells in ENaCα-expressing cells were quantified by double-labeling in situ hybridization analyses. White and red arrowheads indicate representative Pkd2l1+ENaCα+ and Pkd2l1–ENaCα+ cells, respectively. Decrease of the Pkd2l1–ENaCα+ cell population was evaluated by Welch’s t test: p = 0.0009. Scale bars: 25 μm. Download Figure 6-2, TIF file.
In this issue


