

Article Figures & Data
Figures
- Figure 1.
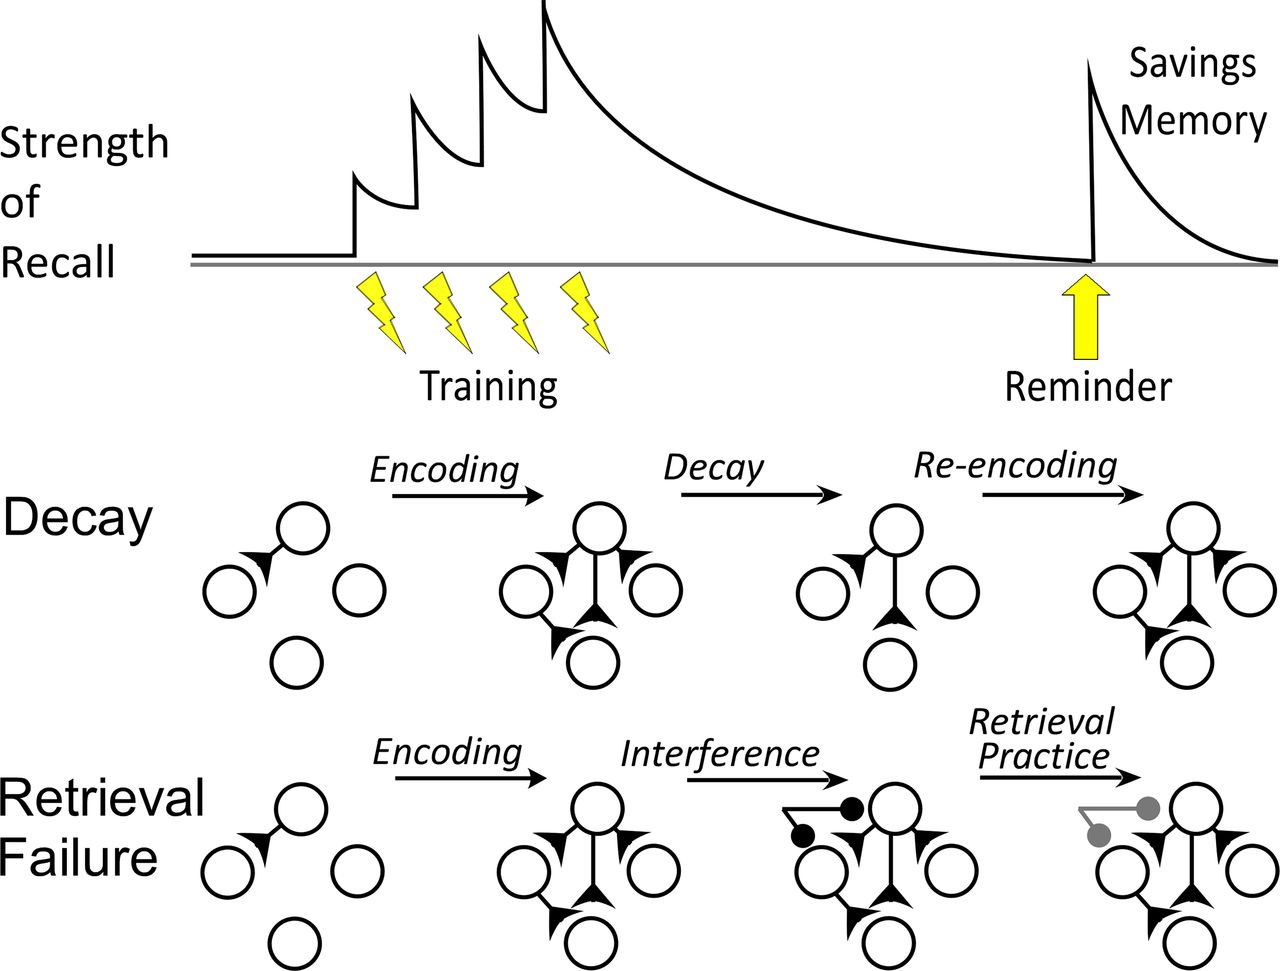
Savings memory according to decay and retrieval-failure accounts of forgetting. Top, Savings memory. Repeated rounds of training (lightning bolts) increase strength of recall, but in the absence of additional practice, forgetting occurs, indicated by a decline in the strength of recall toward zero. Nevertheless, a brief reminder can re-instate recall; this is known as savings memory. Middle, In decay theories of forgetting, initial learning changes synaptic connectivity and strength forming a memory trace. Over time, however, these changes decay away, leading to forgetting (reduced recall). During savings memory, the memory trace must be almost entirely rebuilt. Savings is thus predicted to use the same transcriptional mechanisms that initially created the memory trace. Bottom, In retrieval-failure theories of forgetting, forgetting is due not to decay but to interference from other memories. For example, additional learning could inhibit (dark circles) the otherwise intact memory trace. In this framework, savings involves repairing retrieval mechanisms (e.g., downregulating inhibition). Thus, savings is predicted to be transcriptionally distinct from initial memory storage.
- Figure 2.
Long-term sensitization in Aplysia. A, Overview of the behavioral paradigm. Sensitization is an increase in responsiveness because of noxious stimulation. To produce long-term sensitization in Aplysia, animals were exposed to four rounds of painful shock to one side of the body (training site: lightning bolt). The effect of training was monitored by measuring the duration of the T-SWR, a defensive withdrawal of the siphon evoked by an innocuous stimulus to the left or right side of the tail (test site). To document savings, a reminder was administered to the midline of the tail (reminder site, wide arrow). In naive animals this reminder produces short-term but not long-term sensitization. B, Behavioral protocols. Behavioral measures were the same in all experimental groups: T-SWR responses were evoked on the left and right tail (red and black hash lines). Responses were measured at pre-test, 1 d after training, 7 d after training, 20 min after the reminder, and 1 d after the reminder (day 8 from training). Animals differed in their experimental treatments. For the savings-memory group, animals received standard sensitization training after pre-test measures (four strong shocks, 30 min apart, lightning bolts). Then, 7 d after training animals received the reminder (wide arrow) to evoke savings memory. For the forgotten-memory group, the treatment was the same except animals were given sham reminder (gray arrow crossed out), leaving the sensitization memory dormant. Finally, for new-memory group, animals initially received sham sensitization training (gray lightning bolts crossed out) and then received real sensitization training after the 7-d post-tests. All animals were harvested for microarray analysis after the 1-d savings tests (day 8 from start). Thus, all animals received the same behavioral testing but, when harvested, were expressing different states of sensitization memory: new (1 d since training), forgotten (8 d since training with no reminder), or savings (8 d since training and 1 d since the reminder). In addition, we analyzed an archival dataset from Conte et al. (2017), which roughly replicates the new-memory group (harvested 1 d after sensitization training). We used these archival data to benchmark assessments of similarity.
- Figure 3.
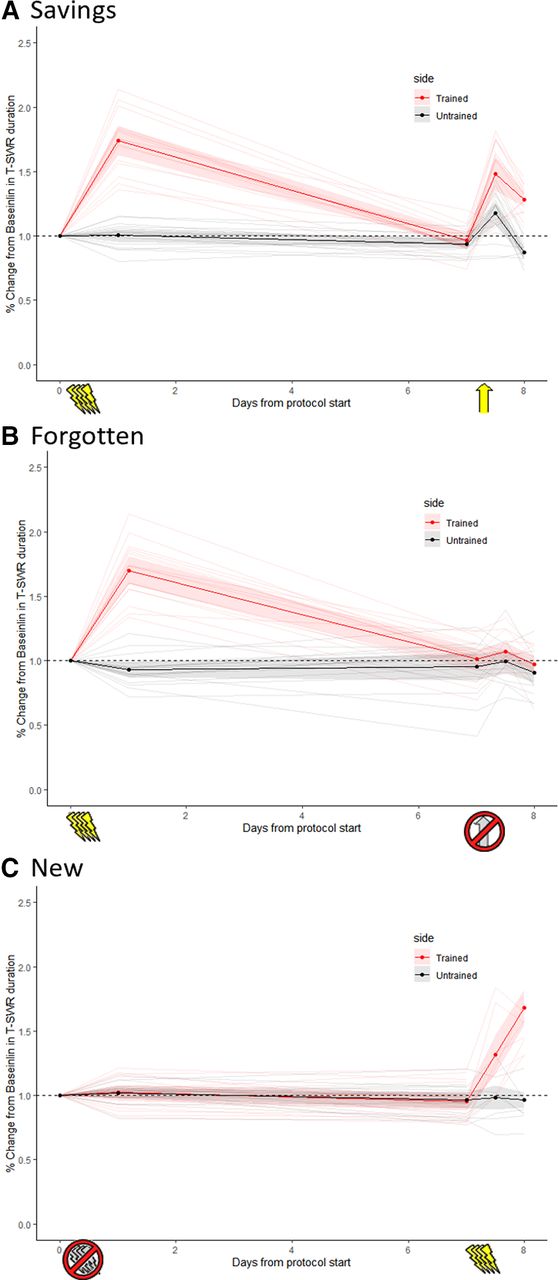
Behavioral changes in the savings, forgetting, and new-memory conditions. This figure shows T-SWR duration as a % change from pre-test on both the trained (red) and untrained (black) sides. Dark lines with dots represent group means; shading indicates 95% CI of the mean. Individual animals are represented by the light lines. A, Savings-memory group, which received real training (lightning bolts) after pre-tests and a reminder (yellow arrow) after the 7-d tests. All animals were expressing a long-term savings memory when harvested on day 8. B, Forgotten-memory group, which received real training after pre-tests but a sham reminder (crossed-out arrow) after the 7-d tests. All animals showed apparent forgetting when harvested. C, New-memory group, which received sham training (crossed-out lightning bolts) after pre-tests and then real training after the 7-d tests. All animals were expressing a new (1-d-old) memory when harvested.
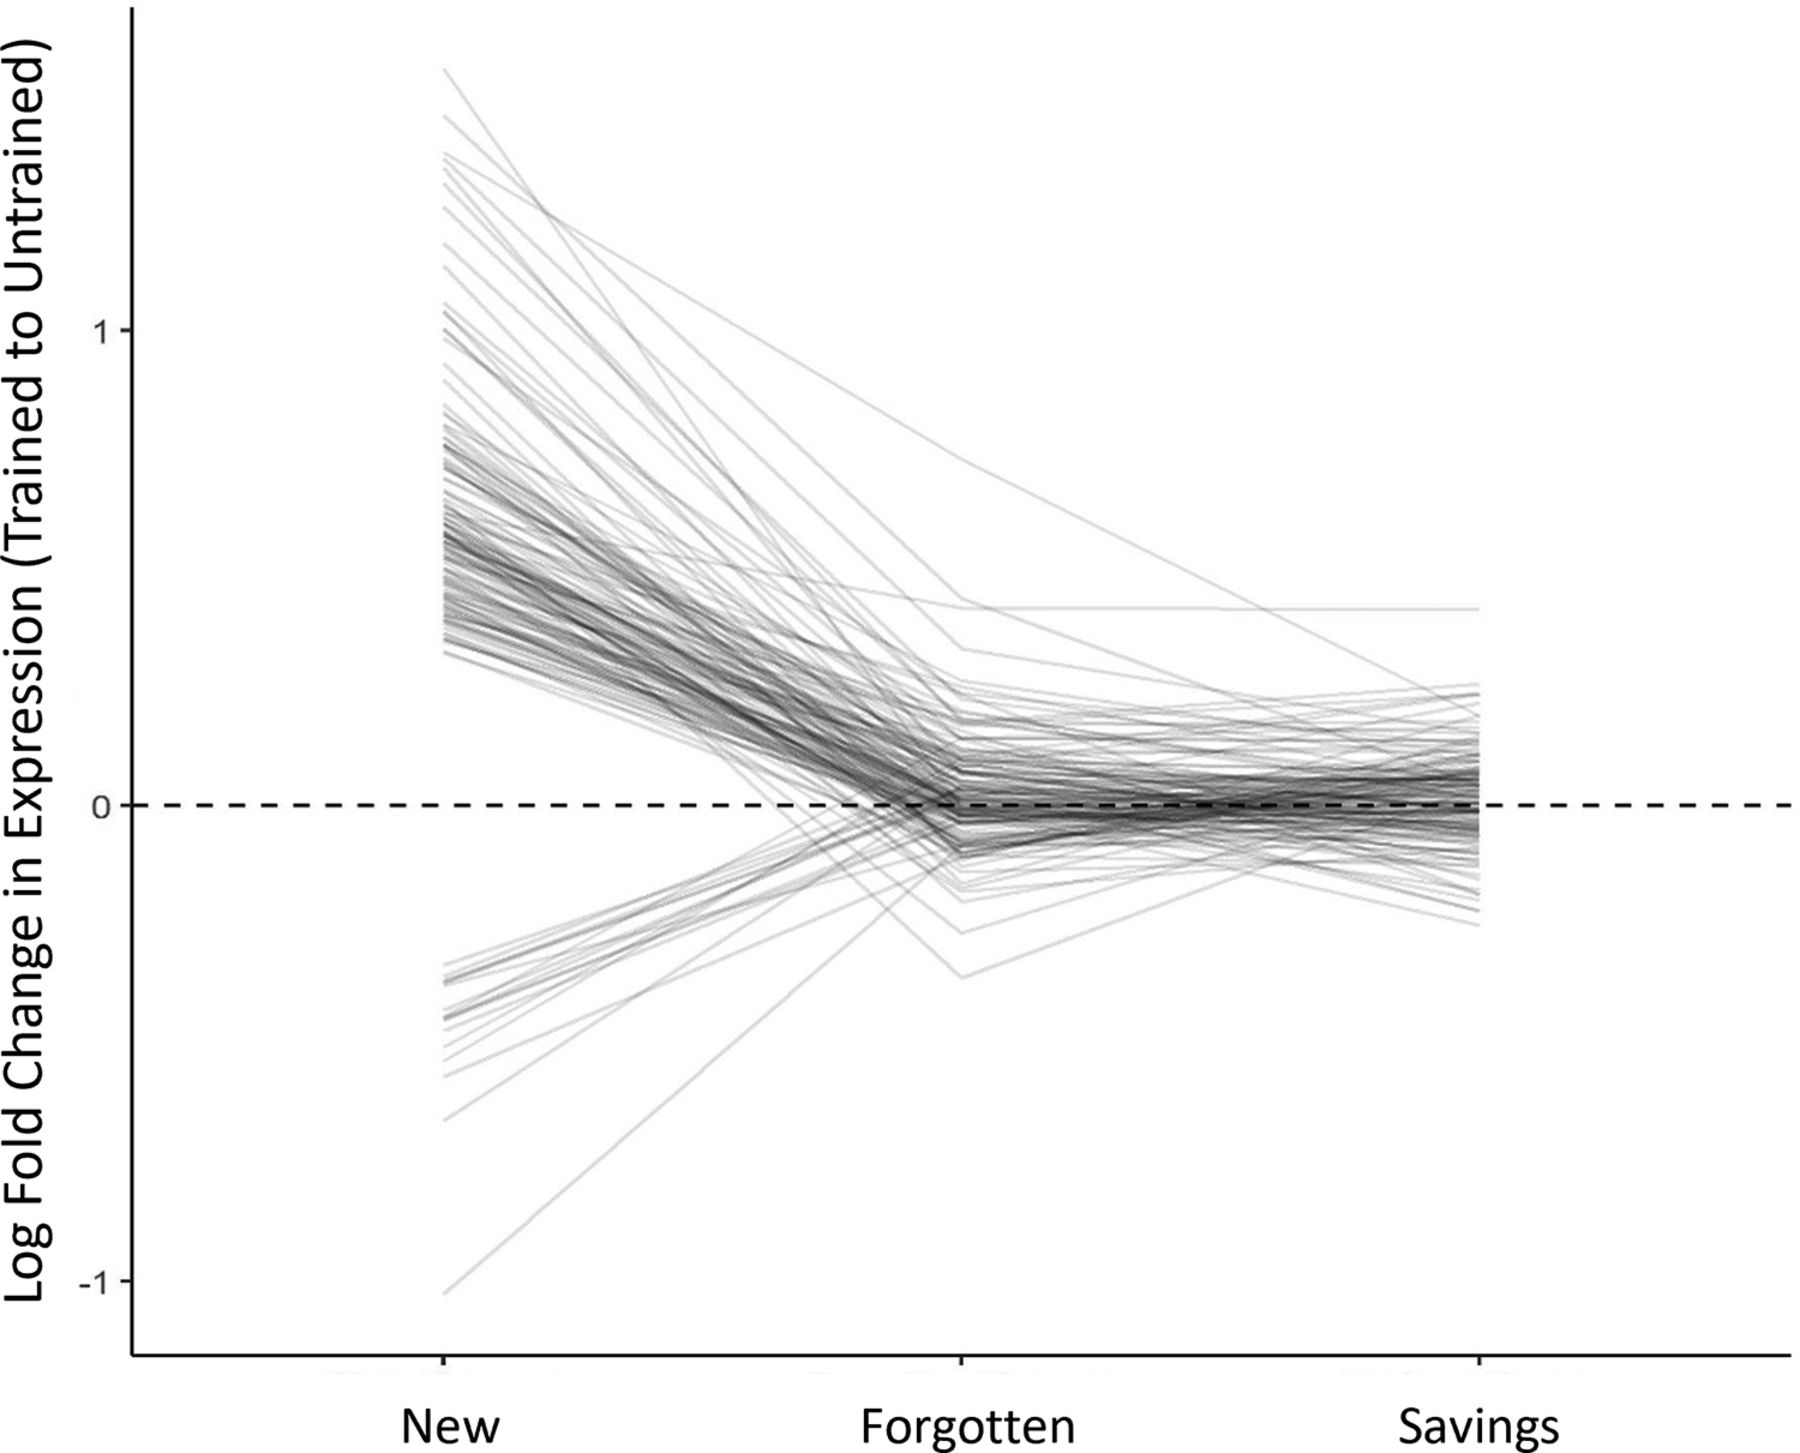
- Figure 4.
Fate of transcripts regulated during initial learning. This graph shows mean LFC (trained vs untrained) for each of the 148 transcripts flagged as clearly regulated in the new-memory group, tracking their expression during forgetting and savings. The dashed line at 0 represents no change in expression (when trained and untrained expression are the same, their ratio is 1, which gives an LFC of 0). Although these transcripts were clearly regulated 1 d after sensitization (new memory), none were clearly regulated during forgetting or savings.
- Figure 5.
Similarity of conditions measured by rank-ordering of transcripts. These figures show similarity in the transcriptional states between the new-memory group and the forgotten-memory group (A), the savings-memory group (B), and the archival new-memory group (C). Panels on left compare observed similarity by gene-list length (black line) relative to the range of similarity observed with random shuffles of gene lists (yellow bars). Panels on right show overall similarity score for top ∼1000 genes against the distribution of scores from random shuffles.
- Figure 6.
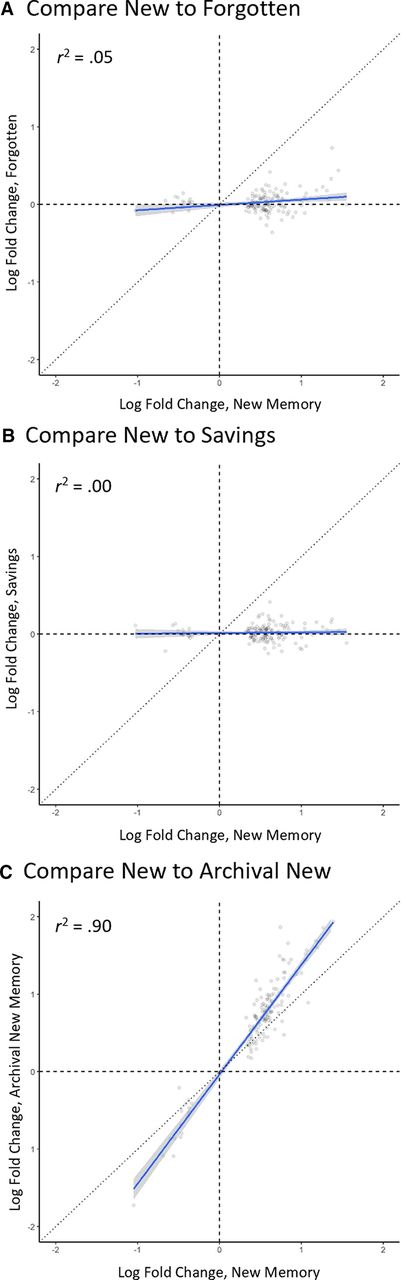
Similarity of conditions measured by correlation in LFCs. These figures show the correlation in LFC between the new-memory group and the forgotten-memory group (A), the savings-memory group (B), and the archival new-memory group (C). Only the 148 transcripts clearly regulated in the new-memory group are shown. The black dots are individual transcripts; the blue line is the line of best fit with shading indicating the 95% CI; the diagonal line shows a 1:1 relationship that would occur with perfect similarity.
- Figure 7.
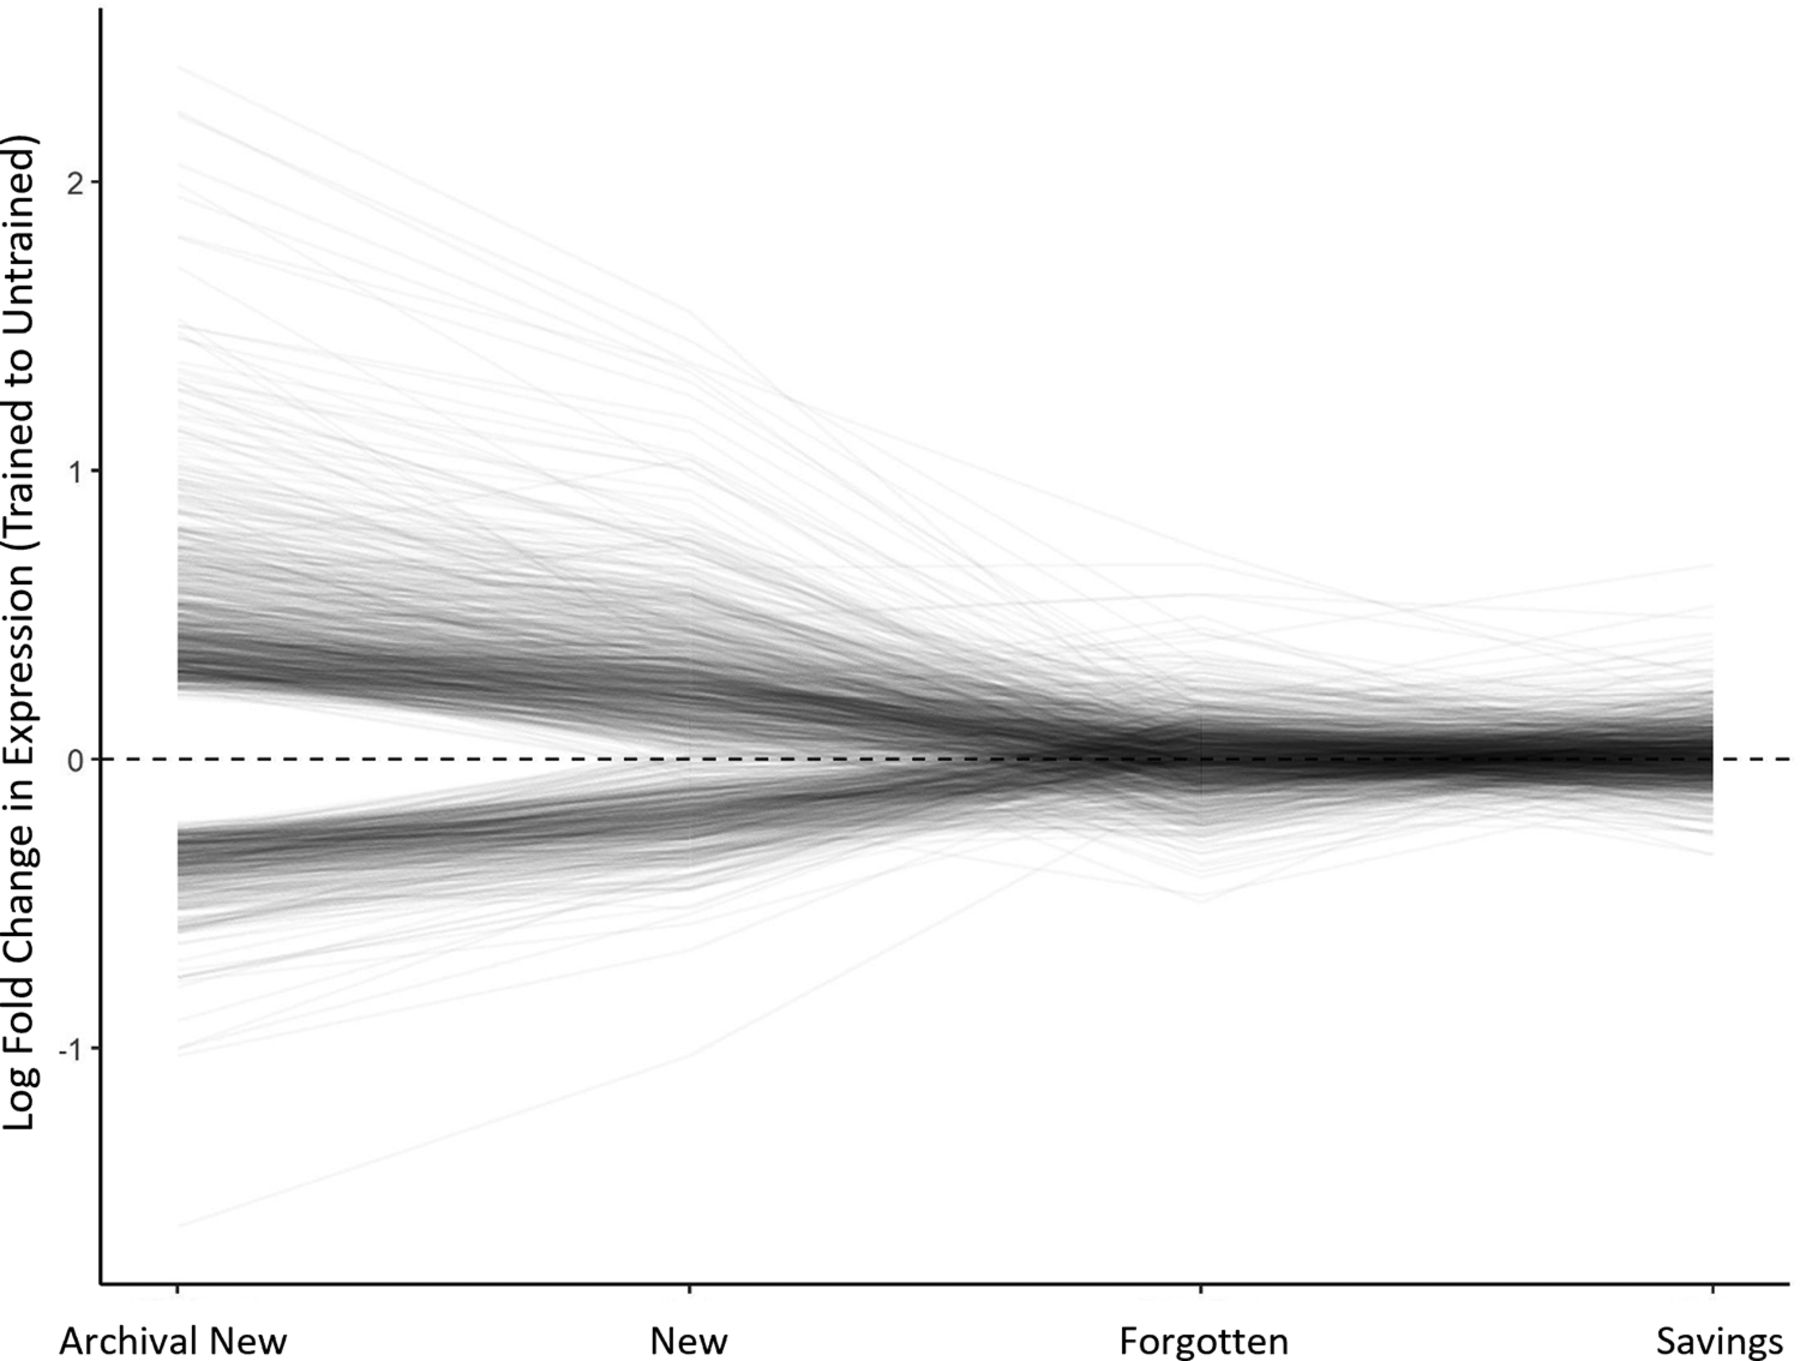
Exploratory analysis of fate of transcripts previously identified as regulated 1 d after sensitization training. This graph shows mean LFC (trained vs untrained) for 1198 transcripts which showed clear regulation in the archival new-memory condition (Conte et al., 2017), tracking their expression in the current new, forgetting, and savings groups. The dashed line at 0 represents no change in expression. Comparing the archival new-memory group to the current new-memory group shows some regression to the mean but that most transcripts show similar regulation. These transcriptional changes fade during forgetting (most transcripts collapse toward 0), and there is no obvious perturbation in expression when savings memory is induced.


Tables
Group Upregulated Downregulated Estimated false negative rate Proportion of new memory transcripts coregulated New memory 131 17 <1% Forgotten memory 0 0 <1% 0.00 95% CI [0.00, 0.03] Savings memory 0 0 <1% 0.00 95% CI [0.00, 0.03] Archival new memory 798 463 <1% 0.95 95% CI [0.91, 0.98] A complete table of microarray results is provided in Extended Data Table 1-1.
Transcript Description Previous result Forgetting Savings Z15041.1 ApBiP 0.63 ± 0.46 −0.04 ± 0.71 0.07 ± 0.31 M11283.1 FMRFa 0.53 ± 0.51 0.41 ± 0.26 0.67 ± 0.18 EB257711.1 LOC101857556 0.52 ± 0.46 0.26 ± 0.24 0.11 ± 0.32 EB254334.1 Transcribed locus 0.51 ± 0.50 0.73 ± 0.31 0.19 ± 0.58 FF066943.1 LOC106013098 0.36 ± 0.42 0.57 ± 0.13 0.49 ± 0.14 EB243511.1 Transcribed locus −0.23 ± 0.50 0.00 ± 0.22 −0.21 ± 0.24 EB342172.1 Transcribed locus −0.62 ± 0.35 −0.17 ± 0.23 0.08 ± 0.25 This table shows results for a set of seven transcripts previously identified via microarray and qPCR as being regulated after forgetting of sensitization. The previous result column is taken from Patel et al. (2018); it is qPCR data from pleural ganglia harvested 7 d after training, when sensitization had been forgotten. The forgetting and savings columns microarrays are from the current study, both of which were harvested 8 d after training. Numeric results are LFCs in expression ± the 95% margin of error (expanded for multiple comparisons).
Extended Data Table 1-1
Complete table of microarray results. This table provides microarray results for each transcript in each condition. The Transcript column provides the unique identified for the transcript probe. The BestAnnotation column provides an annotation (if available) for that transcript. The Previous_finding column indicates if that transcript was previously identified as regulated after long-term sensitization training. The LFC columns report the mean LFC for that transcript (trained vs control) by condition (d1 for new, w1 for forgetting, sav for savings). The adj.MoE columns report the 95% margins of error for these mean LFCs, adjusted to maintain a 5% false discovery rate. The adj.p values report the p values for a test for regulation (against an interval null of ±10%), adjusted to maintain a 5% false discovery rate. Note that where the adjusted p value is 1, the corresponding adjusted margin of error cannot be calculated and is listed as NA. Finally, the MoE columns report the raw 95% margins of error. Download Table 1-1, XLSX file.
In this issue


