

Article Figures & Data
Figures
- Figure 1.
Generation and characterization of an Rln3-Cre transgenic line. A, Targeting of the Rln3 gene locus. A transgenic construct encoding a Cre-GFP fusion protein and a neomycin (NEO) resistance marker was prepared targeting to the 3′-untranslated part of exon 2 of the Rln3 gene, and electroporated into ESCs (Materials and Methods). ESC clones were selected for neomycin resistance and were initially screened by PCR across the 5′-flanking arm, then by Southern hybridization using a 1.9-kb probe to the 3′-flanking arm. B, Autoradiogram of a Southern blot of an XbaI genomic digest detecting a >10-kb band in the native Rln3 locus and a novel 6-kb band in the targeted locus. Asterisks indicate ESC lines with correct targeting. Clone 9 has a randomly integrated transgene, and was negative in the initial PCR screen for correct targeting. Clones 8,13, 48, and 69 have the digestion pattern expected for a single correct integrant. C–H, FISH showing co-expression of mRNA for Cre and Rln3 in the rostral (C, D), central (E, F), and caudal (G, H) nucleus incertus of a heterozygous Rln3Cre mouse. Insets in F show complete concordance of Cre and Rln3 expression. I, J, Expression of Rln3 (L) and VGAT (M) mRNA in the NI and surrounding CG; ISH data are derived from the Allen Brain Atlas (Ng et al., 2009), case numbers 73929581 and 72081554, respectively. K, Confocal images of FISH using probes for Rln3 and VGAT mRNA, at a rostrocaudal level similar to that shown in E, F. K1, Rln3 signal, K2, Gad2 signal, K3, merged signals. The left NI is shown. Rln3 expression is restricted to the NI, while VGAT is widely expressed in the surrounding CG. All of the NI-Rln3 neurons in the field co-express VGAT. 4V, fourth ventricle; CG, central pontine gray; DRI, dorsal raphe, interfascicular part; DTg, dorsal tegmental nucleus; LDTg, laterodorsal tegmental nucleus; NI, nucleus incertus; PnR, pontine raphe nucleus. Scale bar: 200 μm (D, K).
- Figure 2.
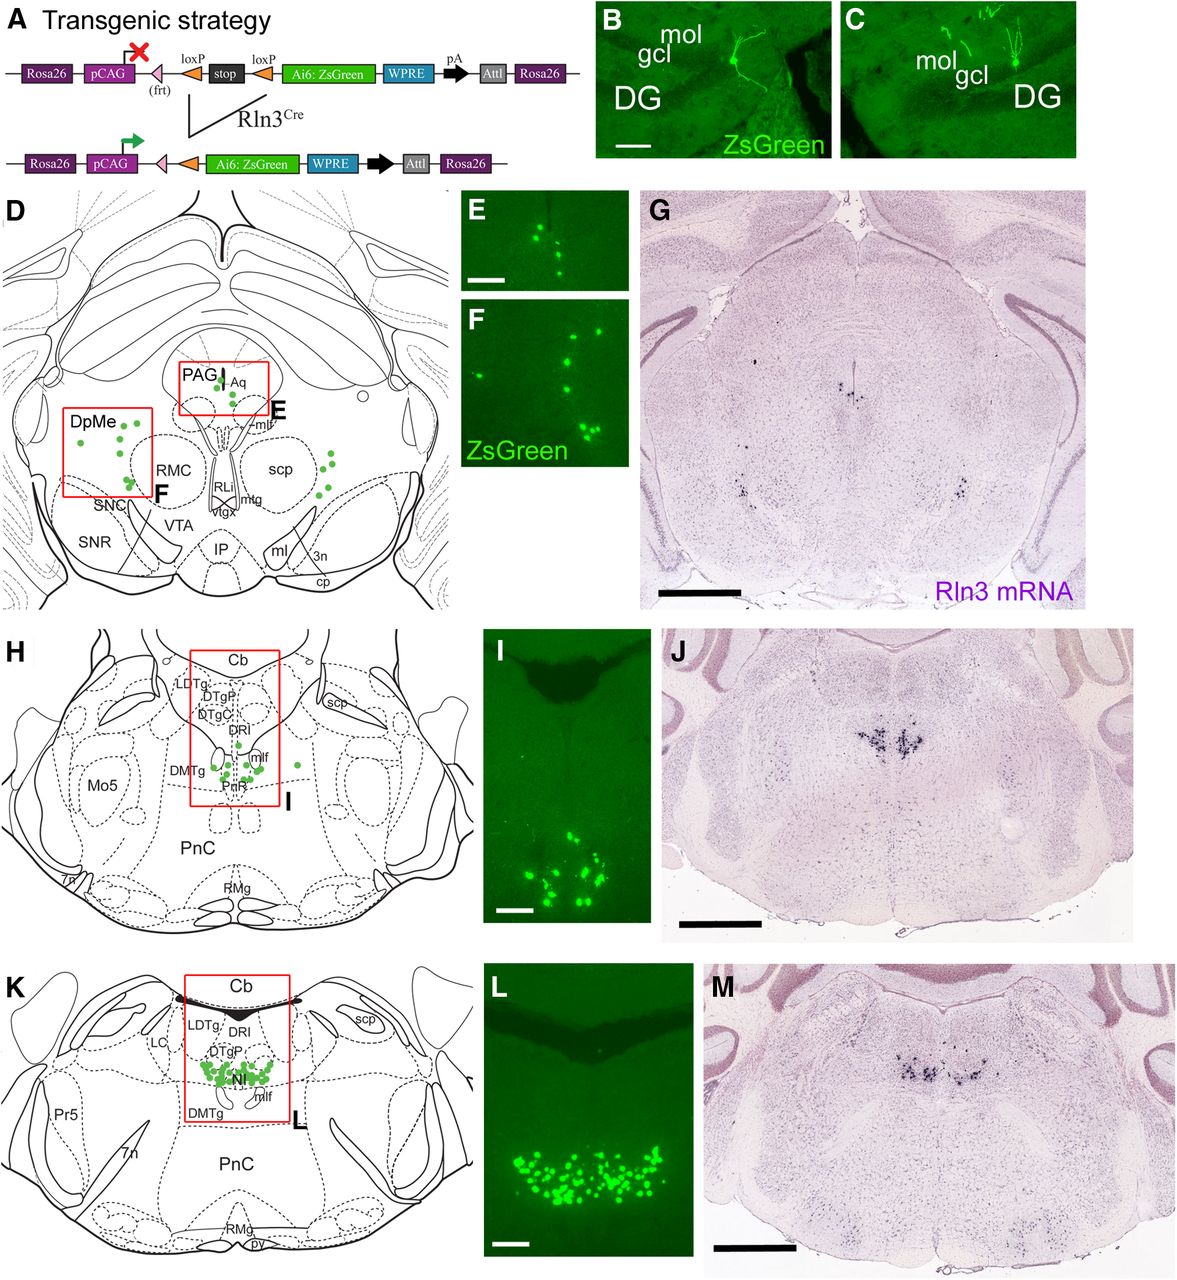
Fidelity of Rln3Cre -driven genetic reporter expression. A, Transgenic reporter strategy: Rln3Cre mice were interbred with the genetic reporter strain Ai6, which conditionally expresses a ZsGreen reporter from the Gt(Rosa)26Sor locus. At each brain level, induced expression of the reporter was compared with endogenous expression of Rln3 mRNA in the Allen Brain Atlas (Allen Atlas case 73929581). B, C, Isolated examples of rare neurons showing ectopic reporter expression in the hippocampus. D–G, Expression in the midbrain at a level corresponding to bregma −3.5 in a standard atlas (Paxinos and Franklin, 2001). Reporter expression appears in the midbrain PAG (E) and in an area dorsal to the substantia nigra (F). H–J, Expression in the pontine raphe/rostral nucleus incertus, bregma −5.2. The view in J is slightly caudal to the views in H, I and includes more neurons dorsal to the mlf. K–M, Expression in the central part of the nucleus incertus, bregma −5.40. DG, dentate gyrus; gcl, granular cell layer; mol, molecular layer of the dentate gyrus. Scale bars: 100 μm (B), 200 μm (E, I, L), and 1 mm (G, J, M).
- Figure 3.
Expression and co-expression of Rln3 and NMB in the pontine central gray. A–F, FISH was used to examine Rln3 and NMB mRNA expression in six equally spaced sections at levels corresponding to bregma −5.0 to bregma −5.8 in a standard atlas (Paxinos and Franklin, 2001). Z-stacks of confocal images of the cells in the boxed area of each panel are shown at right. A, Area rostral to the NI at bregma −5.0. Rostral, central, and caudal in B–D represent NI levels approximately equivalent to the images in Figure 1 but are shifted slightly caudally relative to that figure. B, Corresponds to bregma −5.16 relative to a standard atlas, (C) at bregma −5.32, and (D) at bregma −5.48. Sections E, F lie caudal to the area designated NI in a standard atlas, (E) at bregma −5.64, and (F) at bregma −5.80. The numerical values in B–F in the lower right of the panels represent cell counts for neurons expressing Rln3 alone (red), NMB alone (green), and both markers (yellow). In the rostral and central NI, neurons expressing NMB alone were identified dorsal and ventral to the NI-Rln3 neurons, near the midline (B, C, arrows); in the caudal NI cells expressing NMB alone predominate (D). The area posterior to the NI has a large population of cells which express NMB alone (E, F). G, Graphical representation of the distribution of Rln3 and NMB expression in images (B–E). 4V, fourth ventricle; 7n, seventh nerve; CG, central pontine gray; DRI, dorsal raphe, interfascicular part; DTg, dorsal tegmental nucleus; LDTg, laterodorsal tegmental nucleus; mlf, medial longitudinal fasciculus; NI, nucleus incertus; PDTg, posterodorsal tegmental nucleus. Scale bar: 200 μm (A).
- Figure 4.
Fast neurotransmitter markers in NMB-expressing neurons in the pontine tegmentum. FISH was used to examine co-expression of NMB mRNA and GAD2 or VGluT2 in the rostral, central, and caudal NI, corresponding to bregma −5.34, bregma −5.40/−5.52 and bregma −5.68 in a standard atlas. Z-stacks of confocal images of the cells in the boxed area of each panel are shown at right. A–C, NMB and GAD2 expression. No NMB-expressing neurons were identified which did not also express GAD2. C1, C2: top panel, NMB signal; middle panel, Gad2 signal; bottom panel, merged signal. D–F, NMB and VGluT2 expression. F1, F2: top panel, NMB signal; middle panel, VGluT2 signal; bottom panel, merged signal. No cells with clear co-expression of NMB and VGluT2 were identified. A rare case of convergent signal in the confocal image appears to result from overlapping cellular profiles in a densely packed area, not cellular co-expression (arrow, F1). G, Schematic of the relationship of the neurotransmitter phenotypes in the pontine tegmentum, derived from combined data in Figures 3, 4. 4V, fourth ventricle; CG, central pontine gray; DTg, dorsal tegmental nucleus; LDTg, laterodorsal tegmental nucleus; NI, nucleus incertus; PDTg, posterodorsal tegmental nucleus. Scale bar: 200 μm (A).
- Figure 5.
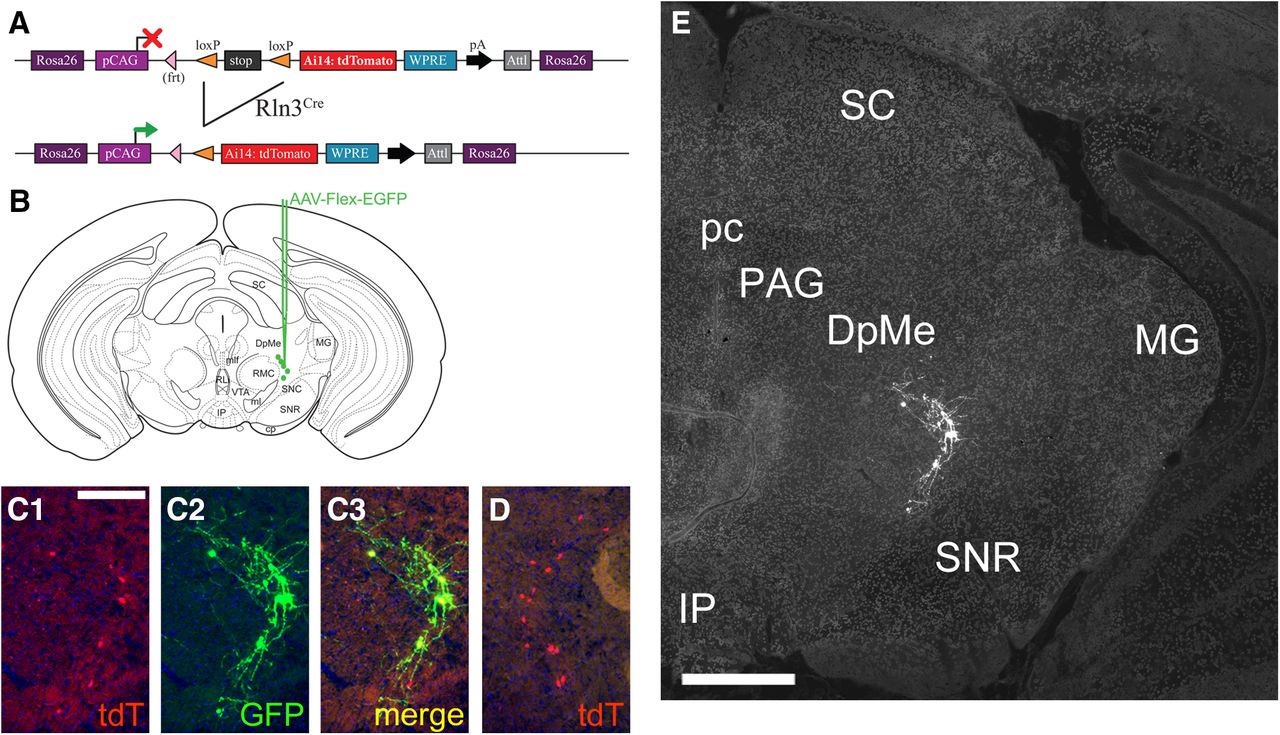
Anterograde viral labeling of Rln3 neurons in the deep mesencephalic area. A, Strategy for genetic labeling of Rln3Cre mice bearing the Gt(ROSA)26-targeted tdTomato reporter allele Ai14. Genetic labeling of Rln3tdT neurons in this way allows assessment of the efficiency of viral labeling. B, Injection of AAV: FLEX-GFP into the deep mesencephalic area, dorsal to the substantia nigra, at a level corresponding to bregma −3.4 in a standard atlas (Paxinos and Franklin, 2001). Targeted coordinates: AP: −3.50, ML: 1.15, DV: 3.00. C, Expression of genetically expressed tdTomato, virally expressed EGFP, and both markers together in the injected area. C1, tdTomato signal; C2, GFP signal; C3 merged images. D, Rln3Cre -induced tdTomato expression on the side contralateral to the injection. E, Labeled cell bodies and fibers in the deep mesencephalic area. Labeled fibers from Rln3Cre neurons in the DpMe were not detected outside the mesencephalon. DpMe, deep mesencephalic area; IP, interpeduncular nucleus; MG, medial geniculate; PAG, periaqueductal gray; pc, posterior commissure; SC, superior colliculus; SNR, substantia nigra, pars reticulata. Scale bars: 200 μm (C) and 500 μm (E).
- Figure 6.
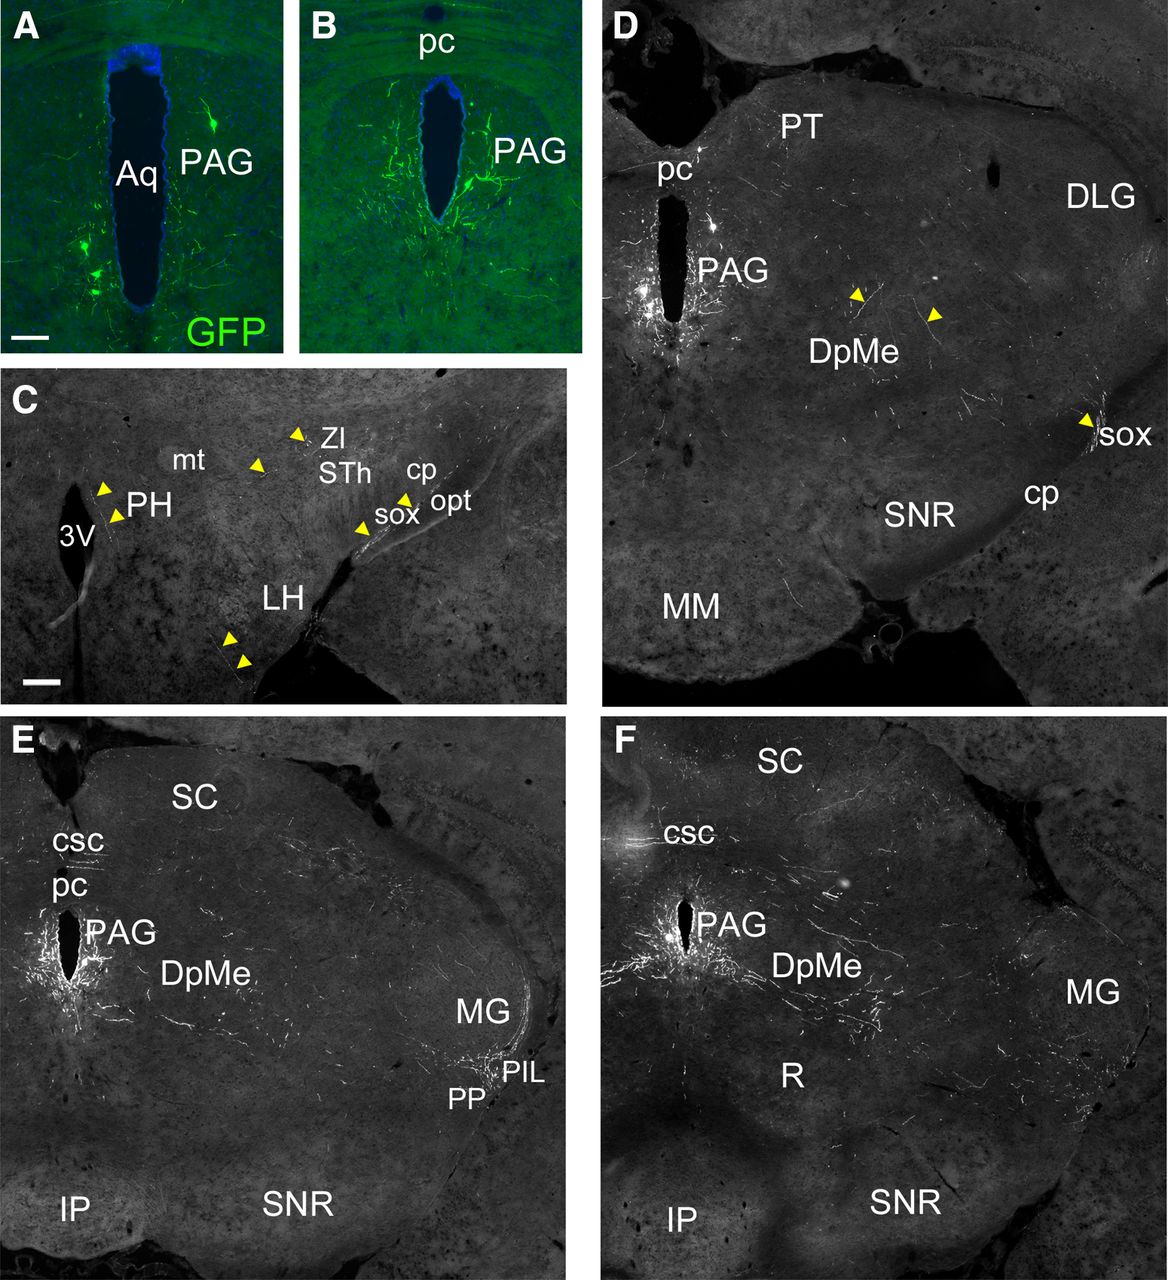
Anterograde viral labeling of Rln3 neurons in the mesencephalic PAG. A, B, Cell bodies of Rln3Cre neurons in the PAG labeled by injection of AAV:FLEX-GFP. Targeted coordinates: AP: −2.80, ML: 0.1, DV: 3.00. C, Sparse labeled fibers in the hypothalamic area and supraoptic decussation (arrows), at a level corresponding to bregma −2.0 in a standard atlas. D, Labeled fibers in the mesencephalon and supraoptic decussation (arrows; same section as in A), bregma −2.8. E, Labeled fibers in the mesencephalon and inferior to the MG (same section as in B), bregma −3.1. F, Labeled fibers in the mesencephalon and inferior to the MG, bregma −3.4. 3V, third ventricle; Aq, aqueduct; cp, cerebral peduncle; csc, commissure of the superior colliculus; DLG,; DpMe, deep mesencephalic area; IP, interpeduncular nucleus; LH, lateral hypothalamus; MG, medial geniculate; MM, medial mammillary nucleus; mt, mammillothalamic tract; opt, optic tract; PAG, periaqueductal gray; pc, posterior commissure; PH, posterior hypothalamus; PIL, posterior intralaminar thalamic nucleus; PP, peripeduncular nucleus; PT, pretectum; R, red nucleus; SC, superior colliculus; sox, supraoptic decussation; SNR, substantia nigra, pars reticulata; STh, subthalamic nucleus; ZI, zona incerta. Scale bars: 100 μm (A) and 200 μm (C).
- Figure 7.
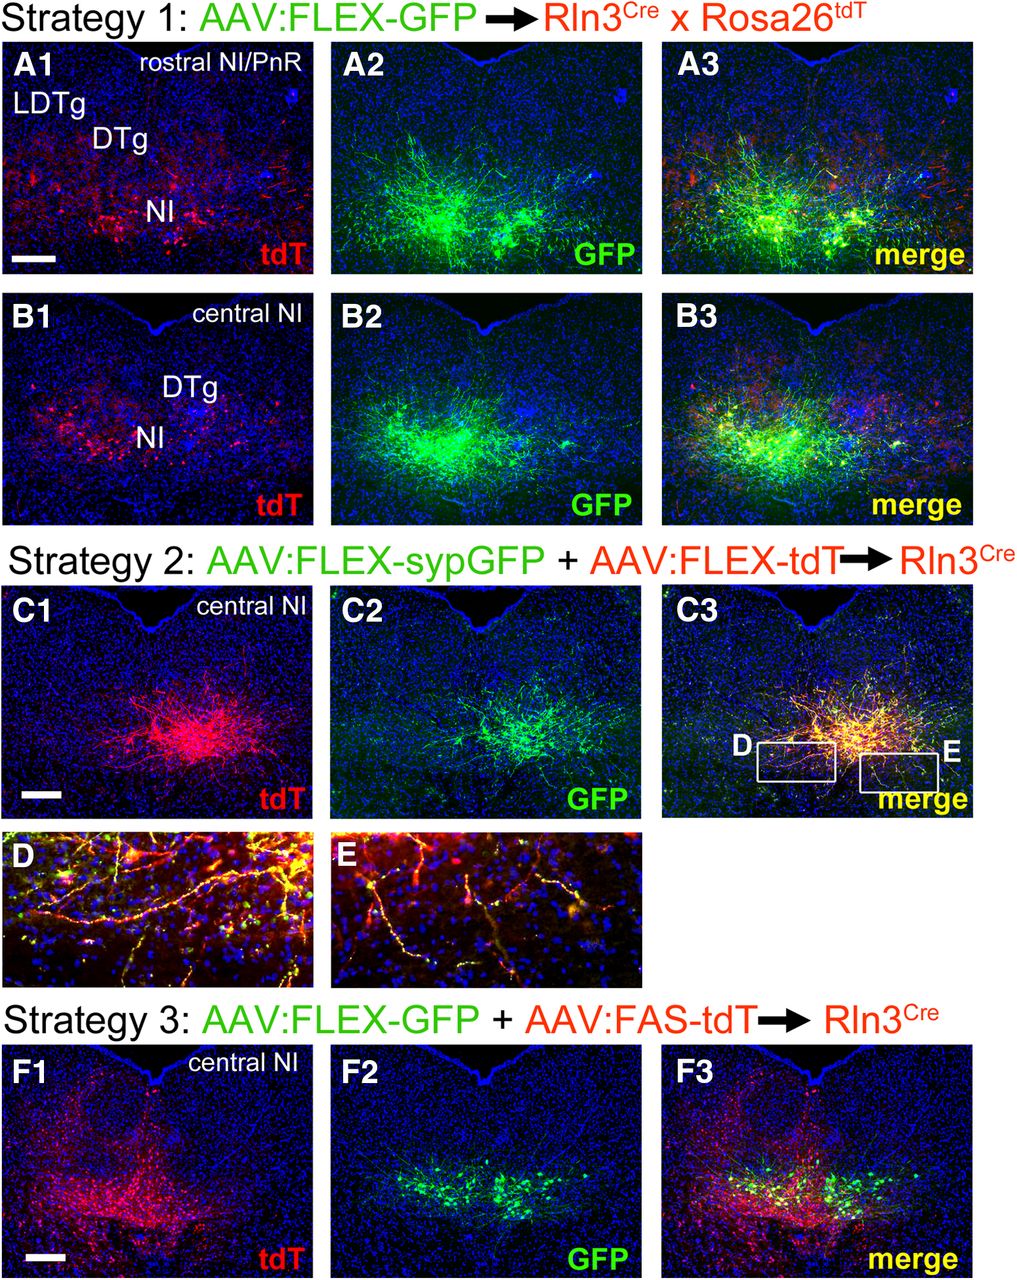
Anterograde viral labeling strategies for the projections of NI/Rln3 neurons. A, B, Injection of AAV:FLEX-GFP into Rln3Cre mice bearing the Gt(ROSA)26-targeted tdTomato reporter allele Ai14. A1,B1, tdTomato signal; A2,B2, GFP signal; A3,B3, merged image. This genetic labeling of Rln3tdT neurons allows assessment of the efficiency of viral labeling. The injected AAV efficiently labels the entire rostrocaudal extent of the NI, with labeling predominantly on the left. Targeted coordinates: AP: −5.40, ML: 0.10, DV: 3.95. Anterograde tracing data appear in Figures 8, 9. C–E, Co-injection of AAV:FLEX-sypGFP and AAV:FLEX -tdTomato into Rln3Cre mice. Expression is largely restricted to the right side. C1, tdTomato signal; C2, GFP signal; C3, merged image. In D, E, individual labeled fibers can be seen in red, with presumptive synaptic areas labeled in green. Targeted coordinates: AP: −5.40, ML: 0.10, DV: 4.15. Anterograde tracing data appear in Figures 10, 11. F, Injection of AAV:FLEX-GFP and AAV:FAS-tdTomato into Rln3Cre mice. F1, tdTomato signal; F2, GFP signal; F3, merged image. In this “Cre-on, Cre-off” strategy, the expression cassette in the FAS-tdTomato virus is inactivated rather than activated by Cre recombinase. This allows the specific labeling of the Rln3Cre -negative neurons in the injected area, and allows the efferents of the Cre-expressing and Cre-non-expressing NI neurons to be distinguished. Labeling of Rln3Cre neurons is bilateral, but labeling of the surrounding area with FAS-tdT is more extensive on the left. In some Cre-expressing neurons, the inactivation of FAS-tdT was incomplete, and these neurons appear yellow in the merged version. Targeted coordinates: AP: −5.40, ML: 0.10, DV: 4.15. Anterograde tracing data appear in Figure 12. DTg, dorsal tegmental nucleus; LDTg, laterodorsal tegmental nucleus; NI, nucleus incertus. Scale bar: 200 μm.
- Figure 8.
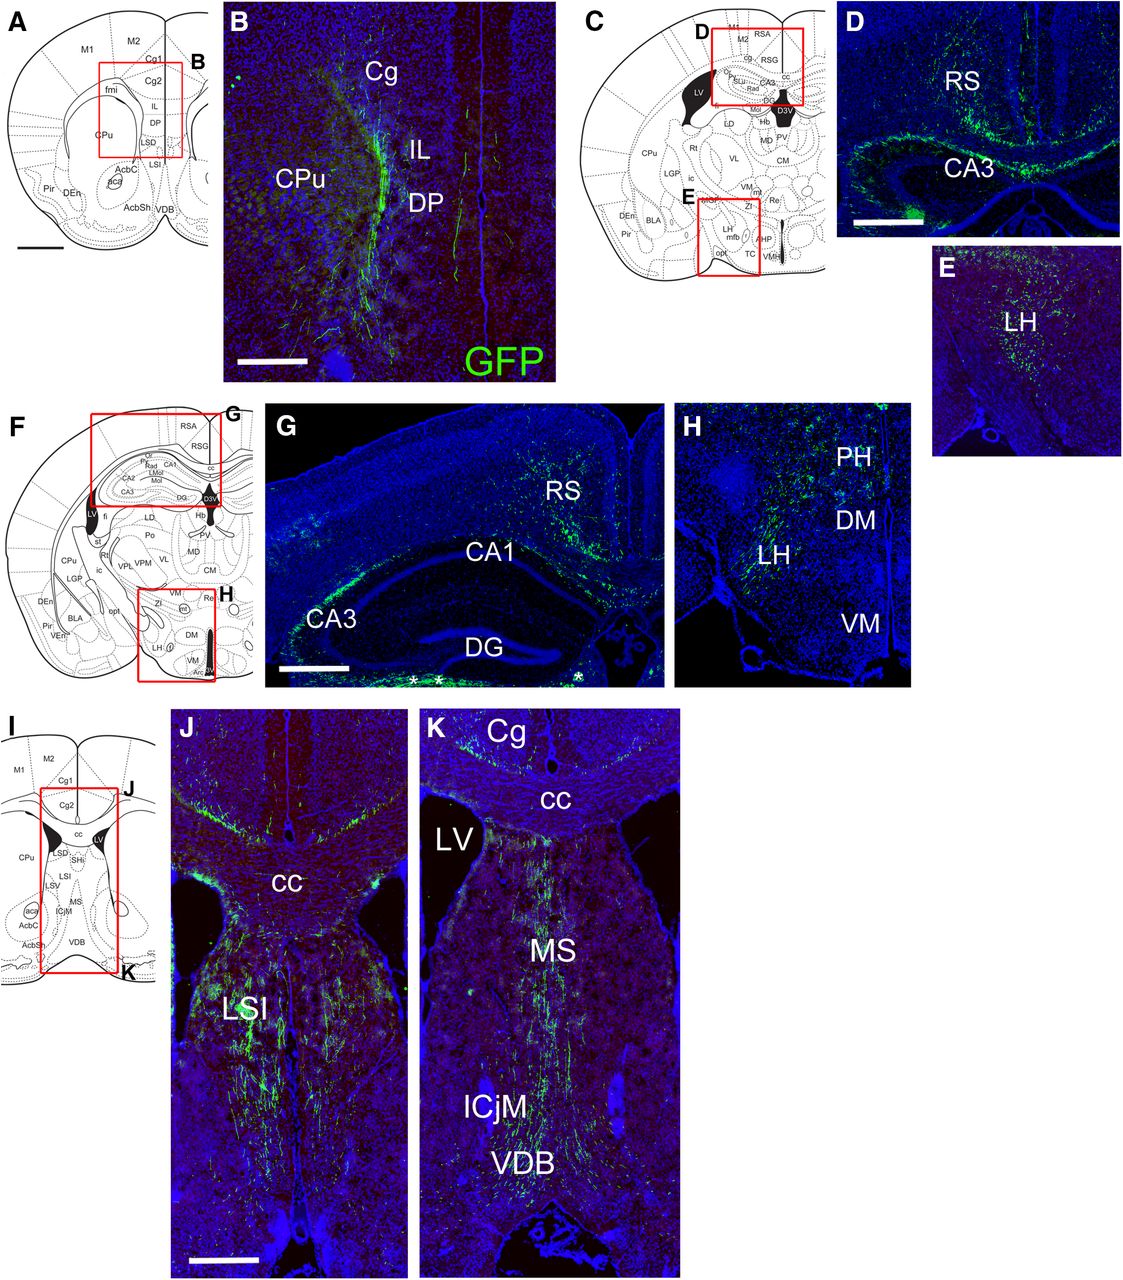
Projections of NI/Rln3 neurons to the rostral CNS using AAV: FLEX-GFP. The injected area appears in Figure 7A,B. A, B, Labeled fibers appear in the prelimbic and cingulate cortex, at a level corresponding to bregma 1.34 in a standard atlas (Paxinos and Franklin, 2001). C, E, Fibers in the RS and hippocampus (D) and the rostral LH (E), bregma −1.06. F, H, Labeled fibers in the RS and hippocampus (F) and caudal LH (H), bregma −1.70. I, K, Fibers in the septum and diagonal band, bregma 0.98. Because of the tilt of the sections, (J) corresponds to the dorsal level of the schematic, and (K) corresponds to the ventral level of the schematic. CA1, CA3, hippocampal regions CA1, CA3; cc, corpus callosum; Cg, cingulate cortex; CPu, caudate/putamen; DG, dentate gyrus; DM, dorsomedial hypothalamus; DP, dorsal peduncular cortex; ICjM, islands of Calleja; IL, infralimbic cortex; LH, lateral hypothalamus; LSI, lateral septal nucleus, intermediate part; LV, lateral ventricle; MS, medial septum; PH, posterior hypothalamus; RS, retrosplenial cortex; VDB, ventral diagonal band; VM, ventromedial hypothalamus. Scale bars: 1 mm (A, C, F, I) and 500 μm (B, D, G, J).
- Figure 9.
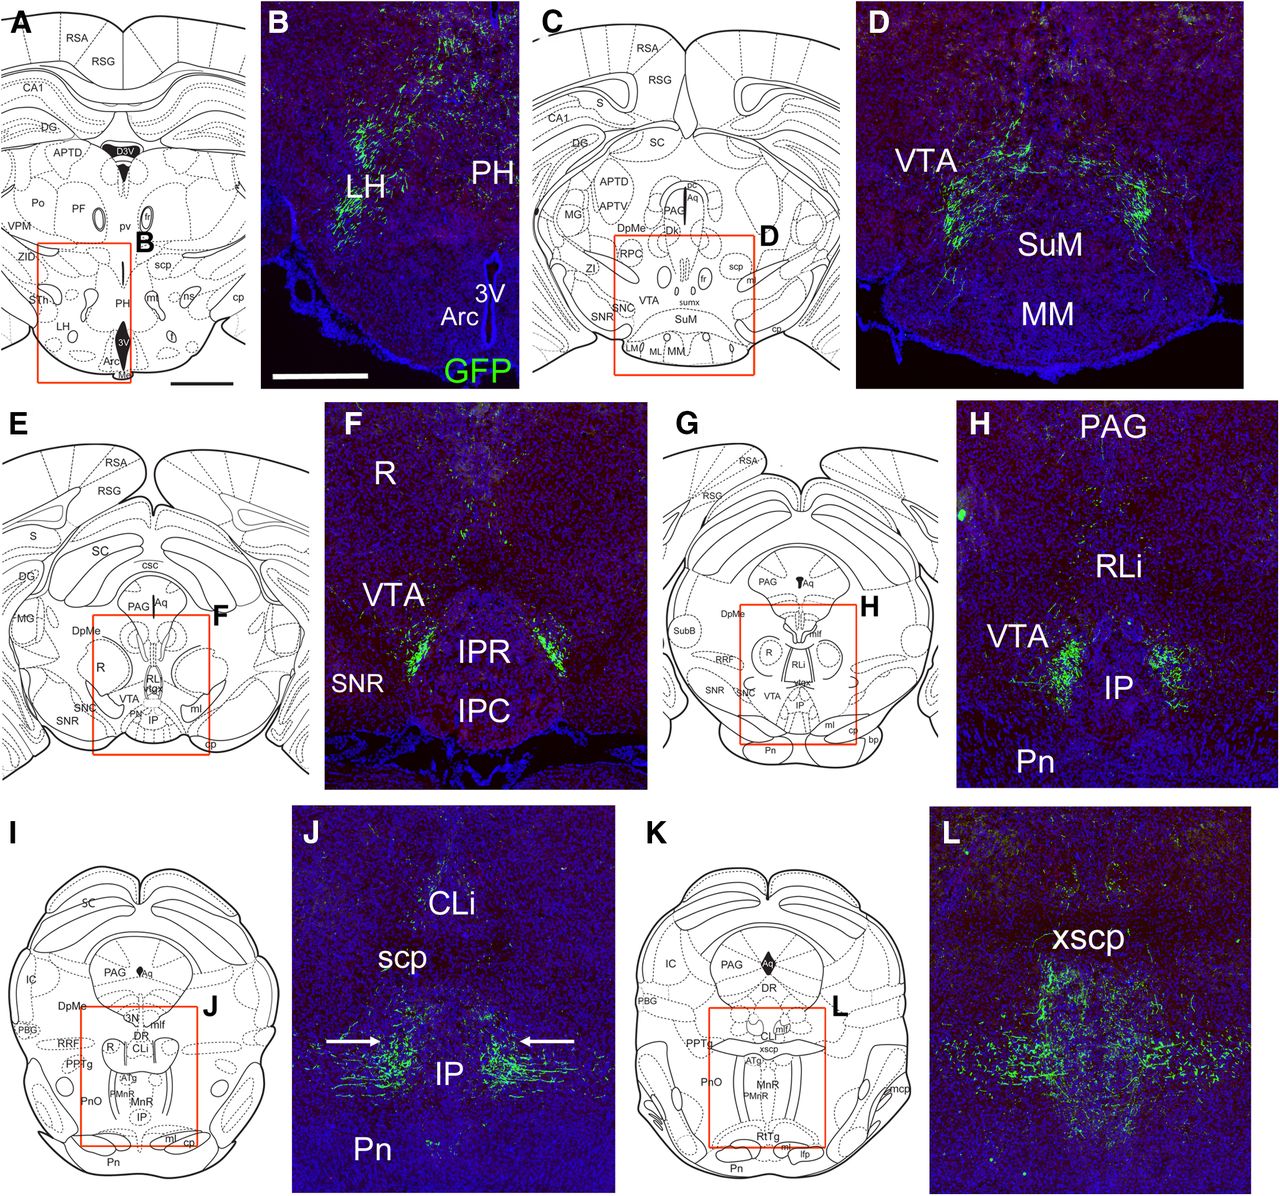
Projections of NI/Rln3 neurons to the mesopontine tegmentum and raphe using AAV:FLEX-GFP. A, B, Labeled fibers in the LH and PH, at a level corresponding to bregma −2.30 in a standard atlas. C, D, Fibers in and near the VTA, bregma −2.92. E, F, Fibers in the tegmentum, adjacent to the rostral interpeduncular nucleus, bregma −3.28. G, H, Projections in the tegmentum, adjacent to the caudal interpeduncular nucleus, bregma −3.40. I, J, Fibers in the tegmentum, adjacent to the rostral median raphe, bregma −3.88. At this level, fibers of the ascending NI tract in the pontine reticular nucleus (PnO) move toward the midline (arrows). K, L, Fibers in the median raphe and PnO, bregma −4.48. 3V, third ventricle; Arc, arcuate nucleus; CLi, caudal linear nucleus of raphe; IP, interpeduncular nucleus: IPC, caudal part; IPR, rostral part; LH, lateral hypothalamus; MM, medial mammillary nucleus; PAG, periaqueductal gray; PH, posterior hypothalamus; Pn, pontine nucleus; PnO, pontine reticular nucleus; R, red nucleus; RLi, rostral linear nucleus of raphe; scp, superior cerebellar peduncle; SnR, substantia nigra, pars reticulata; SuM, supramammillary nucleus; VTA, ventral tegmental area; xscp, decussation of the superior cerebellar peduncle. Scale bar: 1 mm (A) and 500 μm (B).
- Figure 10.
Projections of NI/Rln3 neurons to the rostral CNS using co-injection of AAV:FLEX-sypGFP and AAV:FLEX-tdTomato. The injected area appears in Figure 7C–E. A–C, Fibers and sparse presumptive synapses in the olfactory area (B), and in the cingulate cortex (C1-3), at a level corresponding to bregma 2.2 in a standard atlas. D–F, Fibers and sparse synapses in the rostral septum (E) and claustrum (F), bregma 1.54. G–I, Fibers and synapses in the medial and lateral septum, bregma 1.18. J–M, Fibers and synapses in the MS (K), diagonal band (L), and claustrum (M), bregma 0.98. N–Q, Fibers and synapses in the lateral preoptic nucleus (O), cingulate cortex (P), and caudal septum (Q), bregma 0.02. (R–T) Fibers and synapses in the cingulate cortex (S) and LH (T), bregma −0.70. Cg, cingulate cortex; Cl, claustrum; CPu, caudate/putamen; DG, dentate gyrus; DM, dorsomedial hypothalamus; DP, dorsal peduncular cortex; f, fornix; gcc, genu of the corpus callosum; LH, lateral hypothalamus; LPO, lateral preoptic area; LS, lateral septum, LSD, dorsal part, LSI intermediate part; MS, medial septum; VDB, ventral diagonal band; VM, ventromedial hypothalamus. Scale bars: 1 mm (all atlas views) and 200 μm (all fluorescence views).
- Figure 11.
Projections of NI/Rln3 neurons to the mesopontine tegmentum and raphe using co-injection of AAV:FLEX-sypGFP and AAV:FLEX-tdTomato. A–D, Fibers and presumptive synapses in the LH (B) and hippocampus (C), at a level corresponding to bregma −1.70 in a standard atlas. Projections were not detectable in the medial or lateral habenula (D). E–G, Fibers and projections in the caudal part of the LH and the PH (F) and the RS (G), bregma −2.70. H, I, Fibers of passage lying between the interpeduncular nucleus and ventral tegmental nucleus, bregma −3.40. The label is very sparse within the IP and VTA. Green signal in the red nucleus is an autofluorescence artifact. J, K, Fibers and synapses in the rostromedial tegmental nucleus, adjacent to the caudal part of the interpeduncular nucleus, bregma −3.88. Signal in the red nucleus in K is autofluorescence. L–N, Fibers and synapses in the median raphe/paramedian raphe (M) and PAG (N), bregma −4.16. O, P, Fibers and synapses in the MnR/PMnR, and the pontine reticular nucleus, bregma −4.72. At this level, ascending projections of NI/Rln3 neurons run in the plane of section from a lateral tract in PnO to a more medial tract, to eventually reach the position adjacent to IP shown in I, K. Sparse synapses are also observed in the dorsal raphe. Q–S, Fibers and synapses in the DR (R), MnR/PMnR, and PnO (S), bregma −4.96. Sections caudal to this level are included in the images of the injection site. 3, oculomotor nucleus; ATg, anterior tegmental nucleus, also identified as the caudal RMTg (Quina et al., 2015); CA1, CA1 of hippocampus: oriens layer, Or, pyramidal layer, Py, stratum radiatum, Rad; DR, dorsal raphe, DRD, dorsal part, DRI, interfascicular part; IP, interpeduncular nucleus: IPC, caudal part; IPDL, dorsolateral part, IPL, lateral part, IPR, rostral part; LH, lateral hypothalamus; LHb, lateral habenula; mfb, medial forebrain bundle; MHb, medial habenula; mlf, medial longitudinal fasciculus; PAG, periaqueductal gray; PH, posterior hypothalamus; MnR, median nucleus raphe; PMnR, paramedian nucleus raphe; PnO, pontine reticular nucleus; R, red nucleus; RMTg, Rostromedial tegmental nucleus; RS, retrosplenial cortex; SuMM, supramammillary nucleus, median part; VTA, ventral tegmental area; xscp, decussation of the superior cerebellar peduncle; ZI, zona incerta. Scale bars: 1 mm (all atlas views) and 200 μm (all fluorescence views).
- Figure 12.
Projections of NI Rln3-positive and Rln3-negative neurons using co-injection of AAV:FLEX-GFP and AAV: FAS-tdTomato. The injected area appears in Figure 7F. A, B, Projections to the limbic cortex and rostral septum, at a level corresponding to bregma 1.54 in a standard atlas. C, D, Projections to the MS and ventral diagonal band, bregma 0.98. In B, D, it appears that fibers of Rln3(+) and Rln3(−) neurons project to the ventral parts of the septum, but only Rln3(+) neurons project to the dorsal septum and limbic cortex. E–H, Projections to the RS and hypothalamus, bregma −1.22. Only Rln3(+) neurons appear to project to the RS (F); Rln3(−) neurons appear to innervate a unique territory in the medial thalamus (G); Rln3(+) and Rln3(−) neurons both innervate the LH/medial forebrain bundle (H). I, J, Projections to the caudal hypothalamus, bregma −2.70. Fibers from Rln3(−) neurons predominate in the LM, while Rln3(+) and Rln3(−) neurons both innervate the LH and PH. K, L, Projections to the area at the transition from the caudal LH to the rostral VTA, bregma −3.08. Fibers from Rln3(+) and Rln3(−) neurons have a similar distribution. Fibers of passage may predominate here since synaptic labeling of the VTA from Rln3(+) neurons is sparse (Fig. 11I). M, N, Projections to the caudal midbrain tegmentum, bregma −3.88. Rln3(+) and Rln3(−) neurons both innervate the rostromedial tegmental nucleus, while only projections of Rln3(−) neurons terminate within the interpeduncular nucleus. NI fibers are sparse in the VTA at this level. O, P, Projections to the raphe, bregma −4.72. Fibers from Rln3(+) neurons predominate in the pontine reticular nucleus; fibers of both Rln3(+) and Rln3(−) neurons are found in the MnR/PMnR, but in a somewhat different distribution in this diverse area. The rhabdoid nucleus is innervated exclusively by Rln3(−) neurons. Fibers from Rln3(−) neurons can also be seen ascending more dorsally in the mlf. Q, R, Projections to the IO, bregma −7.46. Labeled fibers are seen only in the dorsal, central part of the IO, and originate exclusively in Rln3(−) neurons. AcbSh, accumbens nucleus, shell; CA1, CA1 of hippocampus; CPu, caudate/putamen; DR, dorsal raphe, DRD, dorsal part; DRI, interfascicular part; DTT, dorsal tenia tecta; fmi, forceps minor of the corpus callosum; IOC, inferior olive, central part; IOD, inferior olive, dorsal part; IP, interpeduncular nucleus: IPC, caudal part; IPDL, dorsolateral part, IPI, intermediate part, IPL, lateral part, IPR, rostral part; ipf, interpeduncular fossa; LH, lateral hypothalamus; LM, lateral mammillary nucleus; LSI, lateral septal nucleus, intermediate part; mfb, medial forebrain bundle; MGP, medial globus pallidus; mlf, medial longitudinal fasciculus; MS, medial septum; MnR, median nucleus raphe; opt, optic tract; PH, posterior hypothalamus; PMnR, paramedian nucleus raphe; PnO, pontine reticular nucleus; PrL/IL, prelimbic/infralimbic cortex; Rbd, rhabdoid nucleus; RMTg, Rostromedial tegmental nucleus; ROb, raphe obscurus nucleus; RSA, retrosplenial agranular cortex; RSG, retrosplenial granular cortex; SuM, supramammillary nucleus; VDB, ventral diagonal band; VTA, ventral tegmental area; VTg, ventral tegmental nucleus; xscp, decussation of the superior cerebellar peduncle. Scale bars: 1 mm (all atlas views) and 200 μm (all fluorescence views).
- Figure 13.
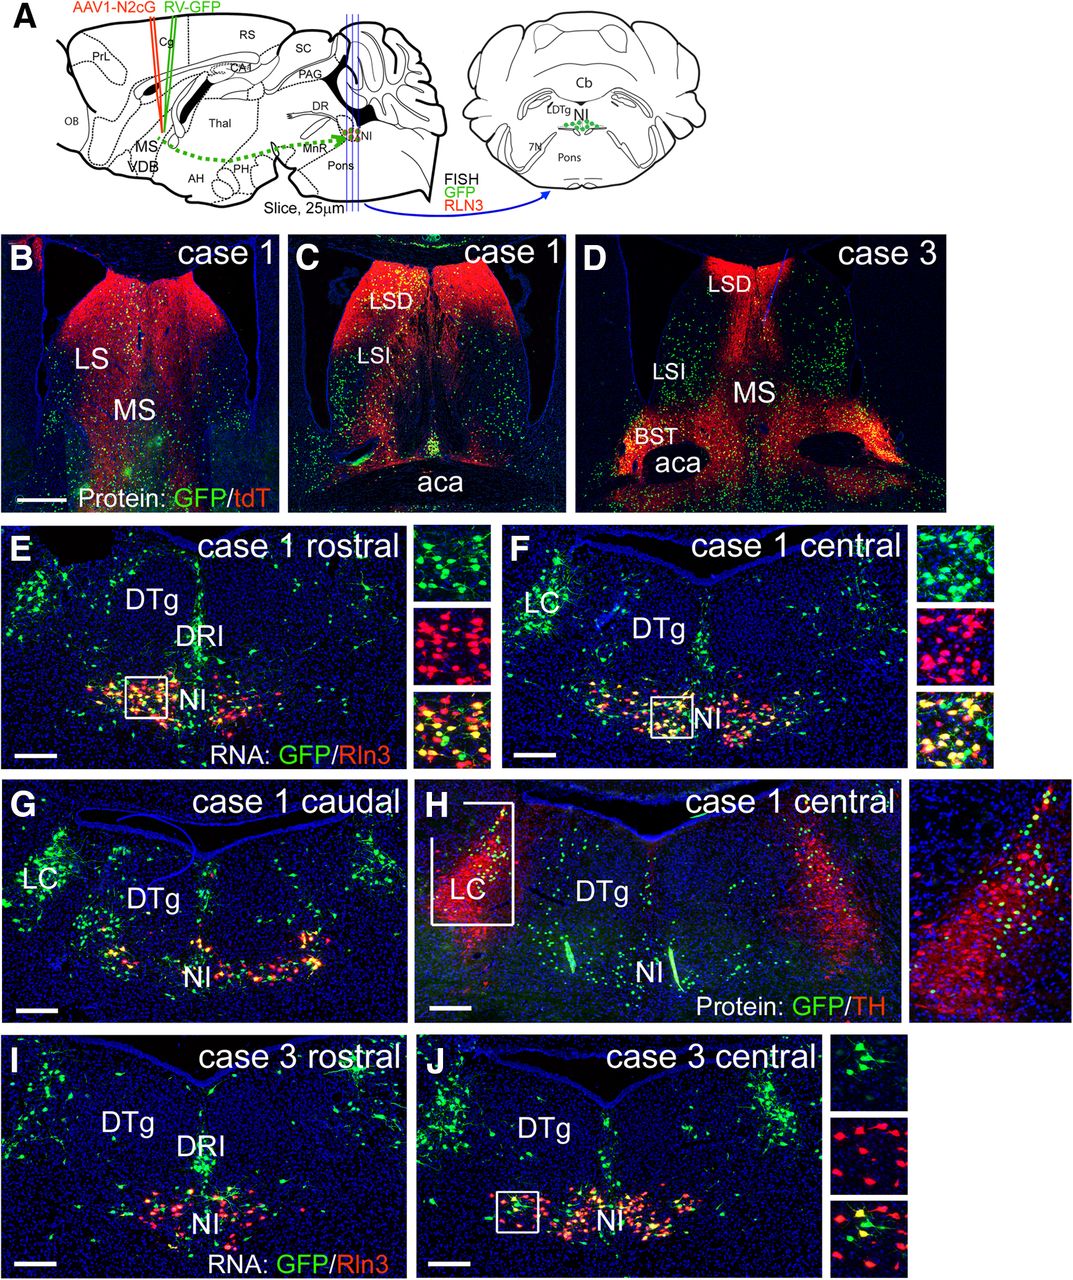
Transsynaptic tracing of the NI projection to GABAergic neurons in the septum. A, Strategy for the transsynaptic labeling of the NI projection to GABAergic neurons in the septum (Materials and Methods). Results from two out of six injected cases are shown. B, C, Injected area from case 1, shown in sections corresponding to bregma 0.74 (B) and bregma 0.14 (C) in a standard atlas. D, Injection case 3, corresponding to bregma 0.38. E–G, Sections through the rostral, central, and caudal NI from case 1, showing the expression of endogenous Rln3 mRNA and RV-encoded GFP RNA using FISH. H, A section from the central NI in case 1 adjacent to (F) showing expression of endogenous tyrosine hydroxylase immunoreactivity and virally-encoded GFP protein expression. I, J, Sections through the NI in case 3, which exhibited sparser retrograde labeling in a pattern similar to Case1. aca, anterior commissure; BST, bed nucleus stria terminalis; DRI, dorsal raphe, interfascicular part; DTg, dorsal tegmental nucleus; LC, locus coeruleus; LS, lateral septum; LSD, dorsal part; LSI, intermediate part; MS, medial septum; NI, nucleus incertus. Scale bars: 400 μm (B) and 200 μm (E–J).
- Figure 14.
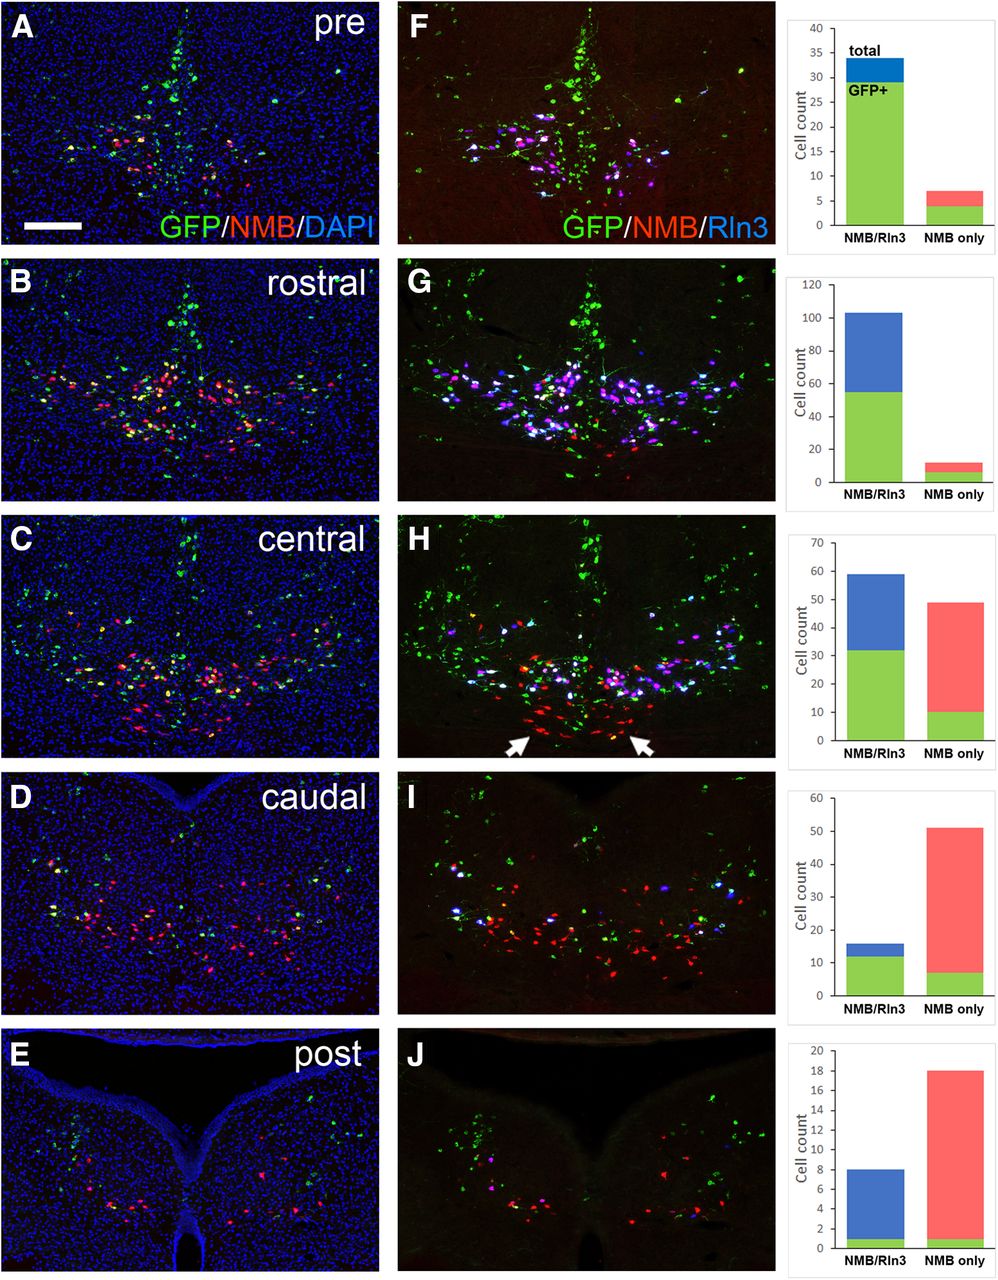
Transsynaptic retrograde labeling of NI Rln3/NMB and NMB-only neurons from the septum. Triple-label FISH for Rln3, NMB, and GFP mRNA was performed on a series of sections encompassing the NI and the areas immediately rostral (pre) and caudal (post) to the NI. Sections are from an extended series from the same injected case and adjacent to those shown in Figure 13E–G. Co-localization of mRNA signals was verified using confocal microscopy. GFP expression was assessed in Rln3/NMB and NMB-only neurons. Neurons expressing Rln3 alone were rarely observed. A–E, FISH for GFP and NMB, together with DAPI nuclear staining to show the anatomic localization of the sections. F–J, Images of the same sections shown in A–E with co-localization of Rln3, NMB, and GFP, and cell counts for the expression of GFP in the Rln3/NMB and NMB-only populations. NMB-only neurons are concentrated at the midline of the central NI (arrows, H) and in the caudal part of the nucleus (I, J), and are less likely at all levels to be labeled by RV-GFP from septal projections. Scale bar: 200 μm.


Tables
Area Abbreviation sypGFP Reference Olfactory area Anterior olfactory n. AO + Figure 10B Telencephalon Cerebral cortex Cingulate cortex Cg ++ Figure 10C,P,S Claustrum Cl + Figure 10F,M Dorsal peduncular cortex DP + Figure 10I Infralimbic cortex IL + Orbital cortex, medial MO + Prelimbic cortex Prl + Figure 10C Retrosplenial cortex RS ++ Figure 11G Hippocampus CA1 field, oriens layer CA1 + Figure 11C CA2 field, oriens layer CA2 + Figure 11C CA3 field, oriens layer CA3 + Dentate gyrus DG + Striatum/pallidum Dorsal tenia tecta DTT ++ Figure 10E Nucleus diagonal band Horizontal limb HDB ++ Vertical limb VDB +++ Figure 10H,L Septum Lateral septal n., dorsal LSD + Figure 10 I,Q Lateral septal n., intermediate LSI ++ Figure 10H,L,Q Medial septal n. MS +++ Figure 10H,I,K Septofimbrial n. SFi + Triangular septal n. TS + Diencephalon Thalamus Zona incerta ZI + Figure 11B Hypothalamus Lateral hypothalamic area LH +++ Figures 10T, 11B,F Posterior hypothalamic area PH ++ Figure 11F Preoptic area, lateral LPO +++ Figure 10O Supramammillary n. SuM + Mesencephalon Dorsal raphe n., dorsal part DRD + Figure 11R Dorsal raphe n., inferior part DRI ++ Figure 11P,R,S Interpeduncular nucleus1 IP +/− Figure 11I,K Rostromedial tegmental n.2 RMTg +++ Figure 11K Ventral tegmental area3 VTA +/− Figure 11I,K Periaqueductal gray PAG + Figure 11N Rhombencephalon Central gray, pontine PnO ++ Figure 11M,P,S Median raphe n. MnR + Figure 11M,P,S Nucleus incertus (cell bodies) NI/O +++ Figure 7 Paramedian raphe n. PMnR +++ Figure 11M,P,S Anterior tegmental n.4 (caudal RMTg) ATg ++ Figure 11M The NI of Rln3Cre mice was injected with a mixture of Cre-dependent AAV-expressing sypGFP and tdT as shown in Figure 7, strategy 2. The summary is based on the case appearing in Figures 10, 11, but further supporting data were derived from the case shown in Figures 12, 13, and injected cases not shown. The density of afferents from the NI was scored from + to +++ based on the appearance of punctate sypGFP fluorescence, which is consistent with presynaptic labeling. The designation +/− is reserved for areas in which tdT-labeled fibers were observed, but little or no sypGFP, suggesting labeled fibers of passage. No consistent Rln3Cre -dependent labeling was observed in areas caudal to the pons.
↵1 Labeled fibers appear immediately adjacent to the IP, but little synaptic labeling is seen within the nucleus.
↵2 The rostromedial tegmental nucleus is not defined in standard atlases (Paxinos and Franklin, 2001) but resides just dorsolateral to the IP; this area is known to send GABAergic input to the VTA (Quina et al., 2015).
↵3 sypGFP labeling is defined within the VTA as anatomically defined, but it does not appear adjacent to DA neurons in this area.
↵4 The area defined as the anterior tegmental nucleus in standard atlases has been shown to contain neurons with similar properties to the RMTg, and has been labeled the caudal RMTg (cRMTg, Quina et al., 2015).
In this issue


