

Article Figures & Data
Figures
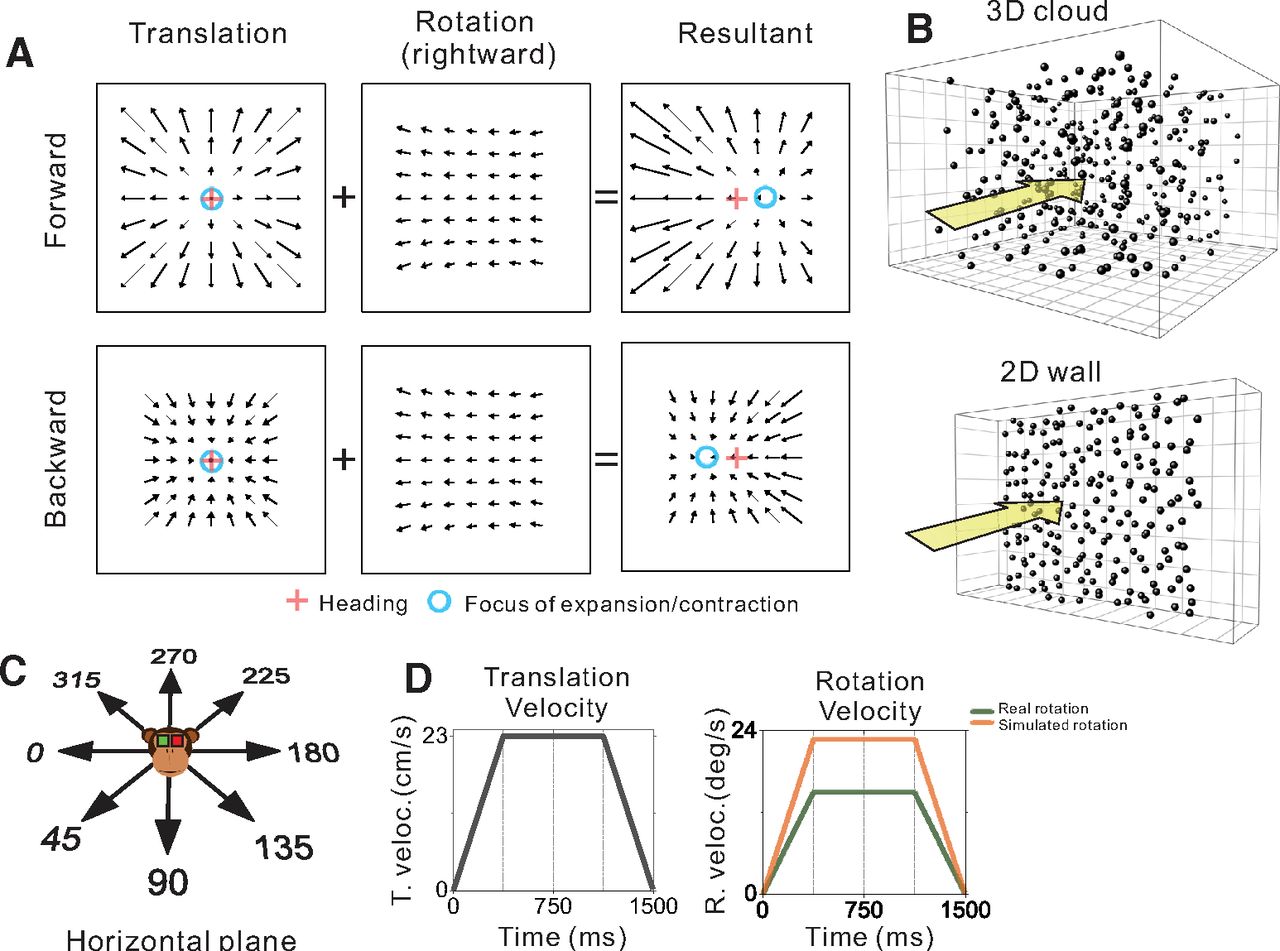
- Figure 1.
Schematic illustration of optic flow and experimental stimulus manipulations. A, Optic flow patterns during self-motion shown under planar image projection. Pure translation (left) produces a radial expansion (upper) or contraction (lower) flow field for forward and backward headings, respectively. When a flow field produced by horizontal eye rotation (middle) is added, the FOE shifts in the direction of eye rotation for forward headings and the FOC shifts in the direction opposite to eye rotation during backward headings (right). B, The virtual environment was either a 3D cloud of dots (top) or a 2D frontoparallel plane (bottom). C, Real and simulated translation was presented in eight equally-spaced directions within the horizontal plane. D, The velocity profiles for translation (left) and rotation (right) were constant during the middle 750 ms, which defined the analysis window.
- Figure 2.
Quantifying the effect of eye rotation on heading tuning curves. A–C, Schematic illustration of possible effects of eye rotation. Black curves represent responses to pure translation. Red and blue curves represent responses to combinations of translation and either rightward or leftward rotation, respectively. A, Schematic illustration of complete compensation for eye rotations. B, Schematic tuning of a cell with a forward heading preference (90°) that does not compensate for rotation, producing shifts of the peak and trough of the tuning curve in opposite directions. C, Schematic tuning of a cell with a lateral heading preference (180°, leftward) that does not compensate for rotation resulting in changes in tuning bandwidth without a shift in the heading preference. D–F, Illustration of steps in the computation of partial shifts. D, Tuning curves from a neuron responding to simulated translation and simulated rotation in the 2D environment. E, Both tuning curves are linearly interpolated and the translation+rotation tuning curve (blue) is vertically scaled and shifted to match the range of responses in the pure translation curve (black). F, Dashed lines indicate circularly shifted segments of the pure translation tuning curve that minimize the sum of squared error in each half of the translation+rotation tuning curve (0:180°, 180:360°). Partial shifts are indicated with arrows. Panels B, C, F show that the expected direction of the shift for each tuning curve half does not depend on heading preference.
- Figure 3.
Example eye velocity traces and neural response histograms. Data were obtained during a recording from a single MSTd neuron (same cell as in Fig. 4C) in response to simulated translation in the 3D environment, combined with either real or simulated rotation. Vertical reference lines mark the start and end of the translation and rotation stimuli, while the shaded region indicates the analysis window. The animal maintained fixation of a target against a dark background for 500 ms preceding and 300 ms following the stimulus presentation. A, Horizontal eye velocity traces from 160 individual trials (gray curves) are plotted along with average velocity traces for real and simulated rotations (solid and dashed thick curves, respectively) in left and right directions (blue and red, respectively). Eye position data were smoothed with a five-point moving average then differentiated. The resulting eye velocity signal was then smoothed with a five-point moving average. Saccades were identified by thresholding the acceleration signal; identified saccades were then removed and filled in by linear interpolation. The black, dashed line indicates target velocity. B–F, Peristimulus time histograms and spike rasters showing neural responses during five repetitions of the preferred heading (90°) for the translation-only condition and the four translation+rotation conditions. PSTH heights range from 0 to 18 spikes per bin.
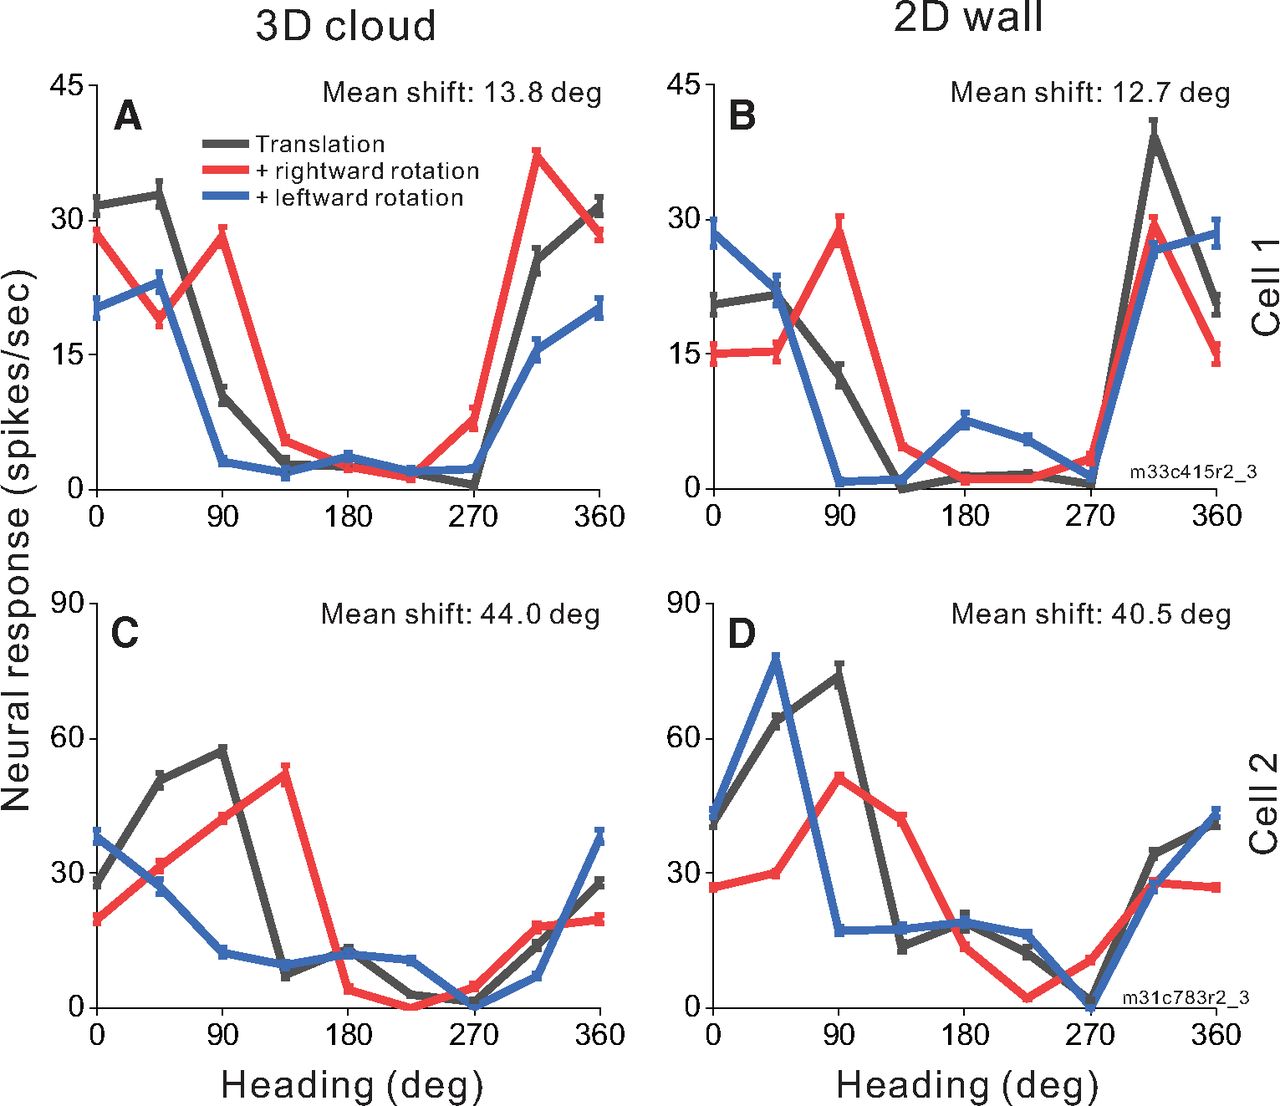
- Figure 4.
Heading tuning curves from two example MSTd neurons (rows) in the 3D and 2D environments (columns). A, B, Data from an MSTd neuron recorded during simulated translation and simulated eye rotation. Black curves show responses to pure translation during central fixation. Red and blue curves show responses to combinations of translation and rightward and leftward eye rotation, respectively. Error bars show standard errors of the mean. Mean shifts for the 3D cloud condition (A) and the 2D wall condition (B) are indicated above the respective tuning curves. C, D, Data from a second MSTd neuron, also during simulated translation and rotation.
- Figure 5.
Summary of effects of depth structure on rotation compensation of MSTd neurons. The mean tuning shift for each neuron in the 3D (x-axis) and 2D (y-axis) environments is shown for conditions involving simulated translation combined with either real rotation (green) or simulated rotation (orange; 88 pairs of average tuning shifts from N = 47 neurons). Circles and squares denote data for monkeys A and C, respectively. Error bars depict bootstrapped 95% confidence intervals for each neuron/condition. Shaded bars in the marginal histograms represent neurons with shifts that are not significantly different from zero.
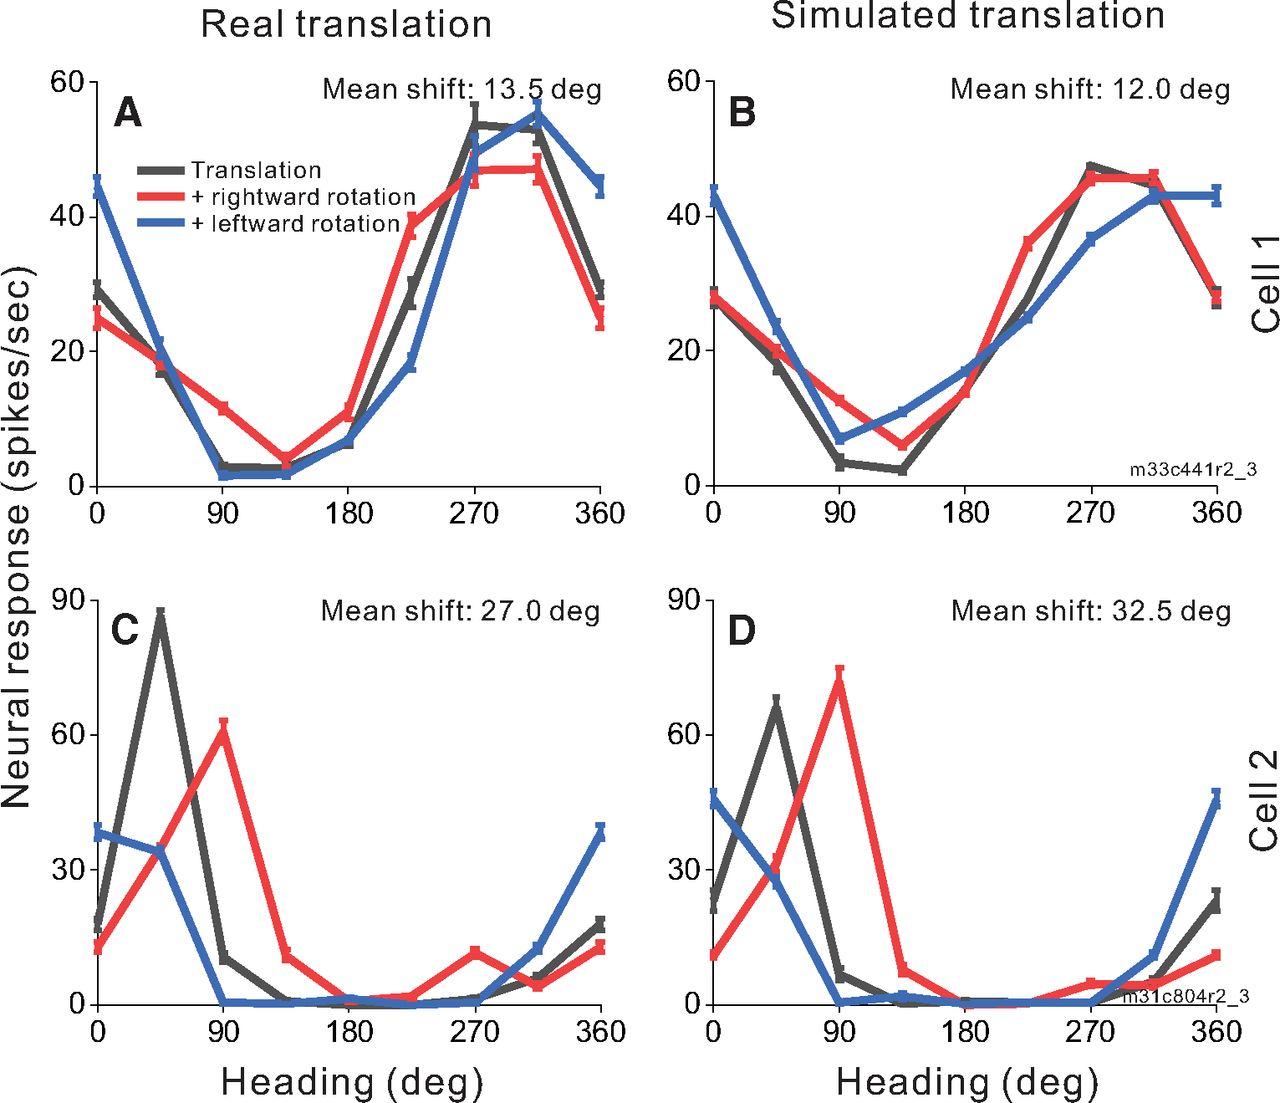
- Figure 6.
Heading tuning curves from two example MSTd neurons (rows) in the real and simulated translation conditions (columns). Figure conventions as in Figure 4. Both example cells were recorded during real translation (A, C) and simulated translation (B, D) combined with simulated eye rotation.
- Figure 7.
Summary of the effect of vestibular translation signals on rotation compensation for MSTd neurons. Tuning shifts are compared for real translation (x-axis) and simulated translation (y-axis) conditions. Data are shown separately for both real rotation (green) and simulated rotation (orange) conditions in the 2D wall environment (91 pairs of average shifts from N = 49 cells). Circles and squares denote data for monkeys A and C, respectively. Error bars depict bootstrapped 95% confidence intervals. Shaded bars in the marginal histograms represent cells with tuning shifts not significantly different from zero.
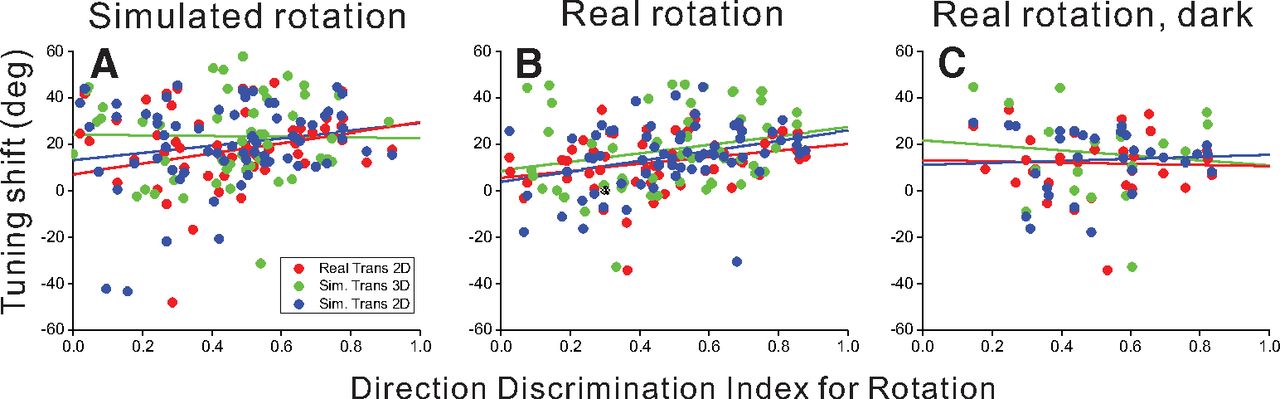
- Figure 8.
Summary of the relationship between rotation tolerance of heading tuning and selectivity for pure rotation. Rotation selectivity was quantified using a DDI (x-axis) and was compared with the mean shift (y-axis) for each cell. Data are shown separately for simulated rotation (A), real rotation across stationary background dots (B), and real rotation in darkness (C). Red, green, and blue points represent real translation in the 2D environment, simulated translation in the 3D environment, and simulated translation in the 2D environment, respectively. Trend lines show the least squares linear regression between DDI and mean shift for each condition (ANCOVA).
- Figure 9.
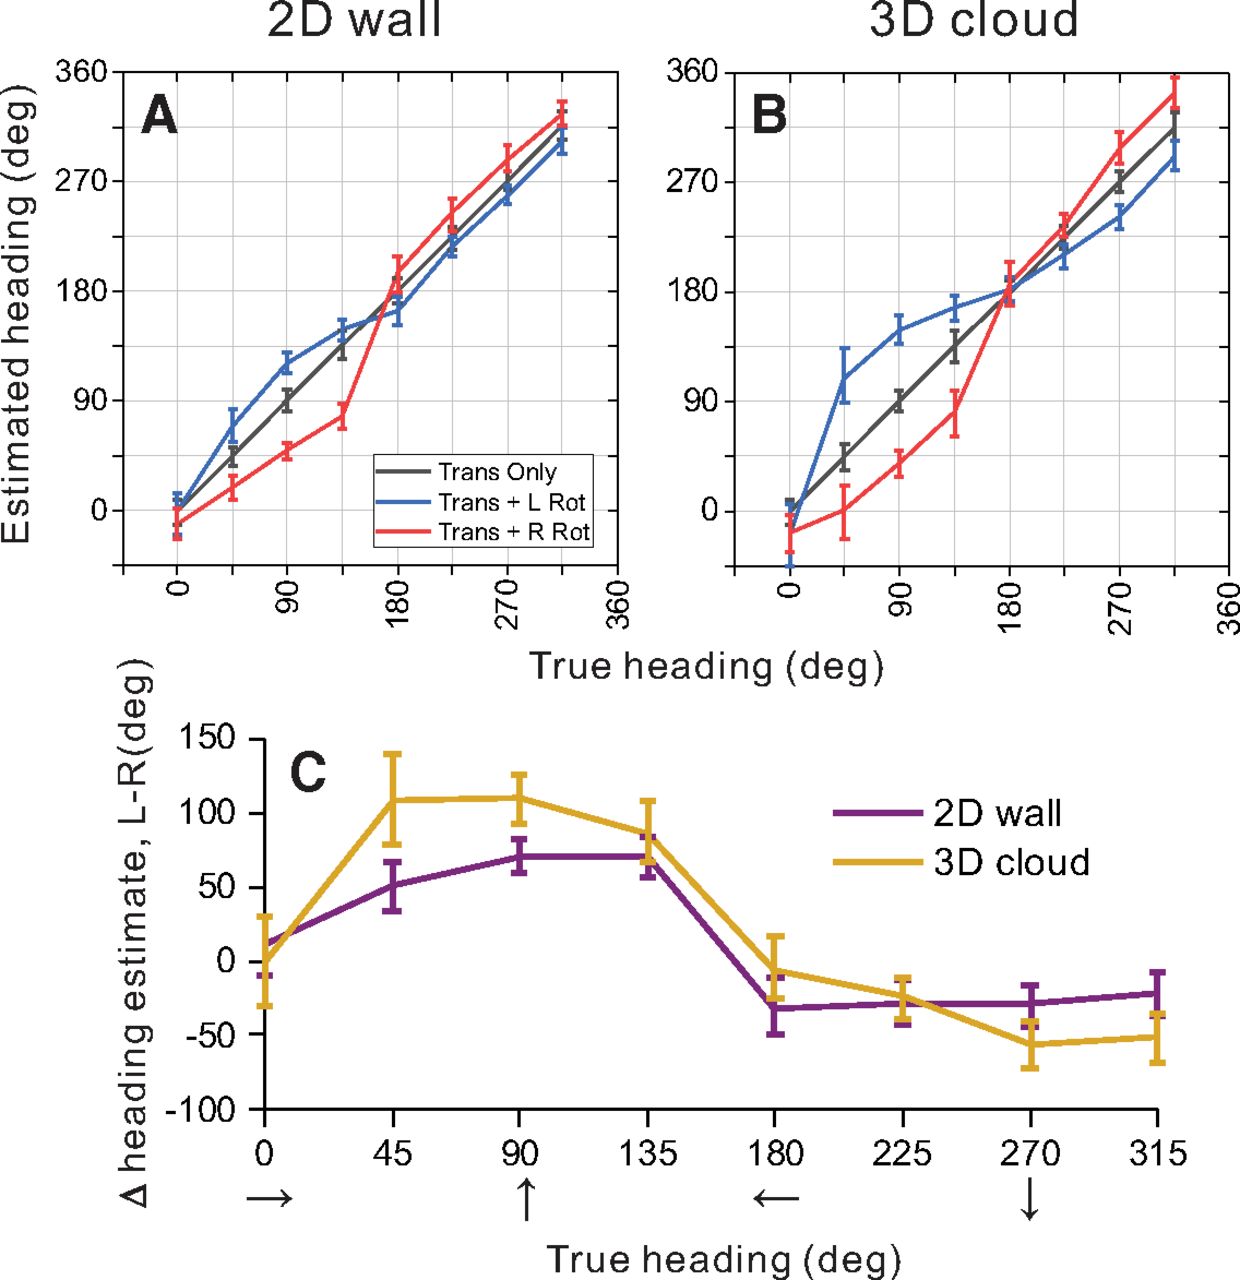
Summary of population decoding results for 2D and 3D environments. An OLE was used to decode heading from population responses to simulated translation and rotation conditions (see text for details). A, B, Weight vectors were computed separately for 2D (A) and 3D (B) environments from translation-only trials. Those weight vectors were then used to decode bootstrapped neural responses from translation-only (gray), translation plus rightward rotation (red), and translation plus leftward rotation (blue) conditions. Decoded heading estimates versus true headings are shown for the 2D (A) and 3D (B) environments. C, Estimated headings for rightward rotation conditions were subtracted from estimated headings for leftward rotation conditions, and this difference is plotted as a function of true heading. Results are shown separately for the 2D (purple) and 3D (gold) depth environments. Error bars in all panels show 95% confidence intervals.
- Figure 10.
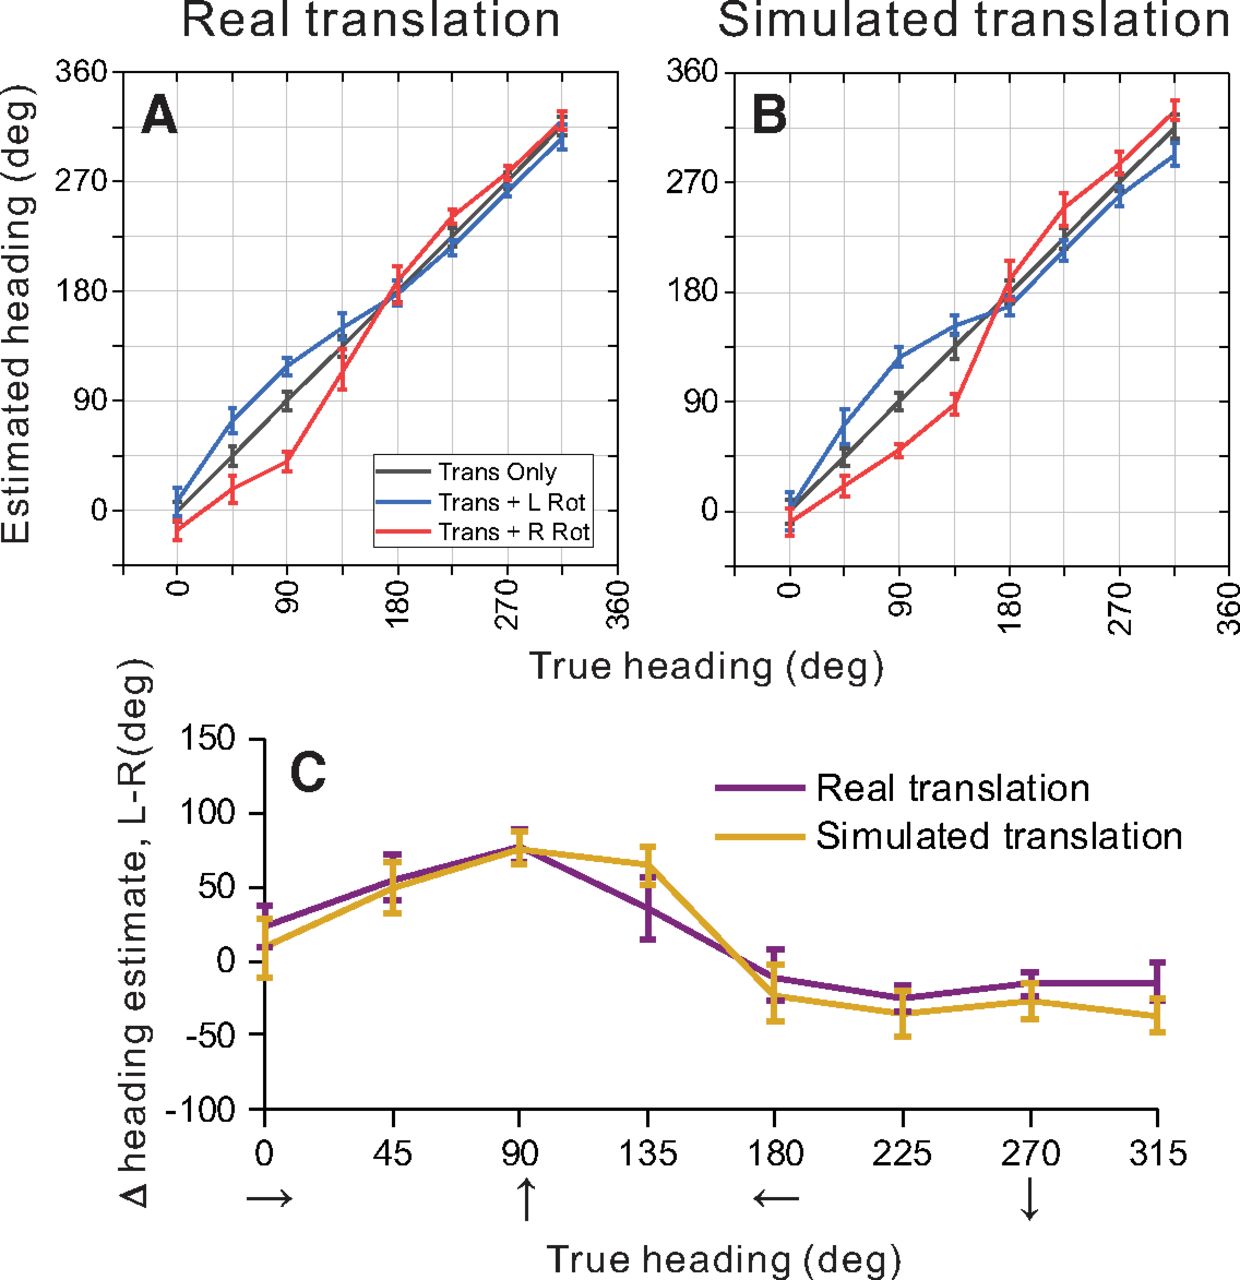
Summary of population decoding results for real versus simulated translation. A, B, Decoded heading estimates versus true headings are shown for the real and simulated translation conditions, respectively. C, Differential heading biases between rightward and leftward rotations are plotted as a function of true heading. Figure conventions as in Figure 9.


Tables
Parameter Lower bound Upper bound  (°)
(°)−360° 360° σuni, σbi (°) 0.5° 10° A (spk/s) 0 1.5 * response range g 0 1
(spk/s)0 Maximum response Δ (°) 130° 230°


In this issue


