

Article Figures & Data
Figures
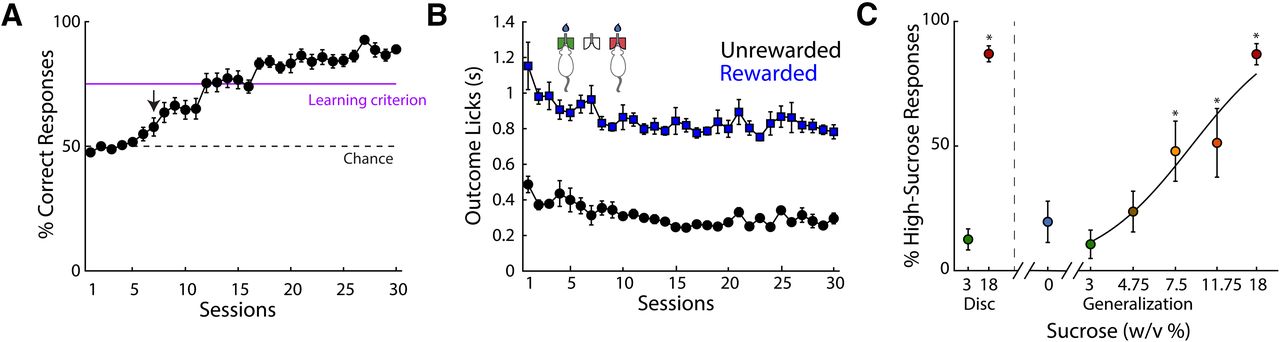
- Figure 2.
Subjects guide their decisions based on sucrose’s intensity. A, Performance of subjects across discrimination (disk) sessions. After seven sessions, their performance in distinguishing 3% and 18% sucrose was above chance level (dashed line), while learning criterion (purple line; ≥75% correct responses during four consecutive sessions) was reached in 19 ± 4 sessions. The arrow at day 7 indicates that performance was significantly different compared with day 1. B, Duration of lateral outcome epoch during rewarded (blue) and unrewarded (black) trials. From day 1, licking was significantly longer in rewarded than in unrewarded trials. C, Percentage of responses where the subject perceived a sucrose concentration as high, during discrimination (disk) trials on the left side of the dashed line and generalization trials from the vertical gray dashed line to the right side. The x-axis is scaled logarithmically. * Significantly different from 3%-discrimination trials. Data are presented as mean ± SEM. For other behavioral measurements that were not significantly affected by the sucrose concentration, see Extended Data Figure 2-1.
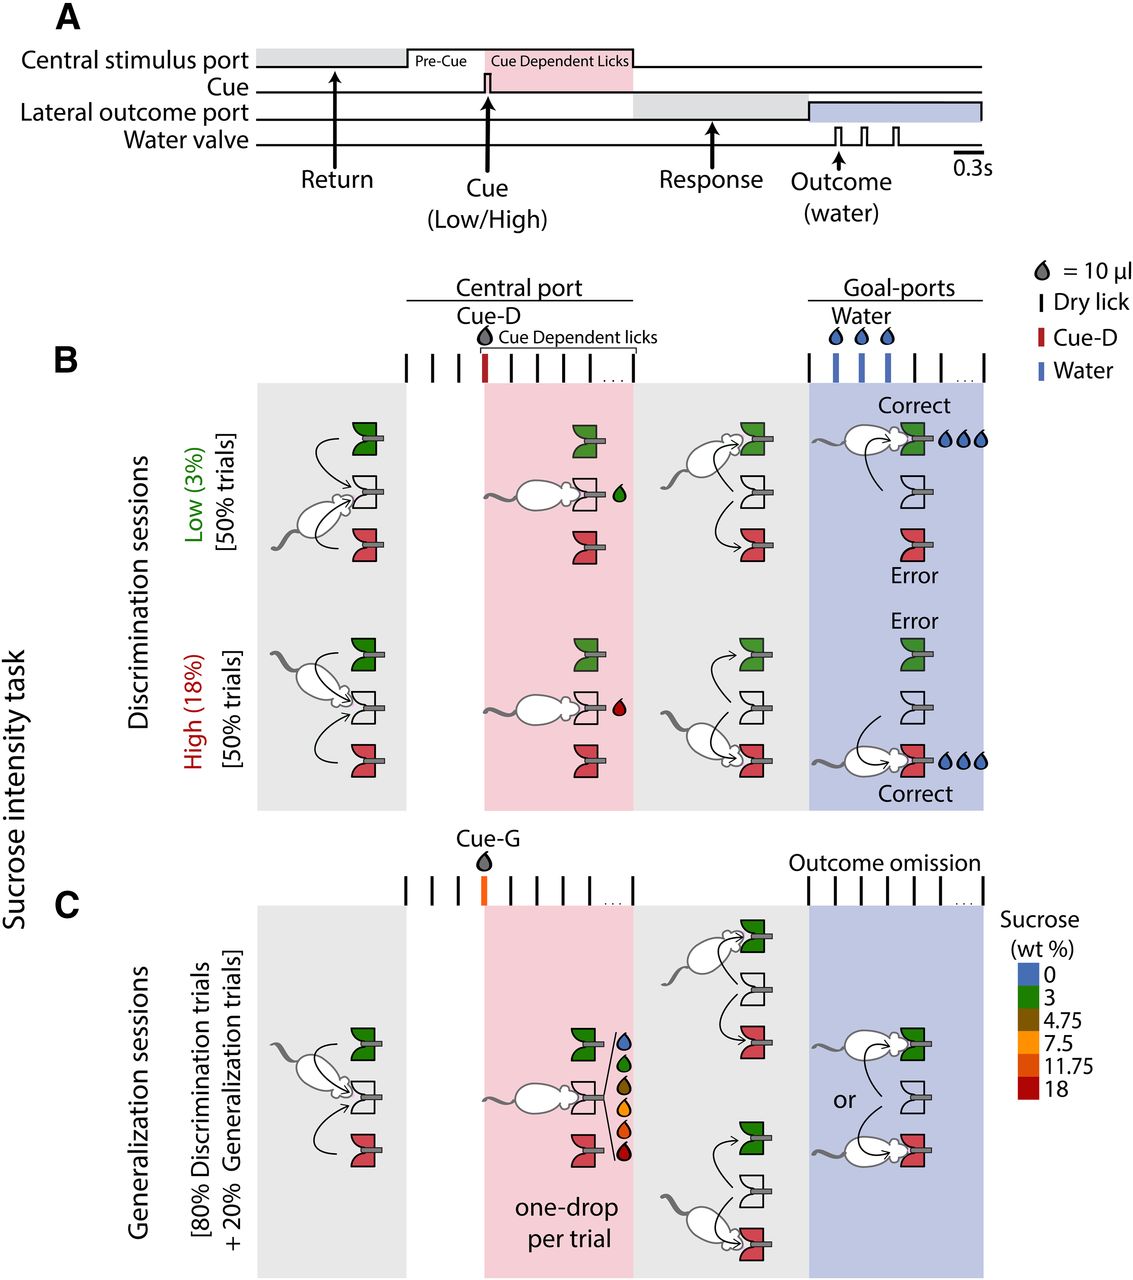
- Figure 1.
Structure of the sucrose intensity task. A, A schematic of the task that is comprised of discrimination (B) and generalization (C) sessions. B, During discrimination trials, the subjects moved toward the central port (return epoch) to lick and receive a single 10-μl drop of either a 3% sucrose-low (green) or 18% sucrose-high (red). The licks emitted in the central port comprise the cue epoch. The animals had to emit three dry licks before receiving the cue (pre-cue) and then produce CDL before detecting whether the concentration was high or low by going to the left side for a low concentration or to the right side for a high concentration (response epoch), counterbalanced across subjects. For making a correct response, and after one dry lick in the chosen lateral port, they would receive three drops of water. For incorrect choices, the trial was ended (outcome epoch). C, Generalization sessions were composed of 80% discrimination trials (cue-D) and 20% generalization trials (cue-G). The trial structure of generalization trials is the same as in discrimination, but with two main differences: (1) the subjects received one drop of either six sucrose concentrations (0%, 3%, 4.75%, 7.5%, 11.75%, 18%); and (2) no reward was given during the outcome epoch.
- Figure 3.
Devaluating sucrose’s hedonically positive palatability does not affect sucrose’s response to concentration (intensity). A, Timeline of the experimental design. After the animals were trained to identify sucrose concentrations, as shown in Figures 1, 2 (discrimination disk and generalization; pre-CTA), the subjects went through a sucrose devaluation procedure involving two consecutive CTAs. As a control, a baseline water consumption (blue bottle) was measured over 15 min. The next day after baseline testing for water, the animals were given 18% sucrose (red bottle) to consume, and 15 min later, they received an intraperitoneal injection of 0.2 m lithium chloride (LiCl), a visceral malaise agent [Acquisition of first CTA (Acq CTA-1)]. Then, after a recovery day, the subjects were again given 18% sucrose for 15 min to consume followed by the second injection of 0.2 m LiCl or saline (test 1 + CTA-2). After a recovery day, test 2 was performed by measuring the intake of 18% sucrose. After the CTA protocol, sucrose intensity task was re-evaluated (pre-CTA vs post-CTA, see C, D). Finally, a sucrose preference test was conducted using a two-bottle test to confirm that it remained aversive at the end of the experiments (for results, see Fig. 4). B, A histogram showing liquid intake for several of the epochs shown in dashed line expansion of A; 15 min after liquid intake, rats were injected with saline (open circle) or 0.2 m LiCl (black rectangles). Blue and red background shadows depict conditions where subjects had access to water and sucrose, respectively. The two upper arrows indicate the two test days where it can be seen that subjects developed CTA. * Significant differences between saline and LiCl groups. Data are shown as median ± iqr. C, Percentage of times the subject in the saline group classified a sucrose concentration as “high.” Performances obtained before and after CTA are represented by the open, and black filled circles, respectively. The dashed (pre-CTA) and solid (post-CTA) lines are the fitted sigmoid, respectively. The x-axis is scaled logarithmically. Data are presented as mean ± SEM. D, Same as in C but for rats injected with LiCl. These results suggest that sucrose’s intensity attribute is the main orosensory feature used by rats to solve the task. Extended Data Figure 3-1 shows values for the other behavioral measurements, and Extended Data Figure 3-2 shows the performance of each individual rat.
- Figure 4.
The CTA to 18% sucrose was not extinguished after re-evaluating performance in the sucrose intensity task (post-CTA; Fig. 3A). A, Two bottle experiment design. B, Sucrose PR for saline and LiCl groups during day 1 (white circles) and day 2 (black circles) of the two-bottle preference test. Note that, compared with saline treated rats, subjects injected with LiCl persistently disliked and rejected sucrose. * Significant differences compared with saline-treated rats. Data are presented as median ± iqr.


Tables
Behavioral measurements Saline, i.p. LiCl, i.p. Pre-CTA Post-CTA Pre-CTA Post-CTA Performance (%) 87.7 ± 3 87.3 ± 2.7 92.1 ± 0.8 89.2 ± 0.9* CDL (s) 0.5 ± 0.1 0.6 ± 0.1 0.6 ± 0.04 0.5 ± 0.04 Response (s) 0.8 ± 0.04 0.9 ± 0.04 0.8 ± 0.04 0.8 ± 0.05 Return (s) 1.8 ± 0.05 1.8 ± 0.02 1.9 ± 0.06 1.9 ± 0.05 Number of trials 249 ± 30.2 258.5 ± 13.7 270.2 ± 2.8 258.7 ± 8.6 PSE 9.6 ± 0.6 7.6 ± 0.4* 9.4 ± 3.3 8.6 ± 2.9 Li 4.7 ± 0.4 3.5 ± 0.4 3.3 ± 0.5 2.8 ± 0.4 WF 0.50 ± 0.05 0.42 ± 0.04 0.36 ± 0.05 0.33 ± 0.05 Data presented as mean ± SEM. Data averaged from the five last and first discrimination (from performance to number of trials) and generalization (PSE, Li, WF) sessions, before and after CTA procedure. * Indicates significant difference. All statistical results can be found in the Extended Data Table 1-1.
Extended Data Table 1-1
Statistical table. Download Table 1-1, XLSX file.
Extended Data Figure 2-1
During discrimination sessions of the sucrose intensity task, other behavioral measurements were not significantly affected by the sucrose concentration. A, Time spent licking in the central port after cue delivery (CDL). Note that CDL decreased over sessions to the same level for sucrose concentrations: low (green) and high (red). B, Time spent to move from the central to the lateral port (response movement) across sessions. Same conventions as in A. C, Time needed to move from the lateral to the central port (return movement). D, Time licking in the lateral port is similar in both sucrose concentration trials. Data are presented as mean ± SEM. Download Figure 2-1, TIF file.
Extended Data Figure 3-1
Performance and other behavioral measurements were essentially unchanged after animals were given a CTA to 18% sucrose. A, Correct responses of the last and first five discrimination sessions, before (open circles) and after (filled circles) CTA, for rats, injected intraperitoneally with saline (left) and LiCl (right). Each circle represents one session of each subject. The learning criterion is depicted by the purple line. B, Time spent licking during the cue epoch (CDL). Same conventions as in A. C, Same as in B for the response movement time. D, Same as in B for the return movement time. E, Number of trials completed. Conventions are the same as in B. Data are presented as mean ± sem. * Denotes statistical difference p < 0.05. Download Figure 3-1, TIF file.
Extended Data Figure 3-2
A, Percentage of times five subjects in the saline group classified a sucrose concentration as “high.” Averaged performance obtained during the five sessions before and after CTA is represented by the open, and gray filled circles. The dashed and solid lines are the fitted sigmoid, respectively (see Materials and Methods). B, Same as in C but for rats injected with LiCl (black). The x-axis is scaled logarithmically. Data are presented as mean ± SEM. Download Figure 3-2, TIF file.
In this issue


