

Article Figures & Data
Figures
- Figure 1.
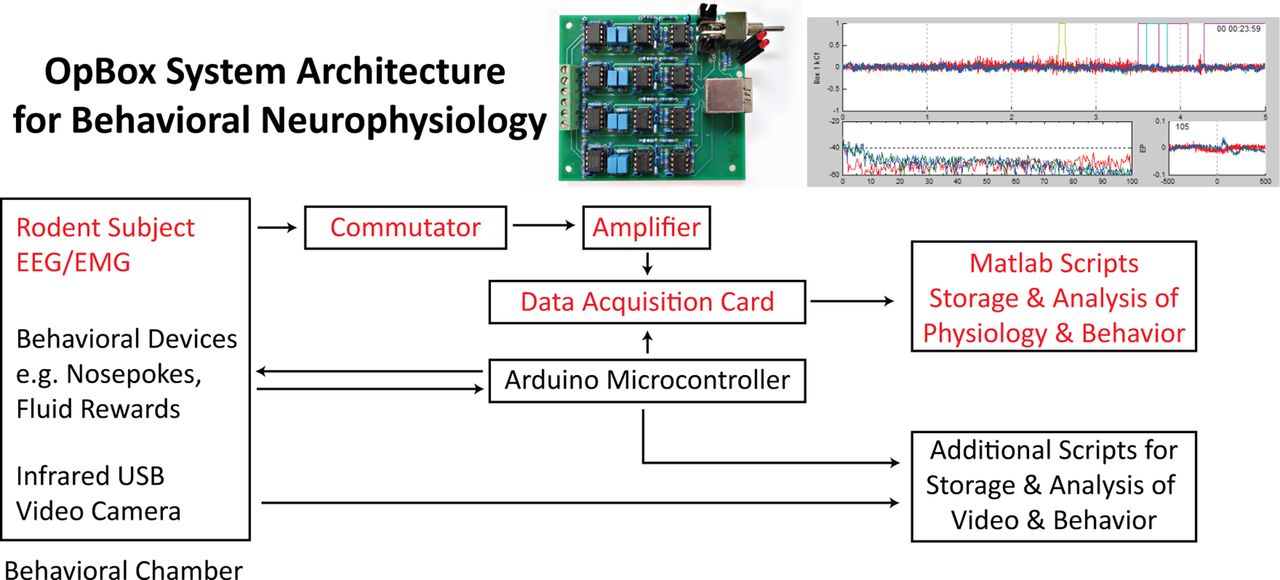
Overall architecture of the OpBox system. On the leftmost are the subjects and devices that may be placed within a behavioral chamber. Arrows in the top part of the figure indicate the flow of electrophysiology (EEG and EMG) data to the amplifier, data acquisition card, and software scripts. Additional arrows indicate the ability to add behavioral and video modules as well. Pictures of modules described in this paper in detail (OpBox amplifier and MATLAB GUI) are shown above their respective nodes.
- Figure 2.
OpBox amplifier designs. A, Circuit schematic for one channel of the electrophysiology amplifier. For clarity, power connections and decoupling capacitors are not shown. B, Photograph of a four-channel amplifier PCB with all components. All channels in this four-channel amplifier share the same reference and there is an additional ground connection. C, Photograph of a three-channel amplifier PCB with all components. In this three-channel amplifier, channels 1 and 2 share a reference, while channel 3 is a separate bipolar channel. Details for B, C are as follows: Signal inputs via screw terminals for unamplified electrophysiology input signals (EEG and EMG). Single channel amplifier components. Amplifier chips are highlighted with dashed yellow outlines. Leftmost is an instrumentation amplifier (INA114, Texas Instruments) with low offset voltage (50 μV), drift (0.25 μV/°C), and high common-mode rejection (115 dB at G = 1000), set for a fixed voltage gain of 10×. The middle and rightmost chips are operational amplifiers (TLC277, Texas Instruments) with gain of 10× each, for a total system gain of 1000×. Each also implements one of two successive two pole active high-pass (0.28 Hz, Q ≈ 0.71) or low-pass (200 Hz, Q ≈ 0.71) filters in Sallen–Key configurations (6 dB/octave). Output connections for amplified signals. Four-channel amps use a single RJ45 (Ethernet) connector for all channels, three-channel amps use BNC connectors for each channel. LED indicators to check power connections and battery level for the positive and negative rails (±3V). Each power rail uses two AA batteries in series (+3 V and −3 V). Photographs in B, C were adjusted to improve contrast and remove lab logo for blind review.
- Figure 3.
Simultaneous EEG/EMG recordings from rat subjects using OpBox scripts. A, Data stream from a single subject. The largest plot shows overlaid amplified voltages from all channels (−1 to +1 V) over the past 5 s. The overlapping blue and green traces represent EEG, while the red trace is EMG from nuchal muscles. Rectangular traces in the EEG plot represent digital behavioral event markers (each color of yellow, magenta, and cyan represents a different type of behavioral event). Box number and subject ID are shown to the left of the plot. The top right of this plot shows elapsed time since the start of the recording. Below each EEG plot, a real-time FFT based power spectrum (0–100 Hz, plotted with log power on the y-axis) is shown to the left. The mean accumulated evoked potential (1-s total window length, auditory stimulus onsets are at time = 0 ms) is shown in the bottom right; y-axis is in amplified volts and the number of stimuli is indicated in the top left corner. This GUI is running in MATLAB on a Windows desktop computer. B, Full GUI window showing simultaneous acquisition from twelve subjects. Eight rats are performing an auditory Go/No-go discrimination, each with their own mean evoked potentials displayed. The last four subjects are recordings of spontaneous behavior, i.e., while not performing a task, and thus have no evoked potentials. This multisubject GUI allows the experimenter to monitor all subjects simultaneously with a consistent configuration.
- Figure 4.
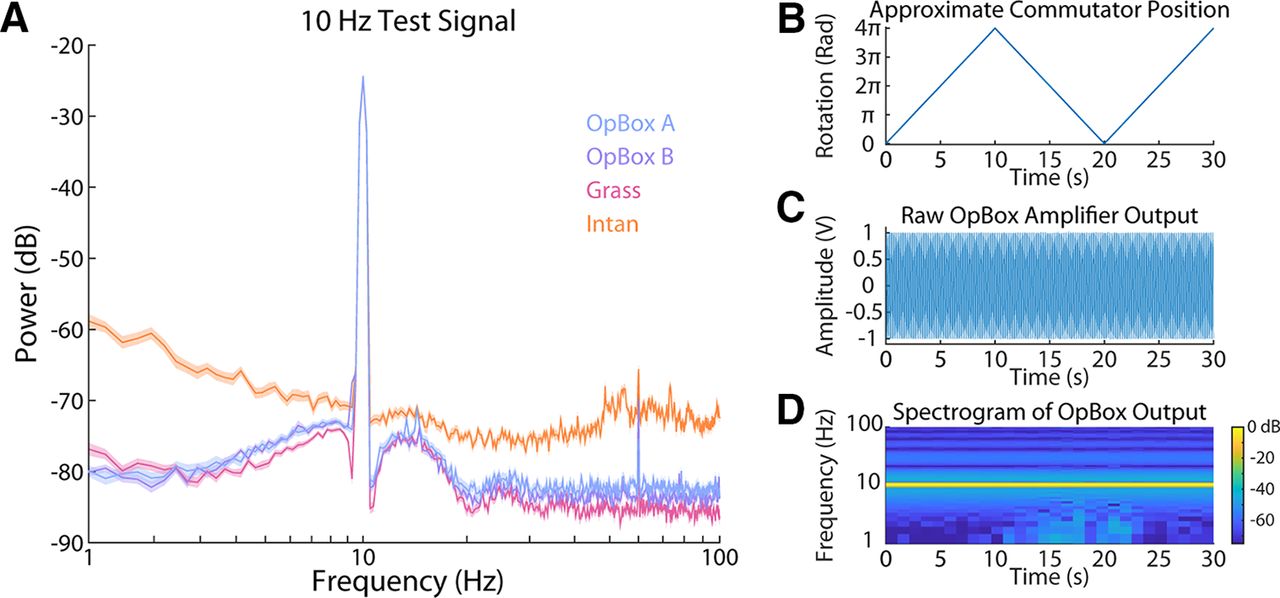
Amplification of a 10-Hz test signal. A, Comparison of power spectrum density over a 5-min period, where a 10-Hz, 100-μV peak-to-peak sine wave was sent to one channel of each amplifier using a function generator and voltage divider circuit. Spectrograms were taken of the amplifier outputs using 4 s, non-overlapping windows (n = 75 windows per amplifier). Spectra are shown with shaded 95% confidence intervals. No line filters were used. Signals were also sent via an inexpensive commutator used by our lab to verify their performance. Commutators were spun by hand. B, Approximate rotational position in radians of our commutator where 0 is equivalent to the initial position. C, Raw recording of the test signal. D, Spectrogram of the signal.
- Figure 5.
High sample rate tests. OpBox and Grass amplifiers were sampled at 100 kHz via OpBox scripts in MATLAB, and the Intan amplifier was sampled at their max rate of 30 kHz using the Open Ephys GUI. A, Phase distortion from Grass and OpBox amplifiers at 5 different frequencies; 1-mV peak-to-peak sine wave signals at varying frequencies were split from a function generator and sent to one channel of the amplifier via a voltage divider as well as directly to the DAQ. Data from both inputs were sampled simultaneously at 100 kHz. Recordings were Hilbert transformed and the difference in phase angle was calculated for each frequency tested. B, Measured gain for Grass and OpBox amplifiers at each frequency. Using the same recordings, RMS values over the entire 10 s were calculated and the ratio of amplified signals versus direct to DAQ signals divided by 1000 (to match the voltage divider output) are reported for each frequency. C, Amplifier responses to a step response, a 10-s, 500-μV unipolar rectangular wave. A simulated version of the amplifier input is shown in the top plot. D, Amplifier responses to an approximate impulse response, a 1-ms, 500-μV unipolar pulse. A simulated version of the amplifier input is shown in the top plot.
- Figure 6.
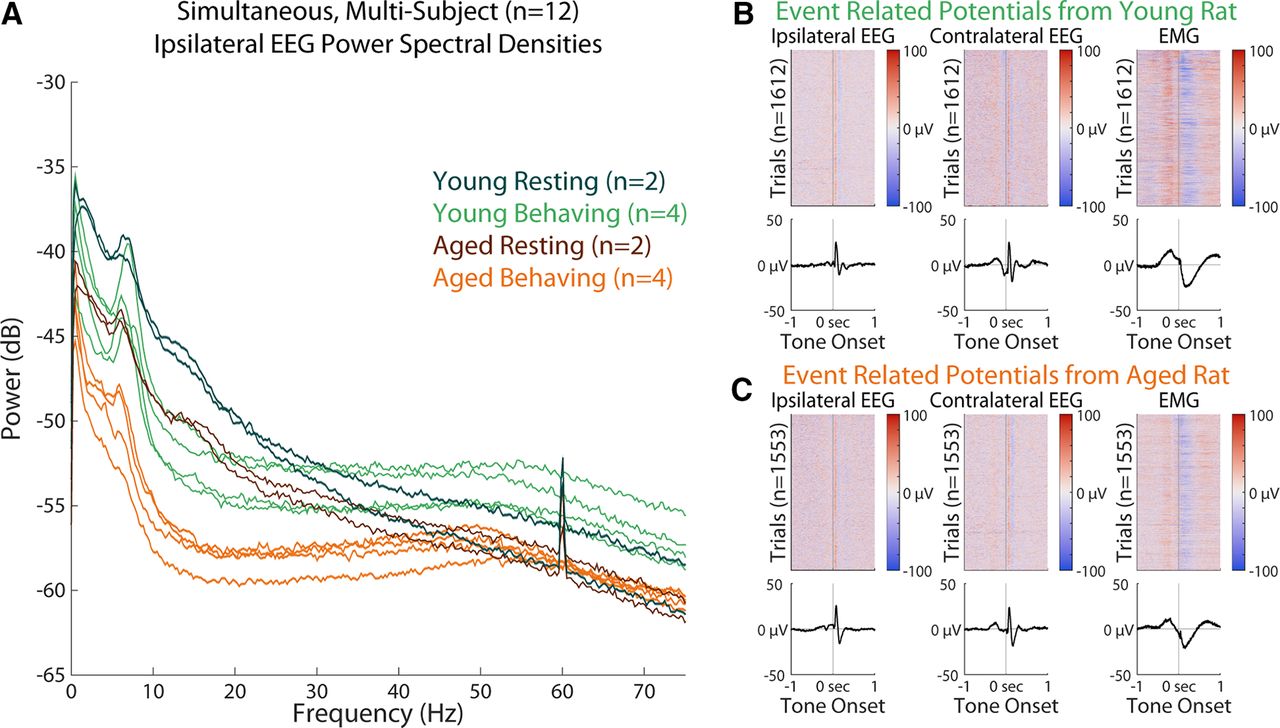
Multisubject session demonstrating the ability to record electrophysiology (EEG and EMG) data from 12 subjects simultaneously. A, Combined plot of all 12 subjects’ ipsilateral EEG power spectrums. Each trace represents the mean power spectral density from one subject over 1 h of EEG recording. Traces are color coded by cohort, determined by age and whether subjects are performing a Go/No-go task or are resting. B, C, Evoked potential data from a young and aged subject, respectively, from the same session, demonstrating the consistent ability to synchronize EEG recordings with behavioral event triggers. Evoked responses shown were collected over the entire 4-h behavioral session. Each column represents a channel of EEG (ipsilateral or contralateral) or EMG. Top plots represent analog rasters for each trial, bottom plots represent the channel means, plotted with shaded SEM, although the high trial counts have reduced these intervals too much to visualize. Stimuli presentations were 1 s long and self-initiated by a nosepoke at least 100 ms in duration. Depending on task criteria, tones were 3.5, 6.5, or 12 kHz in frequency, at ∼55 dB. Time 0 s indicates tone onset, with preceding nosepoke registration at −0.1 s.


Tables
Amplifier Inputs shorted
(μV rms)Connected by 1 kΩ (μV rms) Connected by 10 kΩ (μV rms) Connected by 10 kΩ and 30-cm cable (μV rms) Inputs open
(μV rms)OpBox A 1.322 ± 0.005 1.324 ± 0.009 1.337 ± 0.008 1.342 ± 0.006 1.708 ± 0.011 OpBox B 1.282 ± 0.006 1.284 ± 0.006 1.297 ± 0.006 1.306 ± 0.007 1.896 ± 0.021 Grass 0.554 ± 0.009 0.596 ± 0.046 0.589 ± 0.008 0.529 ± 0.018 12.756 ± 0.122 Intan 2.632 ± 0.009 2.708 ± 0.046 3.032 ± 0.055 22.107 ± 1.034 13.104 ± 0.508 Values from noise floor testing of the different amplifiers; 5-min segments of recordings were taken from each amplifier type with differential inputs shorted using a wire, connected using different resistors, or left completely unconnected. To mimic the effect of having EEG travel via a cable in a tethered subject recording, we also connected the amplifier inputs to a 10-kΩ resistor but at the end of a 30-cm shielded two conductor cable. The shielding of the cable was grounded. Mean RMS values of these 5-min segments were calculated using 10 non-overlapping 30-s windows. Mean and SEM values are reported for each combinations of amplifier type and testing criteria; n = 10 non-overlapping 30-s windows for all table cells.
Amplifier 1 Hz 5 Hz 10 Hz 25 Hz 50 Hz OpBox 0.861 GΩ [0.859, 0.864] 0.866 GΩ [0.861, 0.868] 0.869 GΩ [0.866, 0.872] 0.885 GΩ [0.883, 0.889] 0.902 GΩ [0.899, 0.905] Grass 0.100 GΩ [0.100, 0.101] 0.101 GΩ [0.101, 0.101] 0.102 GΩ [0.102, 0.103] 0.116 GΩ [0.116, 0.116] 0.204 GΩ [0.204, 0.205] Intan 2.832 GΩ [1.926, 4.915] 2.301 GΩ [1.570, 2.861] 1.842 GΩ [1.775, 1.888] 1.391 GΩ [1.324, 1.471] 0.959 GΩ [0.901, 1.024] Input impedance values for each amplifier at various EEG relevant frequencies. Two 3-min recordings were taken of sine wave signals, once using a 0-Ω upper arm resistor (wire) and once using a precision 10-MΩ resistor. Recordings were divided into 20 segments, and the RMS values were calculated for each segment. Ratios between RMS values using the different resistors were used to calculate the input impedances. Data are displayed as median [interquartile range].
Extended Data 1
PCB designs: amplifier PCB design files ready to be sent out for fabrication or modified to fit customized specifications. How to build + parts list: a document file containing detailed instructions for constructing the OpBox system, separated by component, with a spreadsheet of all parts used in the process of building the amplifier. Software scripts: MATLAB scripts necessary for running behavioral tasks and recording behavioral/physiological data. Includes example CSV spreadsheet files (InfoSubjects + InfoBoxes) and instructions for use. Download Extended Data 1, ZIP file.
In this issue


