

Article Figures & Data
Figures
- Figure 1.
sCaLTs in primary cultured OLs. A, A representative example of a sCaLT in a DIV2 rat OL labeled with fluo-4. The highly branched processes of this OL are clearly depicted in the fluorescent snapshot on the left. The time-lapse sequence of a small region containing multiple branches (dashed rectangle) is shown on the right. Red arrows indicate a sCaLT. Scale bars: 20 and 5 μm, respectively. B, The widespread and transient nature of sCaLTs in cultured OLs. The left fluorescent image depicts a multipolar OL labeled with fluo-4 with five selected local regions displaying sCaLTs. The right fluorescent image is the same cell overlaid with the pseudocolored temporal-code map to depict changes in the fluo-4 fluorescence (ΔF) over the entire time-lapse period. The color bar depicts the colors associated with specific times in the sequence. Traces of ΔF/F0 of the five selected local segments, as well as the soma, are shown on the right. Scale bar: 20 μm.
- Figure 2.
sCaLT frequency positively correlates with increased branch complexity during primary cultured OLs development. A, Representative fluorescent images of four groups of OLs with distinct morphologies. Here, OLs were double stained for α-tubulin (α-tub; green) and OL markers (red: Olig2, O4, or MBP). Olig2 is present in all four groups of cells (OL lineage), O4 is expressed in both simple and complex cells (immature), and MBP is only expressed in mature cells. Scale bar: 20 μm. B, Representative traces of ΔF/F0 showing sCaLTs in OLs from four different groups. Each colored line represents one ROI. C–E, Bar graphs showing the sCaLT frequency/cell, sCaLT frequency/site, and sCaLT amplitude for each group of cultured OLs. Statistical analysis was performed using a Kruskal–Wallis one-way ANOVA with Dunn’s post hoc test in SPSS. Error bars represent the SD; *statistical difference (p < 0.05) from the bipolar group; #statistical difference (p < 0.05) between the two indicated groups. Numbers indicate the total number of cells examined for each group. It should be noted that only four of 14 bipolar cells displaying sCaLTs were quantified for the sCaLT frequency/site and amplitude. Quantification of sCaLT frequency/cell (Kruskal–Wallis test: p = 1.1882E-9, H = 44.49, df = 3; Dunn’s test: bipolar vs simple, p = 0.000012; bipolar vs complex, p = 2.1741E-9; complex vs mature, p = 0.001272). Quantification of sCaLT frequency/site (Kruskal–Wallis test: p = 0.002896, H = 14.007, df = 3; Dunn’s test: simple vs mature, p = 0.019867; complex vs mature, p = 0.002509). Quantification of sCaLT amplitude (Kruskal–Wallis test: p = 0.083240, H = 6.669, df = 3).
- Figure 3.
Removal of extracellular calcium abolishes sCaLTs. A, Representative temporal-color maps showing sCaLTs before and after the addition of calcium-containing (Ctrl, left) or calcium-free (right) Krebs–Ringer’s solution. B, Representative ΔF/F0 traces before and after application of calcium-containing (Ctrl, left) or calcium-free (right) Krebs–Ringer’s solution. C, Bar graph shows the sCaLT frequency per cell (left) and amplitude (right) after 10-min treatment (normalized to the 2-min pretreatment values); *p < 0.05, Student’s t test. Error bars represent the SEM. N: the total number of cells examined. For frequency/cell, p = 1.45E-05; for amplitude, p = 0.002611. D, Bar graph shows the frequency (left) and amplitude (right) at several time-points after application of calcium-free solution; *p < 0.05, one-way ANOVA with Tukey’s HSD test). Error bars represent the SEM. N: the total number of cells examined. Statistics on the frequency (df = 3, F = 134.295, p = 1.4868E-11; Tukey’s HSD test: 0 vs 4–6 min, p = 1.0008E-9; 0 vs 8–10 min, p = 1.9122E-10; 0 vs 28–30 min, p = 2.455E-11). Statistics on the amplitude (df = 3, F = 27.582, p = 0.000001; Tukey’s HSD test: 0 vs 4–6 min, p = 0.001232; 0 vs 8–10 min, p = 0.000476; 0 vs 28–30 min, p = 5.8439E-7).
- Figure 4.
Expression of VGCCs, and the effects of VGCC inhibition on sCaLTs. A, Differentiated CG4 cells exhibit sCaLTs similar to primary OLs. A representative fluo-4 image and the pseudocolor temporal-code map of sCaLTs are shown on the left. Sample ΔF/F0 traces of three selected regions are shown on the right. Scale bar: 20 μm. B, RT-PCR showing the expression of several types of voltage-gated calcium channels in CG4 cells. Lane 1 is cDNA only control (no primer), lane 2 is water control (no cDNA), and rest lanes are samples with corresponding voltage-gated calcium channel primers. The voltage-gated calcium channel α1 subunit name and gene name were listed as follow: 1S (Cav1.1; CACNA1S), 1C (Cav1.2; CACNA1C), 1D (Cav1.3; CACNA1D), 1F (Cav1.4; CACNA1F), 1A (Cav2.1; CACNA1A), 1B (Cav2.2; CACNA1B), 1E (Cav2.3; CACNA1E), 1G (Cav3.1; CACNA1G), 1H (Cav3.2; CACNA1H), and 1I (Cav3.3; CACNA1I). Gel is representative of three independent experiments. C, Bar graphs showing the effects of different VGCC blockers on the frequency/cell and amplitude of sCaLTs in primary OLs after 10-min treatment. Nife: nifedipine; NNC: NNC 55–0369. Error bars represent the SEM. Statistical analysis was done by one-way ANOVA with Tukey’s HSD test.
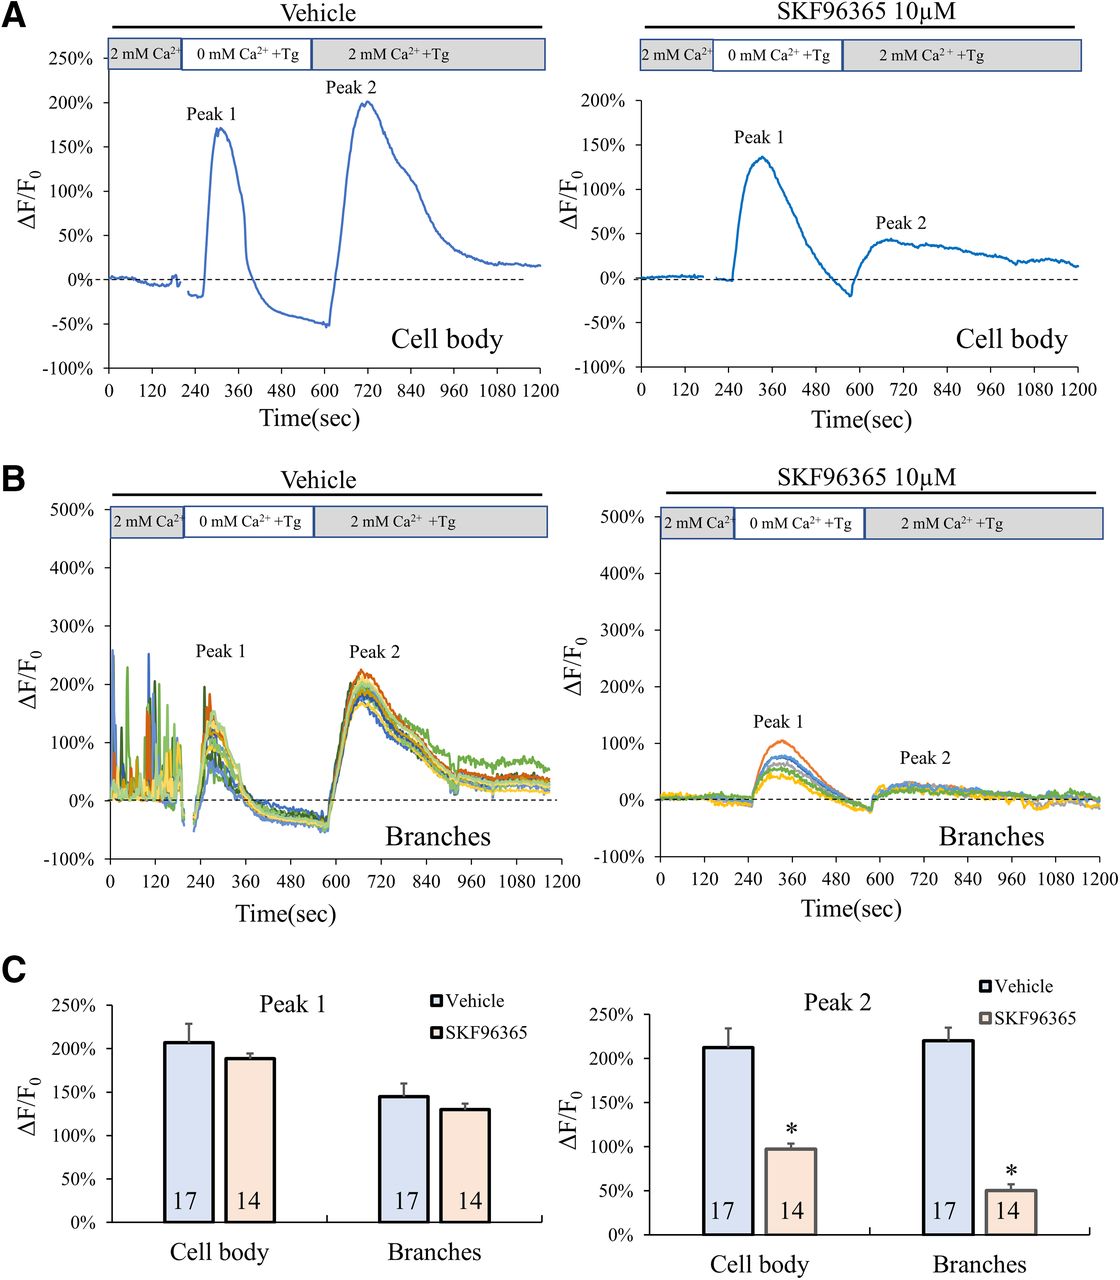
- Figure 5.
Presence of SOCE in OLs. A, B, Representative plot of the fluo-4 fluorescence (ΔF/F0) in the cell body (A) and in the branches (B) of an OL subjected to the following sequence of treatments: 2 min control in a 2 mm Ca2+ saline buffer, 8 min in a Ca2+-free buffer containing 1 μm Tg, and 10 min in a 2 mm Ca2+ saline buffer containing 1 μm Tg. C, Bar graphs showing the average ΔF/F0 values (%) in cell body and branches for peak #1 and peak #2. n = number of cells from at least three independent experiments; *statistical difference (p < 0.05) when comparing SKF96365 application to vehicle control. All p values were calculated using two tail unpaired Student’s t tests. Peak #2: for cell body, p = 0.00528278; for branches, p = 3.52E-44.
- Figure 6.
Inhibition of SOCE or internal calcium store attenuates the frequency and amplitude of sCaLTs. A, Effects of SKF96365 (10 μm and 50 μm) treatment on sCaLT frequency (left) and amplitude (right) normalized to pretreatment baseline. n = number of cells from at least three independent experiments. B, Effects of internal calcium store blockers on sCaLT frequency (left) and amplitude (right). SFK: SKF96365, CPA:cyclopiazonic acid, Tg: thapsigargin; Ry: ryanodine. n = number of cells from four independent experiments; *statistical difference (p < 0.05) for unpaired comparison to the baseline control period. All p values were calculated using one-way ANOVA with Tukey’s HSD test. For SKF96365, quantification of frequency (df = 2, F = 15.473, p = 0.000285; Tukey’s HSD test: Ctrl vs SKF 10 μm, p = 0.000871; Ctrl vs SKF 50 μm, p = 0.000521), quantification of amplitude (df = 2, F = 24.152, p = 0.000029; Tukey’s HSD test: Ctrl vs SKF 10 μm, p = 0.000122; Ctrl vs SKF 50 μm, p = 0.000050). For internal calcium store inhibitors, quantification of frequency (df = 3, F = 20.043, p = 0.000017; Tukey’s HSD test: Ctrl vs CPA, p = 0.000054; Ctrl vs Tg, p = 0.000040; Ctrl vs Ry, p = 0.046953), quantification of amplitude (df = 3, F = 11.182, p = 0.000413; Tukey’s HSD test: Ctrl vs CPA, p = 0.000209; Ctrl vs Tg, p = 0.018541; Ctrl vs Ry, p = 0.092622).
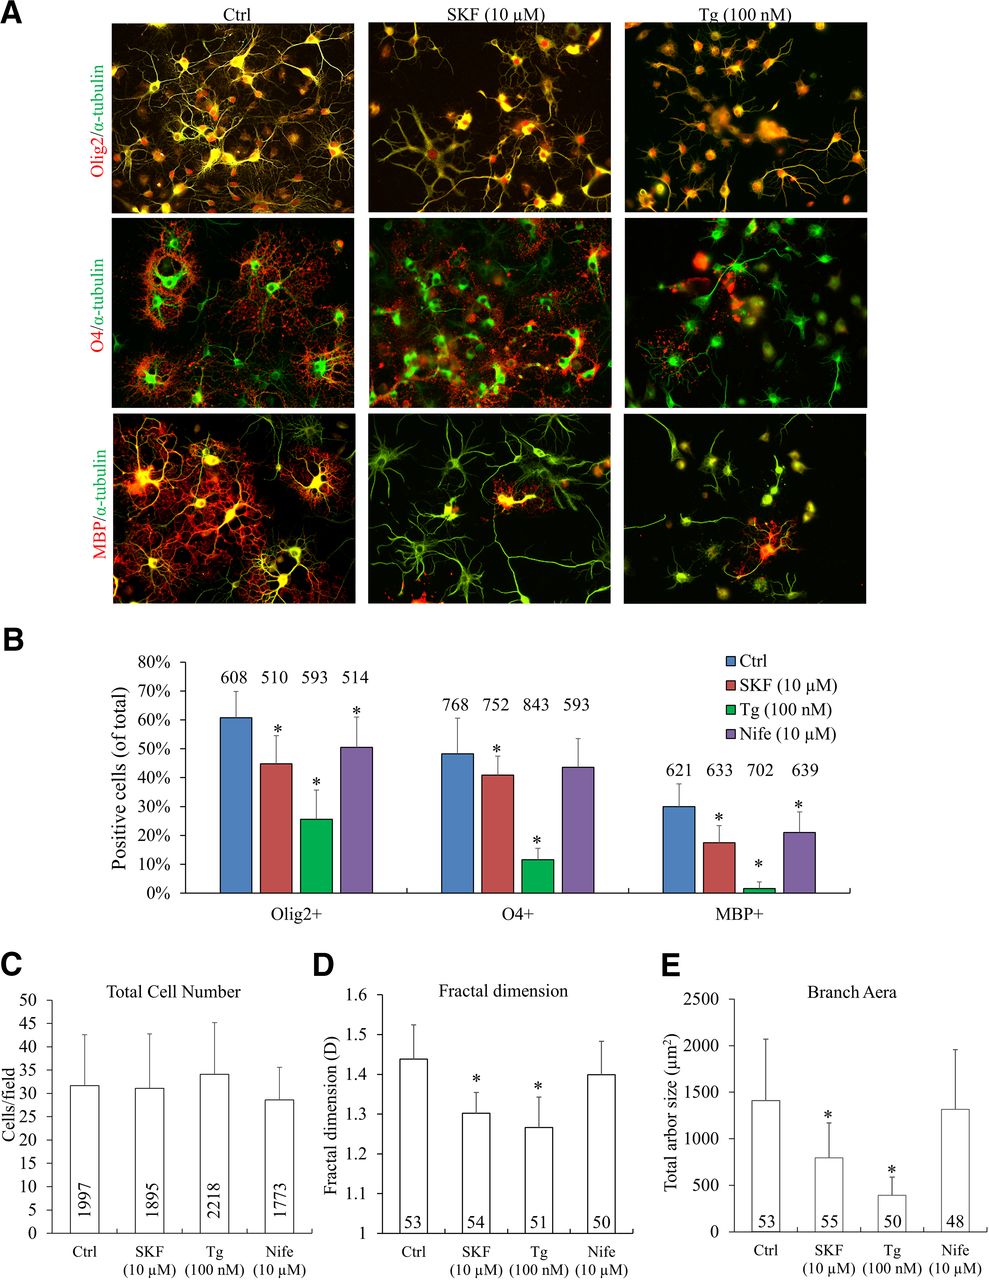
- Figure 7.
Effects of long-term (4 d) sCaLTs inhibition on OL differentiation and growth in culture. A, Representative images of cells exposed to different calcium inhibitors. One day after plating, cells were treated with vehicle or inhibitors for 4 d. Cells were fixed at DIV5 and stained for α-tubulin (green) and OL markers (Olig2, O4, or MBP; red). Scale bar: 50 μm. B, Bar graphs showing the percentage of cells positive for each OL marker after respective drug treatment. C, Bar graphs showing the quantification of the total number of cells for each drug condition. D, E, Bar graphs showing D values (fractal dimension) and the total arbor size of OLs after each treatment. n = number of cells from at least three independent experiments; *statistical difference (p < 0.05) compared with the corresponding vehicle or control group (one-way ANOVA with Tukey’s HSD test). Error bars represent the standard error. Quantification of positive markers: Olig2+ (df = 3, F = 48.610, p = 9.841E-18; Tukey’s HSD test: Ctrl vs SKF, p = 0.000014; Ctrl vs Tg, p = 5.7843E-13; Ctrl vs Nife, p = 0.006978), O4+ (df = 3, F = 77.082, p = 1.5532E-25; Tukey’s HSD test: Ctrl vs SKF, p = 0.048013; Ctrl vs Tg, p = 4.8717E-13; Ctrl vs Nife, p = 0.396643), MBP+ (df = 3, F = 80.817, p = 2.0443E-24; Tukey’s HSD test: Ctrl vs SKF, p =1.8915E-8; Ctrl vs Tg, p = 5.3879E-13; Ctrl vs Nife, p = 0.000056), quantification of fractal dimension (df = 3, F = 59.285, p = 1.3288E-27; Tukey’s HSD test: Ctrl vs SKF, p = 4.5963E-13; Ctrl vs Tg, p = 4.5952E-13; Ctrl vs Nife, p = 0.064), quantification of surface area of OLs (df = 3, F = 45.033, p = 2.6408E-22; Tukey’s HSD test: Ctrl vs SKF, p = 1.0261E-8; Ctrl vs Tg, p = 3.9668E-13; Ctrl vs Nife, p = 0.786579).
- Figure 8.
Effects of short-term (2 h and 1 d) sCaLTs inhibitions on OL differentiation and growth in culture. A, Representative images of α-tubulin staining of cultured OLs incubated in control medium or Ca2+-free medium for 1 d (DIV3–DIV4). Scale bar: 50 μm. B, The bar graph shows the total arbor size after being cultured in control medium or Ca2+-free medium for 1 d. Numbers in parentheses indicate the number of cells examined for each condition from three independent experiments. Error bars represent SD; *p < 0.05 (p = 1.045E-15). C, The bar graph shows total cell number of OLs after being cultured in control medium and Ca2+-free medium for 1 d. Error bars represent the SD. Numbers in parentheses indicate the number of cells examined for each condition from three independent experiments. D, DIC images showing the morphologic changes of OLs in 20 min after being pretreated with control medium or SKF 10 μm for 2 h. Scale bar: 20 μm. The quantification is shown as a bar graph in E. Error bars represent the SD. Numbers in parentheses indicate the number of cells examined for each condition; *statistical difference (p < 0.05) compared with the corresponding control group (one-way ANOVA with Tukey’s HSD test). Quantification results (df = 2, F = 18.406, p = 0.000044; Tukey’s HSD test: Ctrl vs SKF, p = 0.000153; Ctrl vs. Ca2+-free, p = 0.000169). F, Bar graph shows the F-actin change index for OLs incubated with control medium or Ca2+-free medium for 2 h. n = number of cells from four independent experiments. Error bars represent the SD; *statistical difference (p < 0.05, unpaired Student’s t test); p = 0.002759. G, Association between sCaLTs and actin-based protrusive activity. The upper left pair of panels show a representative GCaMP3 fluorescent image of a part of an OL, which is shown as a schematic drawing on the right. Both GCaMP3 and Ruby-Lifeact were expressed in this OL. Two subregions of interest (i) and (ii) are indicated by the oval shapes and their changes in GCaMP3 fluorescence (ΔF/F0) are shown in the line plots on the right, which clearly shows that (i) region exhibited a sCaLT. The two insets in the line plots show the Ruby-Lifeact fluorescent images (inverted greyscale) of the same region before and after the sCaLTs. To examine the actin-based protrusive activities of these two subregions, two straight lines for each of the two subregions were used to generate the kymograph of Ruby-Lifeact signals shown at the bottom. Red arrows indicate the onset of the sCaLT in (i).


Tables
Primer Sequence Temperature Product size (bp) Cacna1A-F GAAAAGAGAGCCAGGGCTCTG 54 328 Cacna1A-R CTGTTCTCGGGAGTCTTGGGG Cacna1B-F GCTCGCTCTTCGTCTTCA 52 188 Cacna1B-R AGGTTCCGTGTCATCCAGT Cacna1C-F CCAGCCCAGAAAAGAAACAG 55 271 Cacna1C-R ACTGCCTTTTCCTTAAGGTGCA Cacna1D-F ATTGCCAGAAAAGAAAGCCTAGA 55 321 Cacna1D-R GATGAGTTTGTGGCAACCCAC Cacna1E-F ATGTCCCTGAAGATGTATGG 50 102 Cacna1E-R AACGACCTCAAAGATGCTG Cacna1F-F GACGGCAACTTGGCTTCT 53 144 Cacna1F-R GCTGGCATGACTGCTGGT Cacna1G-F CTGGAGAGGGCCAGGAGAGTCAGG 65 371 Cacna1G-R GGCCGACCAGGAATCTCGCTCTC Cacna1S-F ATGCCAGAGGATGACAACAAC 55 181 Cacna1S-R CACCCAGAAAGACAATGATGAA Cacna1H-F GGTTTGGGTACCATGAACTA 58 374 Cacna1H-R GTAAACTCATAGACTCCGTG Cacna1l-F TTATCTGCTCCCTGACTGG 58 406
In this issue


