
Umbrella menu

  • SfN.org
  • eNeuro
  • The Journal of Neuroscience
  • Neuronline
  • BrainFacts.org

Main menu

  • HOME
  • CONTENT
    • Early Release
    • Featured
    • Latest Articles
    • Issue Archive
    • Editorials
    • Research Highlights
  • TOPICS
    • Cognition and Behavior
    • Development
    • Disorders of the Nervous System
    • History, Teaching and Public Awareness
    • Integrative Systems
    • Neuronal Excitability
    • Novel Tools and Methods
    • Sensory and Motor Systems
  • ALERTS
  • FOR AUTHORS
  • EDITORIAL BOARD
  • BLOG
  • ABOUT
    • Overview
    • For the Media
    • Privacy Policy
    • Contact Us
    • Feedback
  • SfN.org
  • eNeuro
  • The Journal of Neuroscience
  • Neuronline
  • BrainFacts.org

User menu

  • My alerts

Search

  • Advanced search
eNeuro
  • My alerts

eNeuro

Advanced Search

Submit a Manuscript
  • HOME
  • CONTENT
    • Early Release
    • Featured
    • Latest Articles
    • Issue Archive
    • Editorials
    • Research Highlights
  • TOPICS
    • Cognition and Behavior
    • Development
    • Disorders of the Nervous System
    • History, Teaching and Public Awareness
    • Integrative Systems
    • Neuronal Excitability
    • Novel Tools and Methods
    • Sensory and Motor Systems
  • ALERTS
  • FOR AUTHORS
  • EDITORIAL BOARD
  • BLOG
  • ABOUT
    • Overview
    • For the Media
    • Privacy Policy
    • Contact Us
    • Feedback
PreviousNext
Research ArticleResearch Article: New Research, Neuronal Excitability

Electric Field Application In Vivo Regulates Neural Precursor Cell Behavior in the Adult Mammalian Forebrain

Elana Sefton, Stephanie N. Iwasa, Taylor Morrison, Hani E. Naguib, Milos R. Popovic and Cindi M. Morshead
eNeuro 27 July 2020, 7 (4) ENEURO.0273-20.2020; DOI: https://doi.org/10.1523/ENEURO.0273-20.2020
Elana Sefton
1Institute of Biomedical Engineering, University of Toronto, Toronto, Ontario, Canada, M5S 3G9
  • Find this author on Google Scholar
  • Find this author on PubMed
  • Search for this author on this site
Stephanie N. Iwasa
2The KITE Research Institute, Toronto Rehabilitation Institute - University Health Network, Toronto, Ontario, Canada, M5G 2A2
3CRANIA, University Health Network and University of Toronto, Toronto, Ontario, Canada, M5G 2A2
  • Find this author on Google Scholar
  • Find this author on PubMed
  • Search for this author on this site
Taylor Morrison
4Department of Mechanical & Industrial Engineering, University of Toronto, Toronto, Ontario, Canada, M5S 3G8
  • Find this author on Google Scholar
  • Find this author on PubMed
  • Search for this author on this site
Hani E. Naguib
1Institute of Biomedical Engineering, University of Toronto, Toronto, Ontario, Canada, M5S 3G9
4Department of Mechanical & Industrial Engineering, University of Toronto, Toronto, Ontario, Canada, M5S 3G8
5Department of Materials Science & Engineering, University of Toronto, Toronto, Ontario, Canada, M5S 1A1
  • Find this author on Google Scholar
  • Find this author on PubMed
  • Search for this author on this site
Milos R. Popovic
1Institute of Biomedical Engineering, University of Toronto, Toronto, Ontario, Canada, M5S 3G9
2The KITE Research Institute, Toronto Rehabilitation Institute - University Health Network, Toronto, Ontario, Canada, M5G 2A2
3CRANIA, University Health Network and University of Toronto, Toronto, Ontario, Canada, M5G 2A2
  • Find this author on Google Scholar
  • Find this author on PubMed
  • Search for this author on this site
Cindi M. Morshead
1Institute of Biomedical Engineering, University of Toronto, Toronto, Ontario, Canada, M5S 3G9
2The KITE Research Institute, Toronto Rehabilitation Institute - University Health Network, Toronto, Ontario, Canada, M5G 2A2
3CRANIA, University Health Network and University of Toronto, Toronto, Ontario, Canada, M5G 2A2
6Department of Surgery, University of Toronto, Toronto, Ontario, Canada, M5T 1P5
  • Find this author on Google Scholar
  • Find this author on PubMed
  • Search for this author on this site
  • Article
  • Figures & Data
  • Info & Metrics
  • eLetters
  • PDF
Loading

Article Figures & Data

Figures

  • Extended Data
  • Figure 1.
    • Download figure
    • Open in new tab
    • Download powerpoint
    Figure 1.

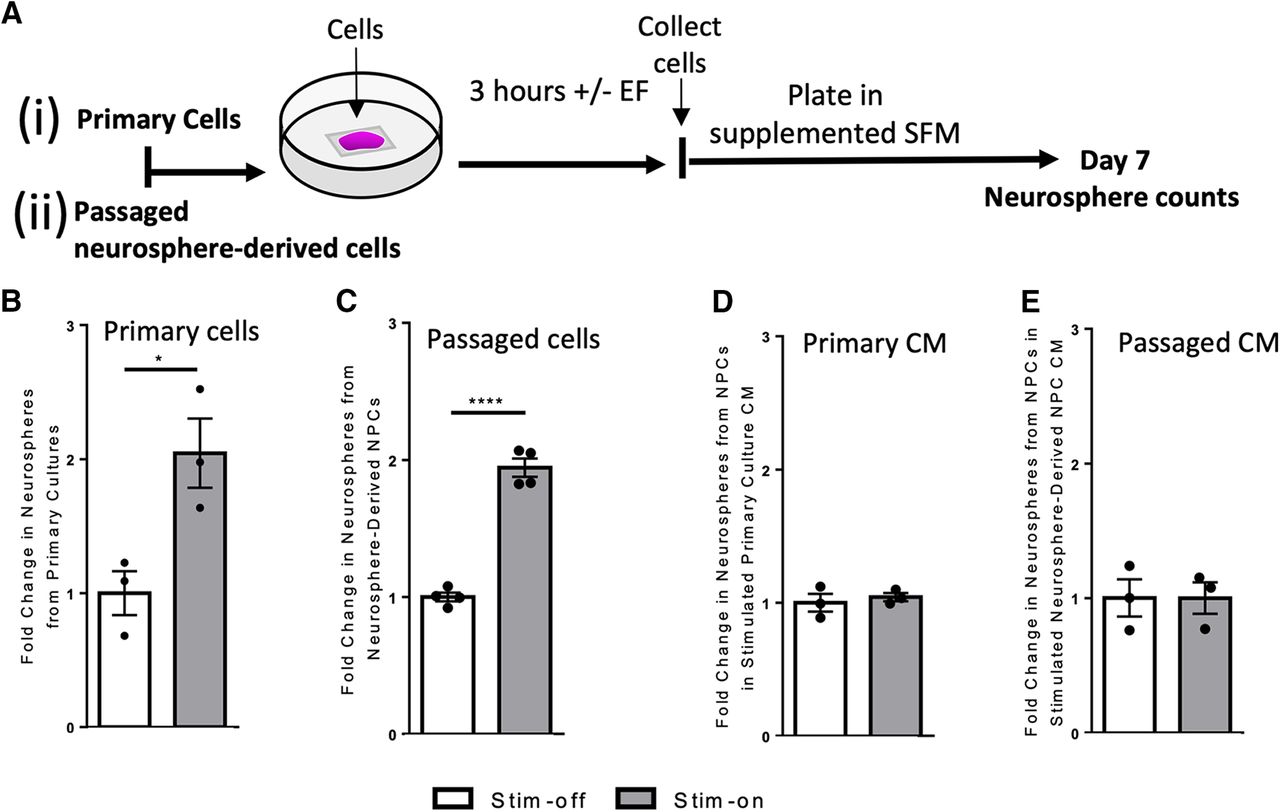
    In vitro electrical stimulation increases the number of neurospheres. Ai, Aii, Experimental paradigms for in vitro electrical stimulation. B, C, Fold change in the number of neurospheres from stim-off cells and stim-on cells from (B) primary cultures (n = 3 independent experiments, *p = 0.03) and (C) neurosphere-derived NPCs (n = 4 independent experiments, ****p < 0.0001). Fold change in the number of neurospheres cultured using CM from stim-off and stim-on (D) primary cells (n = 3 independent experiments) and (E) neurosphere-derived NPCs (p = 0.5 and p = 0.9, respectively; n = 3 independent experiments) Each point in the graph represents an independent experiment, plotted with mean ± SEM. Analysis performed via a two-tailed unpaired t test between stim-off and stim-on groups. Neurosphere counts from in vitro stimulation found in Extended Data Figure 1-1. Comparison of fold changes in neurospheres following stimulation with and without Wnt inhibitor to inhibit symmetric divisions found in Extended Data Figure 1-2.

  • Figure 2
    • Download figure
    • Open in new tab
    • Download powerpoint
    Figure 2

    In vitro electrical stimulation increases cell number and regulates NPC differentiation. A, A 1.7-fold increase in the number of living cells is seen following stim-on when compared with the stim-off cells processed the same way (62,400 ± 5705 vs 36,400 ± 3205 cells, stim-on vs stim-off respectively; n = 10 individual experiments; ***p = 0.0009). B, C, Fold change in the number of colonies from stim-off and stim-on in (B) primary cells (p = 0.06; n = 3 independent experiments) and (C) neurosphere-derived NPCs (p = 0.1; n = 4 independent experiments). Neurosphere counts from in vitro stimulation found in Extended Data Figure 1-1. D, Differentiated neurospheres stained for βIII tubulin (neurons), GFAP (astrocytes), and O4 (oligodendrocytes). White arrows indicate examples of cells co-localized with DAPI (blue). Scale bar = 100 µm. E–G, Quantification of cells as a percent of DAPI (n = 10 spheres/treatment, 3 mice per group) expressing (E) βIII tubulin (*p = 0.02), (F) GFAP (*p = 0.01), and (G) O4 (*p = 0.03). Each point in the graph represents an independent experiment, plotted with mean ± SEM. All analysis performed via a two-tailed unpaired t test between stim-off and stim-on.

  • Figure 3.
    • Download figure
    • Open in new tab
    • Download powerpoint
    Figure 3.

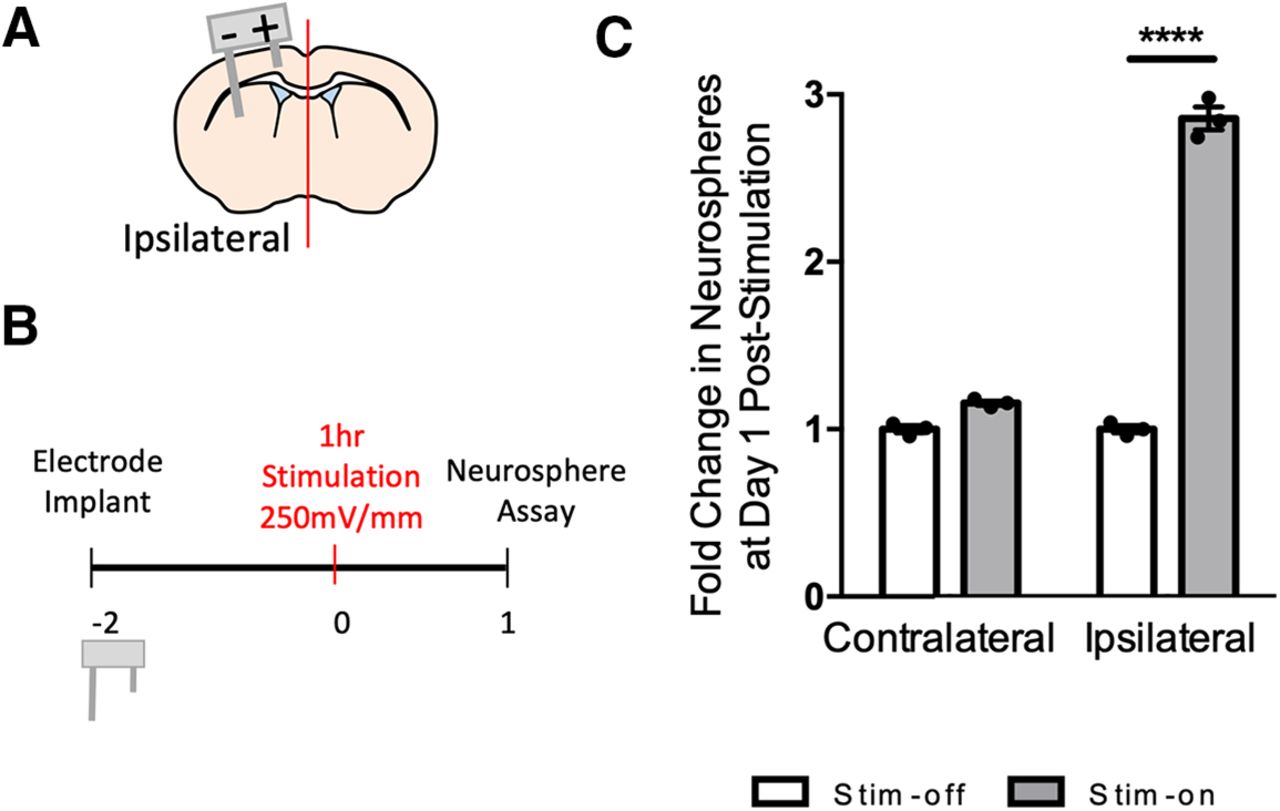
    In vivo electrical stimulation increases the number of neurospheres and proliferation by a means other than activation. A, Image of 3D-printed electrode and schematic of a coronal section through the forebrain indicating the electrode implantation. Anode (+) and cathode (–) are shown. SVZ, subventricular zone. B, Experimental paradigm. C, D, Fold change in the number of neurospheres from stim-off and stim-on brains in the ipsilateral and contralateral hemisphere at (C) day 1 poststimulation (**p < 0.04) and (D) day 3 poststimulation [****p < 0.0001; n = 3 mice/group, two-way ANOVA (α = 0.05) with Tukey’s post hoc analysis]. There was no difference in fold change between days 1 and 3 as seen in Extended Data Figure 3-3. Neurosphere counts from in vivo stimulation found in Extended Data Figure 3-2. E–H, Images of the dorsolateral corner of the lateral ventricle ipsilateral to the electrode in 600 µm2 (EdU&DAPI) or 350 µm2 (EdU&Sox2, EdU&DCX, EdU&Iba1) and quantification. White arrows indicate cells positive for both labels in each image. Ctx, cortex; LV, lateral ventricle; CC, corpus callosum. White box indicates high power inset of dorsolateral corner (or corpus callosum for Iba1&Edu) in bottom left of image. Scale bar =100 µm (EdU&DAPI) or 50 µm. Quantification of cells as a percent of DAPI in the region of interest for stim-off and stim-on brains for (E) EdU+ cells (****p < 0.0001; n = 7 mice/group), (F) EdU+Sox2+ cells (*p = 0.03; n = 3 mice/group), (G) EdU+DCX+ cells (**p = 0.001; n = 3 mice/group), and (H) EdU+Iba1+ cells (p = 0.6; n = 3 mice/group). Analysis performed via two-tailed t test unpaired t test between stim-off and stim-on groups. I, Contour plots showing cell sorts from the stim-off and stim-on brains with the gating strategy as seen in Extended Data Figure 3-1. J, The relative percentage of activated and quiescent cells (n = 4 independent experiments, 5 mice per experiment). The green boxes in the contour plots represent GFAP::GFP+CD133+EGFRhigh cells, blue represents GFAP::GFP+CD133+EGFRlow cells, and red represents GFAP::GFP+CD133– cells (two-way ANOVA, α = 0.05 with Tukey’s post hoc multiple comparison test). Each point in the graphs represents an independent experiment, plotted with mean ± SEM. ns indicates there was no significance in quiescent to activated shift in either stim off or stim on group.

  • Figure 4.
    • Download figure
    • Open in new tab
    • Download powerpoint
    Figure 4.

    Striatal electrodes increase the number of neurospheres. A, Schematic of striatal electrodes in brain. Anode (+) and cathode (−). B, Experimental paradigm. C, Fold change in the number of neurospheres from stim-off and stim-on brains in the ipsilateral hemisphere following striatal stimulation (****p < 0.0001; n = 3 mice/group, two-tailed t test between each stim-off and stim-on groups). Each point in the graphs represents an independent experiment, plotted with mean ± SEM. Neurosphere counts from in vivo striatal stimulation are found in Extended Data Figure 4-1.

Extended Data

  • Figures
  • Extended Data Figure 1-1

    Neurosphere counts from in vitro stimulation. Data reported in mean ± SEM; n = 3–4 mice per group. Download Figure 1-1, DOC file.

  • Extended Data Figure 3-1

    Gating strategy for separating GFAP::GFP+CD133+EGFRhigh cells from GFAP::GFP+CD133+EGFRlow cells adapted from Codega et al. (2014). A, Cell debris was removed and NPCs were sorted using forward scatter (FSC-H) for cell size and side scatter (SSC-H) for cell granularity. B, Single, live cells were gated by removing doublets (C) and (D) DAPI– cells. E, GFP+ cells from the GFAP::GFP+ were selected and three populations were defined: GFAP::GFP+CD133– (red), GFAP::GFP+CD133+EGFRlow (blue) and GFAP::GFP+CD133+EGFRhigh (green). Age matched wild-type C57BL/6J mice were used for single color-stained cells and fluorescent minus one (FMO) gating optimization in which GFP was not required. Download Figure 3-1, TIF file.

  • Extended Data Figure 3-2

    Neurosphere counts from in vivo cortical stimulation. Data reported in mean ± SEM; n = 3 mice per group. Download Figure 3-2, DOC file.

  • Extended Data Figure 3-3

    Changes in the ipsilesional hemispheres from stim off and stim on. There was no difference in fold change between days 1 and 3; n = 3 mice per group, two-tailed unpaired t test, p = 0.1. Download Figure 3-3, TIF file.

  • Extended Data Figure 4-1

    Neurosphere counts from in vivo striatal stimulation. Data reported in mean ± SEM; n = 3 mice per group. Download Figure 4-1, DOC file.

  • Extended Data Figure 1-2

    Comparison of fold changes in neurospheres following stimulation with and without Wnt inhibitor (sFRP2). A, sFRP2 blocked the vast majority of neurosphere growth in the stim-off cultures as predicted with a 16-fold decrease of stem cells and (B) a 17-fold decrease in stim-on conditions (****p < 0.0001). C, Blocking symmetric division does not inhibit the increase in neurospheres following electrical stimulation; n = 3 independent experiments, two-tailed unpaired t test, p = 0.3. Download Figure 1-2, TIF file.

Back to top

In this issue

eneuro: 7 (4)
eNeuro
Vol. 7, Issue 4
July/August 2020
  • Table of Contents
  • Index by author
Email

Thank you for sharing this eNeuro article.

NOTE: We request your email address only to inform the recipient that it was you who recommended this article, and that it is not junk mail. We do not retain these email addresses.

Enter multiple addresses on separate lines or separate them with commas.
Electric Field Application In Vivo Regulates Neural Precursor Cell Behavior in the Adult Mammalian Forebrain
(Your Name) has forwarded a page to you from eNeuro
(Your Name) thought you would be interested in this article in eNeuro.
CAPTCHA
This question is for testing whether or not you are a human visitor and to prevent automated spam submissions.
Print
View Full Page PDF
Article Alerts
Sign In to Email Alerts with your Email Address
Citation Tools
Electric Field Application In Vivo Regulates Neural Precursor Cell Behavior in the Adult Mammalian Forebrain
Elana Sefton, Stephanie N. Iwasa, Taylor Morrison, Hani E. Naguib, Milos R. Popovic, Cindi M. Morshead
eNeuro 27 July 2020, 7 (4) ENEURO.0273-20.2020; DOI: 10.1523/ENEURO.0273-20.2020

Citation Manager Formats

  • BibTeX
  • Bookends
  • EasyBib
  • EndNote (tagged)
  • EndNote 8 (xml)
  • Medlars
  • Mendeley
  • Papers
  • RefWorks Tagged
  • Ref Manager
  • RIS
  • Zotero
Respond to this article
Share
Electric Field Application In Vivo Regulates Neural Precursor Cell Behavior in the Adult Mammalian Forebrain
Elana Sefton, Stephanie N. Iwasa, Taylor Morrison, Hani E. Naguib, Milos R. Popovic, Cindi M. Morshead
eNeuro 27 July 2020, 7 (4) ENEURO.0273-20.2020; DOI: 10.1523/ENEURO.0273-20.2020
del.icio.us logo Digg logo Reddit logo Twitter logo CiteULike logo Facebook logo Google logo Mendeley logo
  • Tweet Widget
  • Facebook Like
  • Google Plus One

Jump to section

  • Article
    • Abstract
    • Significance Statement
    • Introduction
    • Materials and Methods
    • Results
    • Discussion
    • Conclusion
    • Acknowledgments
    • Footnotes
    • References
    • Synthesis
  • Figures & Data
  • Info & Metrics
  • eLetters
  • PDF

Keywords

  • cell survival
  • EGFR
  • electrical stimulation
  • neural stem cells
  • quiescence
  • sFRP2

Responses to this article

Respond to this article

Jump to comment:

No eLetters have been published for this article.

Related Articles

Cited By...

More in this TOC Section

Research Article: New Research

  • Context Memory Encoding and Retrieval Temporal Dynamics Are Modulated by Attention across the Adult Lifespan
  • Neural correlates of vocal auditory feedback processing: Unique insights from electrocorticography recordings in a human cochlear implant user
  • Transmembrane Prolyl 4-Hydroxylase is a Novel Regulator of Calcium Signaling in Astrocytes
Show more Research Article: New Research

Neuronal Excitability

  • Subunit-specific photocontrol of glycine receptors by azobenzene-nitrazepam photoswitcher
  • Calmodulin Bidirectionally Regulates Evoked and Spontaneous Neurotransmitter Release at Retinal Ribbon Synapses
  • Cell-Type Specificity of Neuronal Excitability and Morphology in the Central Amygdala
Show more Neuronal Excitability

Subjects

  • Neuronal Excitability
  • Home
  • Alerts
  • Visit Society for Neuroscience on Facebook
  • Follow Society for Neuroscience on Twitter
  • Follow Society for Neuroscience on LinkedIn
  • Visit Society for Neuroscience on Youtube
  • Follow our RSS feeds

Content

  • Early Release
  • Current Issue
  • Latest Articles
  • Issue Archive
  • Blog
  • Browse by Topic

Information

  • For Authors
  • For the Media

About

  • About the Journal
  • Editorial Board
  • Privacy Policy
  • Contact
  • Feedback
(eNeuro logo)
(SfN logo)

Copyright © 2021 by the Society for Neuroscience.
eNeuro eISSN: 2373-2822

The ideas and opinions expressed in eNeuro do not necessarily reflect those of SfN or the eNeuro Editorial Board. Publication of an advertisement or other product mention in eNeuro should not be construed as an endorsement of the manufacturer’s claims. SfN does not assume any responsibility for any injury and/or damage to persons or property arising from or related to any use of any material contained in eNeuro.