

Article Figures & Data
Figures
- Figure 1.
Farnesene-alone produces reward-related behavior in male and female mice. A1,2, Male and female mice were administered saline or farnesene at doses of 0.1, 1.0, or 10 mg/kg in a CPP assay. B1,2, Male and female mice were administered saline or 0.1 mg/kg farnesene in an open field locomotor assay. All data are mean ± SEM; *p < 0.05, **p < 0.01, ****p < 0.0001; one-way ANOVA with post hoc Tukey (A) or unpaired t test (B). Exact p values are given in Results. Number of mice for each treatment group in CPP assays is indicated in parenthesis. Dots within bars represent the CPP scores or locomotor activity from individual mice within the designated treatment groups.
- Figure 2.
Farnesene (0.1 mg/kg) enhances nicotine reward-related behavior in both sexes. A, B, Male and female mice were administered saline, nicotine (0.5 mg/kg), or nicotine (0.5 mg/kg) plus farnesene (0.1 mg/kg) in a CPP assay. All data are mean ± SEM; *p < 0.05, **p < 0.01, ***p < 0.005; one-way ANOVA with post hoc Tukey. Exact p values are given in Results. Number of mice for each treatment group is indicated in parenthesis, and dots within bars represent the CPP scores from individual mice within the designated treatment group.
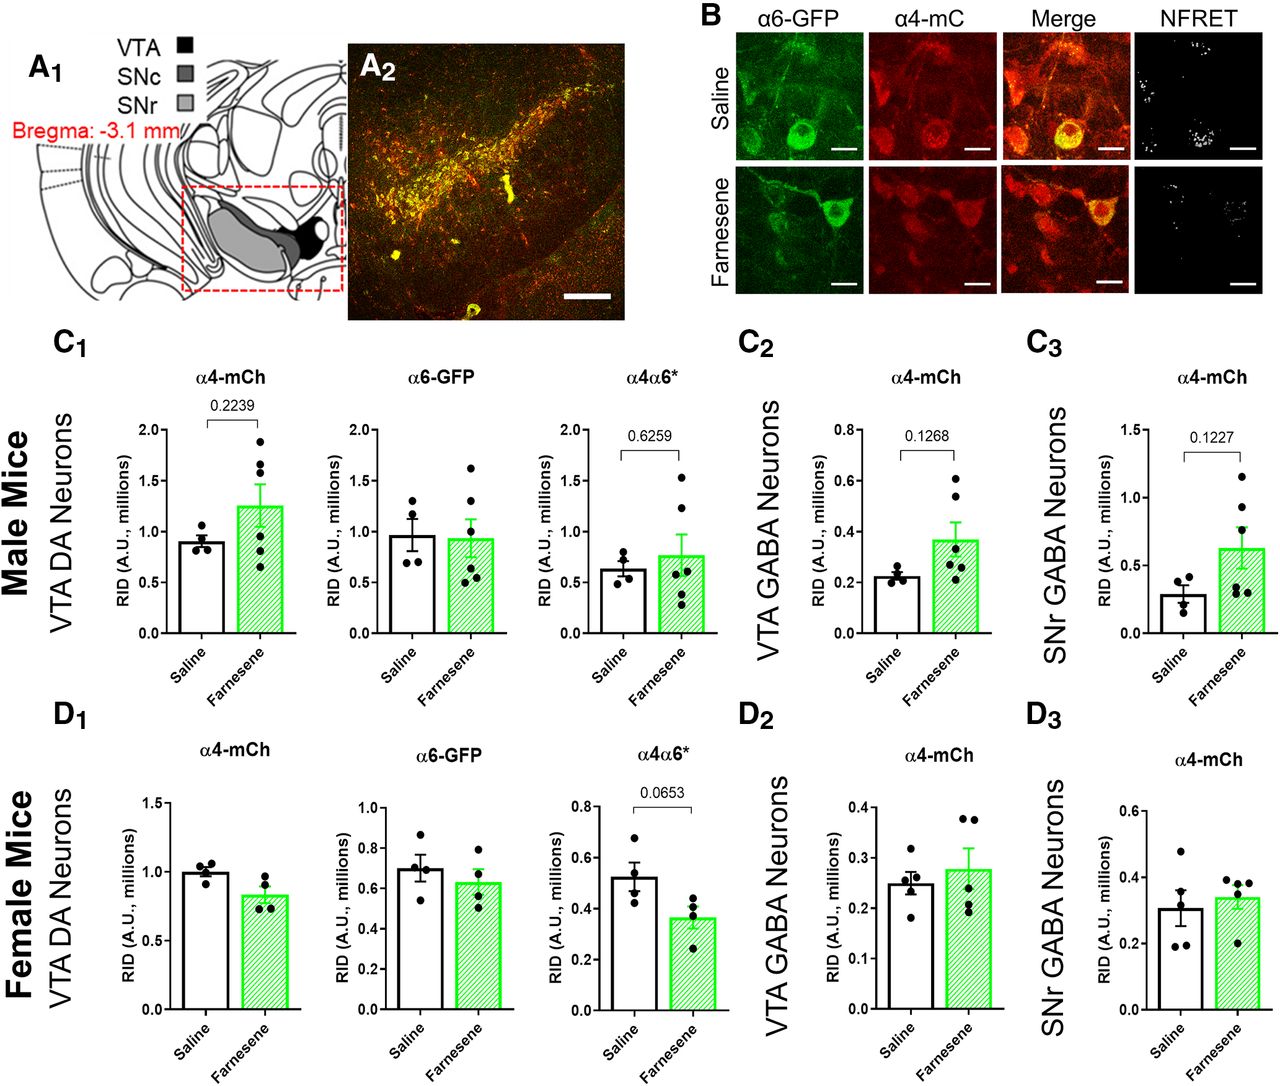
- Figure 3.
Farnesene treatment has no effect on nAChR number in the midbrain. A1, Schematic of target mouse brain region (bregma −3.1 mm). A2, Sample 10× image of a mouse coronal brain section at approximately bregma −3.1 mm. Scale bar, 250 μm. B, Sample images of saline and farnesene treated VTA dopamine neurons. Scale bar, 15 μm. C, D, RID of α4*, α6*, and α4α6* nAChRs of VTA dopamine neurons (C1, D1), α4* nAChRs of VTA GABA neurons (C2, D2), and α4* nAChRs of SNr GABA neurons (C3, D3) in saline-treated and farnesene-treated (0.1 mg/kg) male (C) and female (D) mice. All data are mean ± SEM. Unpaired t test. Dots indicate the RID values from individual mice.
- Figure 4.
Farnesene alters the stoichiometry of α4α6β2* nAChRs in VTA DA neurons. Mean NFRET percentage (A1, B1,), mean NFRET pixel count (A2, B2), and mean pixels/neuron histograms (A3, B3) for saline-treated and farnesene-treated (0.1 mg/kg) VTA dopamine neurons in male (A) and female (B) mice. All data are mean ± SEM; *p < 0.05; unpaired t test. Exact p values are given in Results. Dots within bars represent the values from individual mice within the designated treatment group; n > 40 neurons per mouse per treatment group.
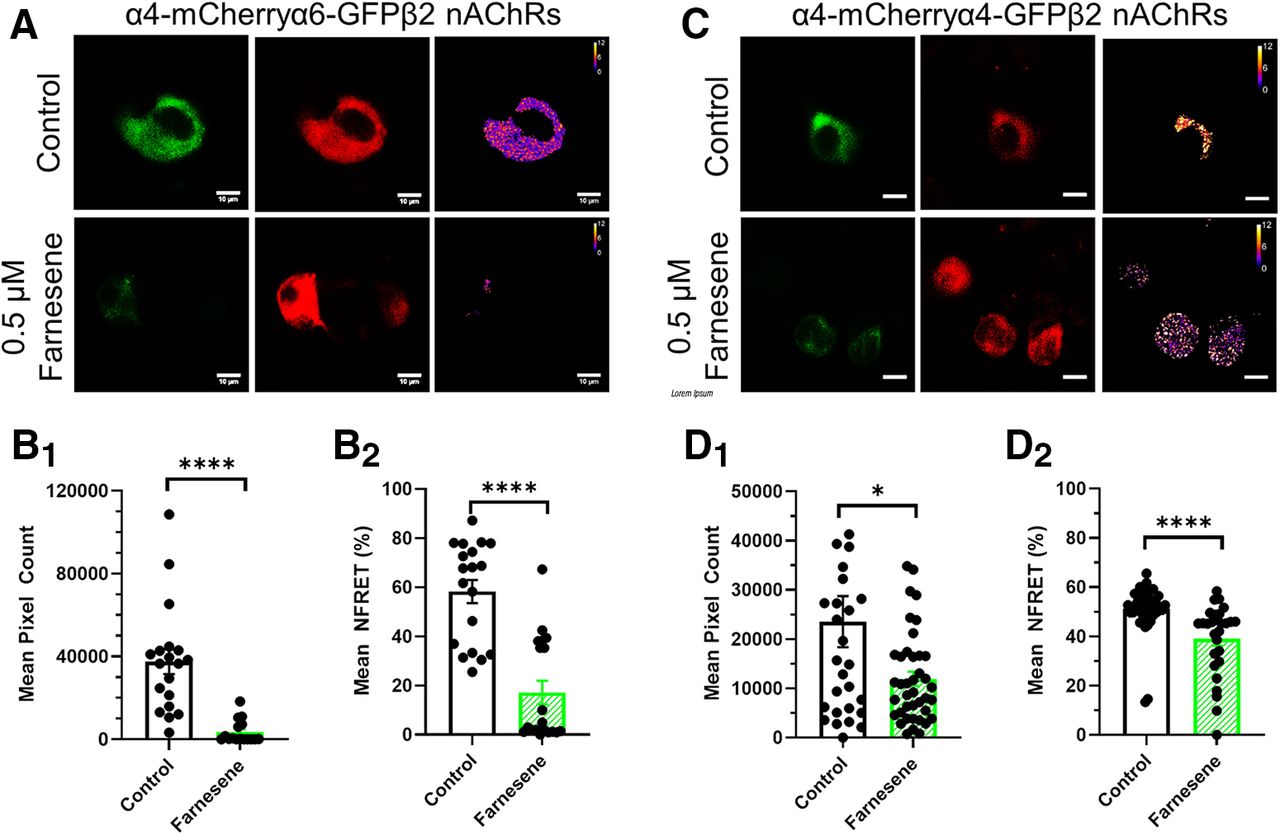
- Figure 5.
Farnesene favors high-sensitivity nAChRs in neuro-2a cells. Representative neuro-2a cells transfected with α4-mCherry, α4-GFP or α6-GFP, and β2wt nAChR subunits to produce (A) α4-mCherryα6-GFPβ2 nAChRs or (C) α4-mCherryα4-GFPβ2 nAChRs. Scale bar, 10 μm. Mean NFRET pixel count (B1, D1) and NFRET percentage (B2, D2) treated as control or with 0.5 μm farnesene for (A) α4-mCherryα6-GFPβ2 nAChRs or (C) α4-mCherryα4-GFPβ2 nAChRs. All data are mean ± SEM; *p < 0.05, ****p < 0.001; unpaired t test. Exact p values are given in Results. Dots within bars represent the values from individual cells within the designated treatment group; n > 30 cells per condition.
- Figure 6.
Farnesene favors high-sensitivity nAChRs in neuro-2a cells. A, α4β2 nAChRs assemble in two stoichiometries, and we observed that farnesene treatment shifts a mixed population of HS and LS α4β2 nAChRs to a majority of HS α4β2 nAChRs. B, In examining α4α6β2 nAChRs, under control treatments, ∼65% of the population are α4α6β2 nAChRs while the remainder is likely α4β2 nAChRs. Following treatment with farnesene, <14% of the nAChRs are α4α6β2 nAChRs.
- Figure 7.
Farnesene enhances the affinity and potency of nicotine. Representative images of VTA pDA neurons in a brain slice (bregma −3.1) were identified through the presence of α6-GFP nAChRs in IR-DIC (A1) and GFP fluorescence (A2) imaging modes. Scale bars, 20 μm. B, Representative inward currents from VTA pDA neurons (α6-GFP-positive) with 10-s applications of 500 nm (B1) or 10 μm (B2) nicotine in voltage-clamp mode. Arrows indicate start of nicotine puff application and dotted red lines indicate baseline before puff and the duration of nicotine application. C, Average nicotine concentration response of peak-current amplitude of VTA pDA neurons (n = 7 neurons/4 mice and 5 neurons/3 mice per nicotine concentration for saline-treated and farnesene-treated mice, respectively). D, Representative waveforms of sEPSCs from VTA pDA neurons recorded from saline-treated or farnesene-treated mice in the presence of 30 μm picrotoxin. E, Mean sEPSC frequency (E1) and amplitude (E2) in saline-treated and farnesene-treated mouse brain slices (n = 9 neurons/4 mice and 9 neurons/3 mice for saline-treated and farnesene-treated mice, respectively). For all assays, drug treatments were consistent with the CPP assay paradigm using 0.1 mg/kg farnesene. C, EI,2, Data are mean ± SEM *p < 0.05, ****p < 0.0001; unpaired t test. Exact p values are given in Results. Dots within bars represent the values from individual neurons within the designated treatment group.
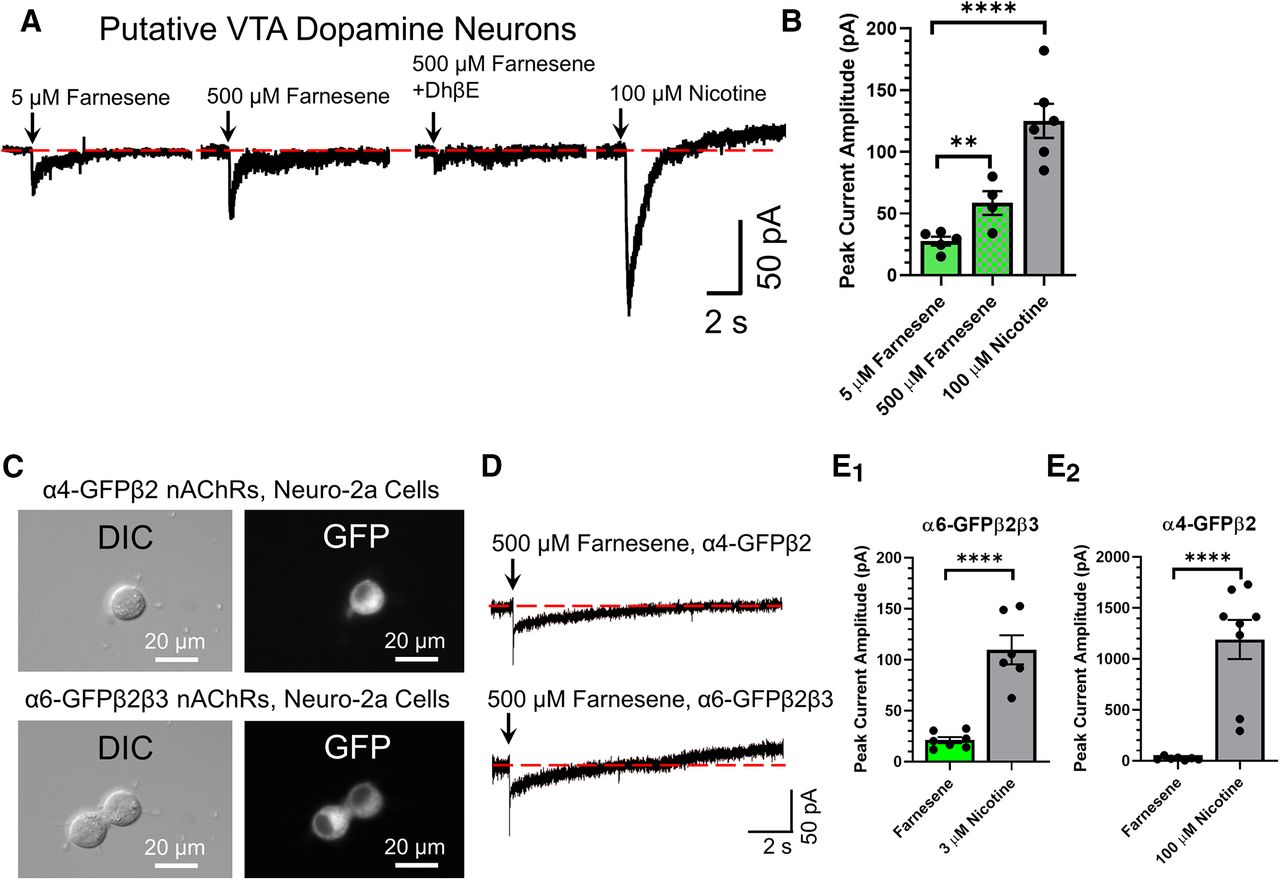
- Figure 8.
Farnesene acts as a partial agonist on nAChRs. A, B, Voltage-clamp recordings from putative VTA dopamine neurons. A, Five and 500 μm farnesene and 100 μm nicotine were applied to putative VTA dopamine neurons. The β2* nAChR antagonist, DhβE (0.3 μm) blocked inward currents stimulated by 500 μm farnesene. B, Mean peak current amplitude for farnesene and nicotine applications on pDA neurons in the VTA. C–E, Voltage-clamp recordings from neuro-2a cells transiently transfected to contain α4-GFPβ2 and α6-GFPβ2β3 nAChRs. C, Representative images of neuro-2a cells that contain α4-GFPβ2 or α6-GFPβ2β3 nAChRs. D, Representative inward currents stimulated by 300-ms applications of 500 μm farnesene on neuro-2a cells containing α4-GFPβ2 or α6-GFPβ2β3 nAChRs. E1,2, Mean peak current amplitude of 500 μm farnesene and nicotine applications (3 and 100 μm nicotine for α6-GFPβ2β3 and α4-GFPβ2 nAChRs, respectively) on neuro-2a cells containing nAChRs. B, E1,2, Data are mean ± SEM; **p < 0.01, ****p < 0.0001; one-way ANOVA with post hoc Tukey (B) or unpaired t test (E). Dots represent data from individual neurons or cells. Exact p values are given in Results.


Tables
Figure Type of test Interaction/main effect Statistical data 1, 2 Two-way
ANOVASex × drug F(5,88) = 3.045, p = 0.0140 1, 2 Two-way ANOVA Sex F(1,88) = 10.55, p = 0.0016 1, 2 Two-way ANOVA Drug F(5,88) = 12.21, p < 0.0001 1A1 One-way ANOVA F(3,30) = 5.98, p = 0.0025 1A1 Post hoc
TukeySaline vs 0.1 mg/kg; p = 0.0065 1A1 Post hoc
TukeySaline vs 1.0 mg/kg; p = 0.9997 1A1 Post hoc
TukeySaline vs 10 mg/kg; p = 0.9770 1A1 Post hoc
Tukey0.1 vs 1.0 mg/kg; p = 0.0203 1A1 Post hoc
Tukey0.1 vs 10 mg/kg; p = 0.0047 1A1 Post hoc
Tukey1.0 vs 10 mg/kg; p = 0.9680 1A2 One-way ANOVA F(3,25) = 9.81, p = 0.0002 1A2 Post hoc
TukeySaline vs 0.1 mg/kg; p < 0.0001 1A2 Post hoc
TukeySaline vs 1.0 mg/kg; p = 0.0126 1A2 Post hoc
TukeySaline vs 10 mg/kg; p = 0.0402 1A2 Post hoc
Tukey0.1 vs 1.0 mg/kg; p = 0.4631 1A2 Post hoc
Tukey0.1 vs 10 mg/kg; p = 0.2245 1A2 Post hoc
Tukey1.0 vs 10 mg/kg; p = 0.9669 1B1 Unpaired
t testSaline vs farnesene (males), p = 0.111 1B2 Unpaired
t testSaline vs farnesene (females), p = 0.801 2A One-way ANOVA F(2,23) = 8.506, p = 0.0017 2A Post hoc
TukeySaline vs nicotine; p = 0.0173 2A Post hoc
TukeySaline vs nicotine + farnesene; p = 0.0022 2A Post hoc
TukeyNicotine vs nicotine + farnesene; p = 0.4280 2B One-way ANOVA F(2,25) = 13.04, p = 0.0001 2B Post hoc
TukeySaline vs nicotine; p = 0.2916 2B Post hoc
TukeySaline vs nicotine + farnesene; p = 0.0001 2B Post hoc
TukeyNicotine vs nicotine + farnesene; p = 0.0041 3C1 Unpaired
t test[α4, p = 0.2239], [α6, p = 0.9065], [α4α6, p = 0.6259] 3C2 Unpaired
t testp = 0.1268 3C3 Unpaired
t testp = 0.1227 3D1 Unpaired
t test[α4, p = 0.0515], [α6, p = 0.4842], [α4α6, p = 0.0653] 3D2 Unpaired
t testp = 0.5572 3D3 Unpaired
t testp = 0.6156 4A1 Unpaired
t testp = 0.6343 4A2 Unpaired
t testp = 0.7225 4B1 Unpaired
t testp = 0.5285 4B2 Unpaired
t testp = 0.0480 5B1 Unpaired
t testp < 0.0001 5B2 Unpaired
t testp < 0.0001 5D1 Unpaired
t testp = 0.0149 5D2 Unpaired
t testp < 0.0001 7E1 Unpaired
t testp = 0.0002 7E2 Unpaired
t testp < 0.0001 8B One-way ANOVA F(2,12) = 23.05, p < 0.0001 8B Post hoc
Tukey5 μm farnesene vs 500 μm farnesene; p = 0.1823 8B Post hoc
Tukey5 μm farnesene vs 100 μm nicotine; p < 0.0001 8B Post hoc
Tukey500 μm farnesene vs 100 μm nicotine, p = 0.0031 8E1 Unpaired
t testp < 0.0001 8E2 Unpaired
t testp < 0.0001 Input parameters Output parameters Test family F tests Noncentrality parameter 16.94 Test type ANOVA: one-way Critical F 2.21 Type of analysis A priori Numerator df 7 Effect size 0.55 Denominator df 48 α err prob 0.05 Total sample size 56 Power 0.8 Sample size/group 7 Number of groups 8 Actual Power 0.811 Sample size indicates number of mice needed per treatment group.
Input parameters Output parameters Test family t tests (two tails) Noncentrality parameter 3.21 Test type Biserial model Critical t 2.23 Type of analysis A priori df 10 Effect size 0.68 Total sample size 12 α err prob 0.05 Sample size/group 6 Power 0.8 Actual power 0.825 Number of groups 2 Sample size indicates the number of neurons/cells needed for sufficient power.
Input parameters Output parameters Test family t tests (two tails) Noncentrality parameter 3.53 Test type Biserial model Critical t 2.57 Type of analysis A priori df 5 Effect size 0.8 Total sample size 7 α err prob 0.05 Sample size/group ≥3 Power 0.8 Actual Power 0.803 Number of groups 2 Sample size indicates number of mice needed per treatment group.
Input parameters Output parameters Test family t tests (two tails) Noncentrality parameter 3.25 Test type Biserial model Critical t 2.26 Type of analysis A priori df 9 Effect size 0.7 Total sample size 11 α err prob 0.05 Sample size/group 6–7 Power 0.8 Actual Power 0.823 Number of groups 2 Sample size indicates the number of neurons needed for sufficient power.
Input parameters Output parameters Test family t tests (two tails) Noncentrality parameter 3.40 Test type Biserial model Critical t 2.36 Type of analysis A priori df 7 Effect size 0.75 Total sample size 9 α err prob 0.05 Sample size/group ≥5 Power 0.8 Actual Power 0.830 Number of groups 2 Sample size indicates the number of neurons/cells needed for sufficient power.
In this issue


