

Article Figures & Data
- Figure 1.
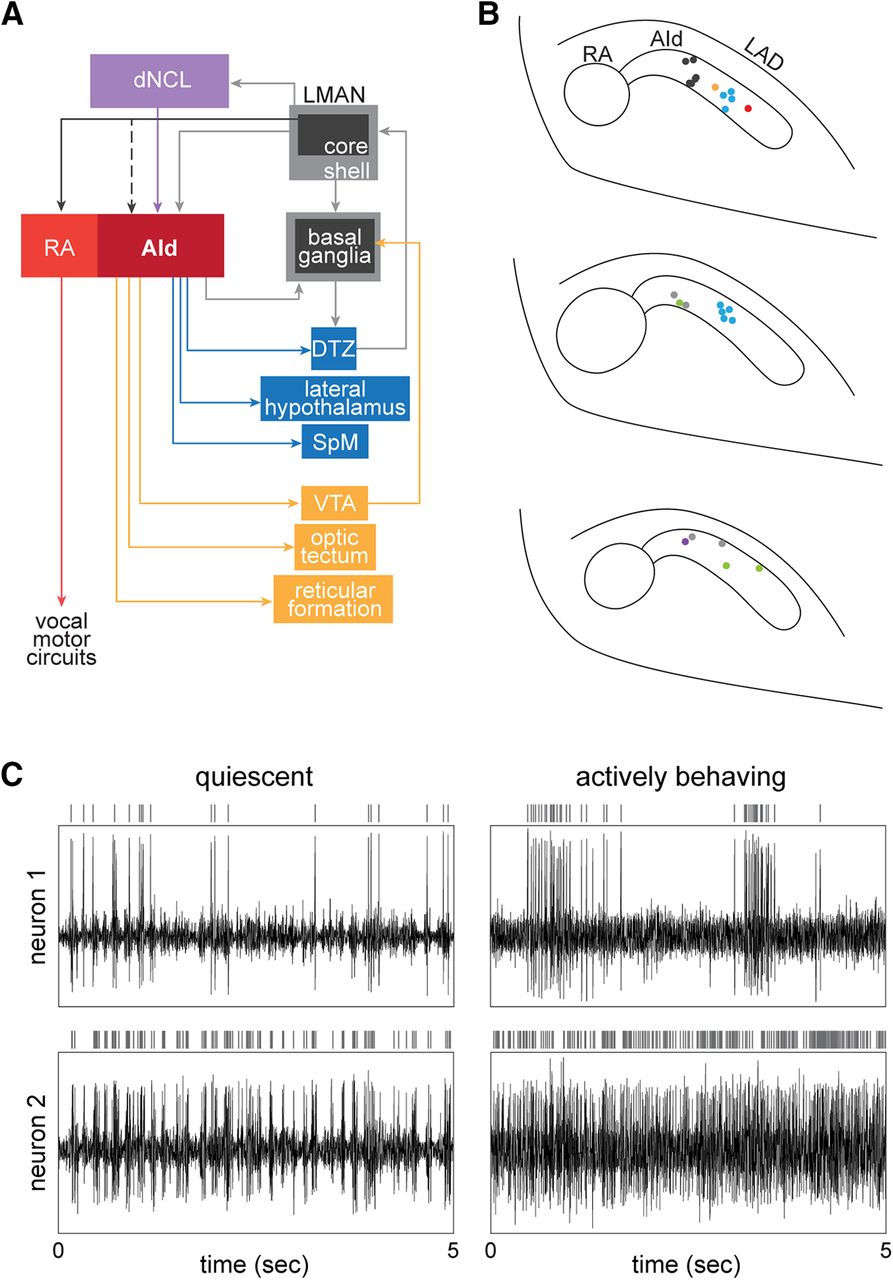
AId neurons are well situated to integrate multimodal inputs and distribute information across various cortical-subcortical circuits. A, AId receives inputs from upstream cortical regions LMAN-shell and dNCL. LMAN-shell is part of a cortico-basal ganglia loop that mediates vocal learning, whereas dNCL receives inputs from LMAN-shell as well as multiple pathways processing somatosensory, visual, and auditory information. AId of juvenile birds also receives inputs from LMAN-core via axon collaterals of LMAN-core→RA neurons that drive vocal output; robust collaterals are present in juvenile birds before ∼40–45 dph but are not present in older juvenile or adult birds. Projections from AId to striatum and several midbrain and thalamic regions give rise to both feedback and feed-forward pathways, creating several opportunities for information transfer between cortical and subcortical regions. DTZ, dorsal thalamic zone (includes both DLM and DMP); LMAN, lateral magnocellular nucleus of the anterior nidopallium; RA, robust nucleus of the arcopallium. B, top to bottom, Caudal-to-rostral series of coronal sections 250 μm apart mapping locations of recordings made in AId. Different colored circles represent sites recorded from different birds (n = 7). C, Raw traces of extracellular activity simultaneously recorded at two different sites within AId of a juvenile bird (44 dph) while the bird was resting (left column; “quiescent”) versus hopping around the recording cage (right column; “actively behaving”). Vertical lines above each raw activity trace indicate spikes from a single neuron sorted from the extracellular activity.
- Figure 2.
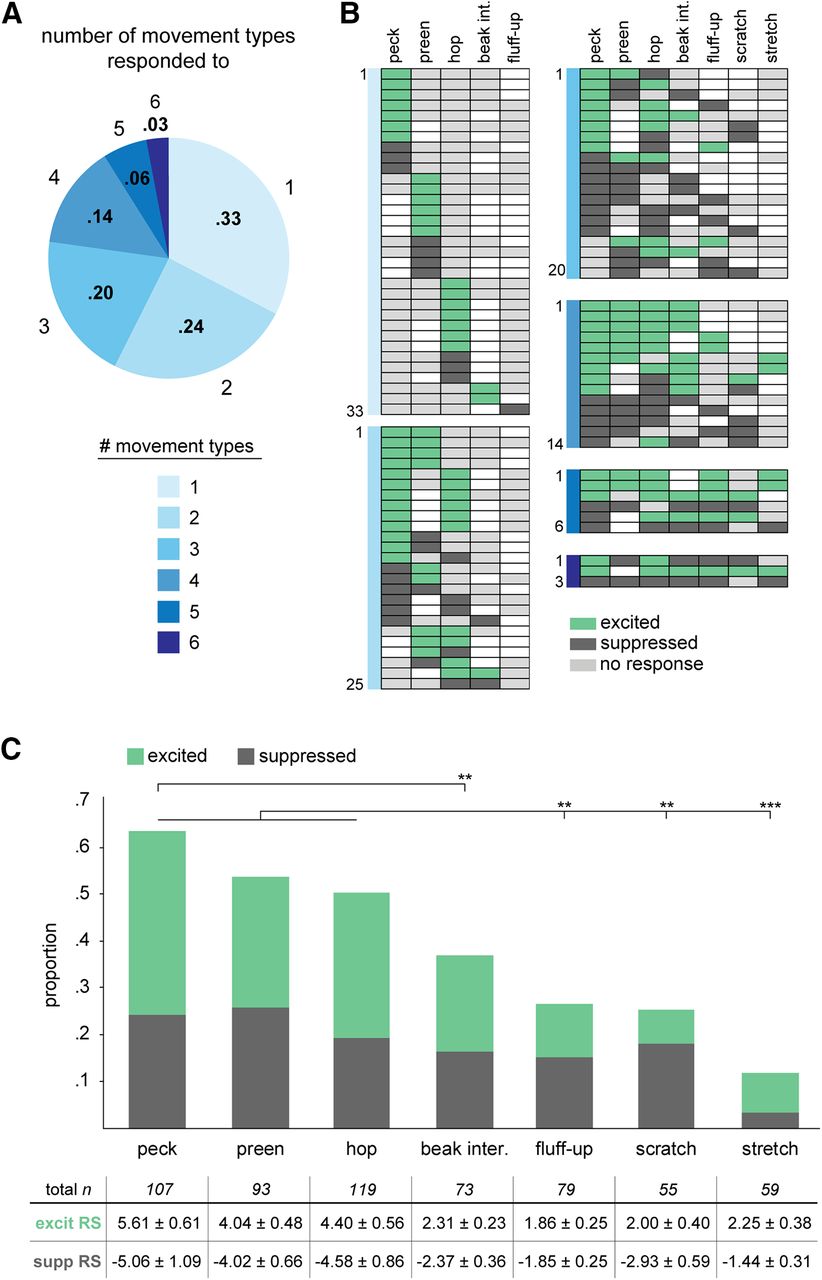
AId neurons respond during different scored movements with excitation and/or suppression. A, Proportions of single AId neurons that responded during different numbers of movements. 33/101 movement-responsive neurons responded during one movement, 25/101 during two, 20/101 during three, 14/101 during four, 6/101 during five, and 3/101 during six movements. B, Each row of each chart indicates movements during which each neuron was excited (green), suppressed (dark gray), or not responsive (light gray). Unfilled boxes indicate that no data during that movement was recorded for that neuron. Charts are grouped according to colors in A, based on the number of movements during which neurons responded. C, Proportions of AId neurons that were significantly excited (green) or suppressed (dark gray) during each movement type. Table below indicates the number of neurons recorded during each movement type and the corresponding excited and suppressed RSs (mean standardized RS ± SEM); **p < 0.005, ***p < 0.0001.
- Figure 3.
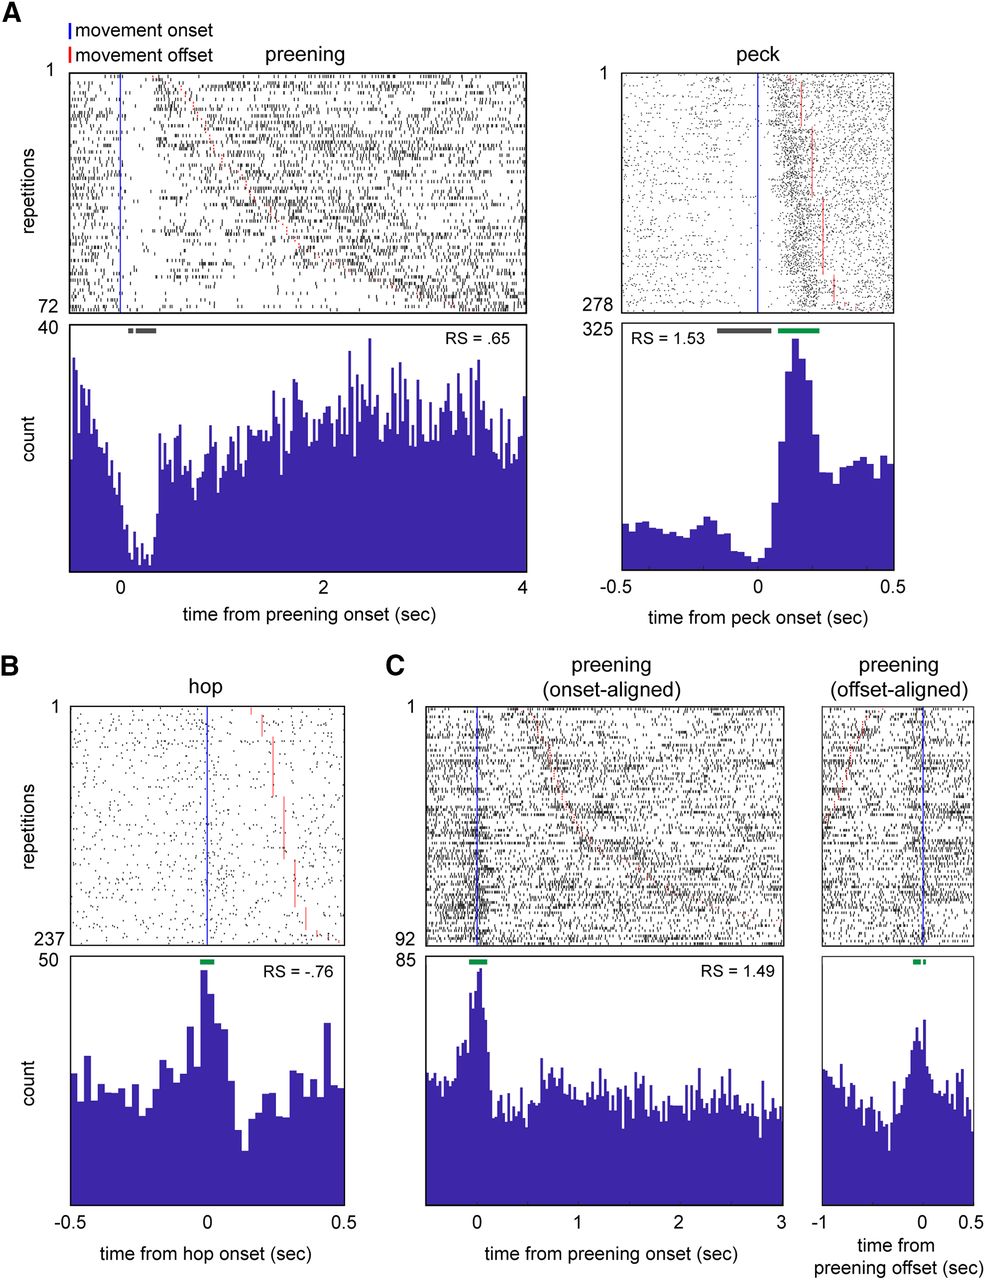
AId neurons show a variety of temporal response patterns during different scored movements. A, Rasters and histograms illustrating the response of a single AId neuron during preening (left) and pecks (right). B, Raster and histogram illustrating the response of a single AId neuron during hops. C, Rasters and histograms illustrating the onset-aligned (left) and offset-aligned (right) preening response of an example AId neuron. Rows are sorted by movement duration. Blue vertical lines mark movement onsets; red lines mark movement offsets. Green and gray horizontal bars above histograms denote periods of excitation or suppression, respectively (see Materials and Methods). RS, average standardized response strength over the entire duration of each movement type.
- Figure 4.
AId neurons exhibit context-sensitive peck responses. A, Mean standardized RSs of neurons during pecks that occurred during eating versus non-eating periods, grouped by neurons that showed greater absolute RS during eating (left) and non-eating (right). Left, Gray and black lines represent neurons that showed positive or negative RS, respectively, during eating-pecks. Right, Gray and black lines represent neurons that showed positive or negative RS, respectively, during non-eating pecks. Horizontal bars represent medians. RSs during eating-related pecks were significantly different from non-eating pecks for all plotted neurons (Mann–Whitney tests). B, Rasters and histograms of an example neuron’s response during pecks that occurred during eating (left) versus non-eating (right). Peck RS of this neuron is indicated by the cross-marked plot point in A, left. Rows are sorted by peck duration. Blue vertical lines mark peck onsets; red lines mark peck offsets.
- Figure 5.
A substantial population of AId neurons are responsive during singing. A, Raster and histogram illustrating activity of an example singing-excited AId neuron during singing episodes. Rows are sorted by duration of each singing episode. Blue vertical line marks onset of each singing episode; red lines mark ends of singing episodes. B, Proportions of 36 singing-responsive neurons for which RS during head movements within singing periods was greater than (orange), less than (gray), or not different from (blue) head movements within non-singing periods. C, Mean standardized RSs during head movements that occurred within singing versus non-singing periods. Left, Neurons that showed comparable RS during head movements that occurred within singing versus non-singing periods. Right, Neurons that showed higher RS during head movements that occurred within singing (orange) or non-singing (gray) periods. Lines connect data points from single neurons. Horizontal bars represent medians. Circles versus triangles represent neurons that showed an increase or decrease, respectively, in average firing rate across singing episodes relative to quiescence (see Tables 2-4).
- Figure 6.
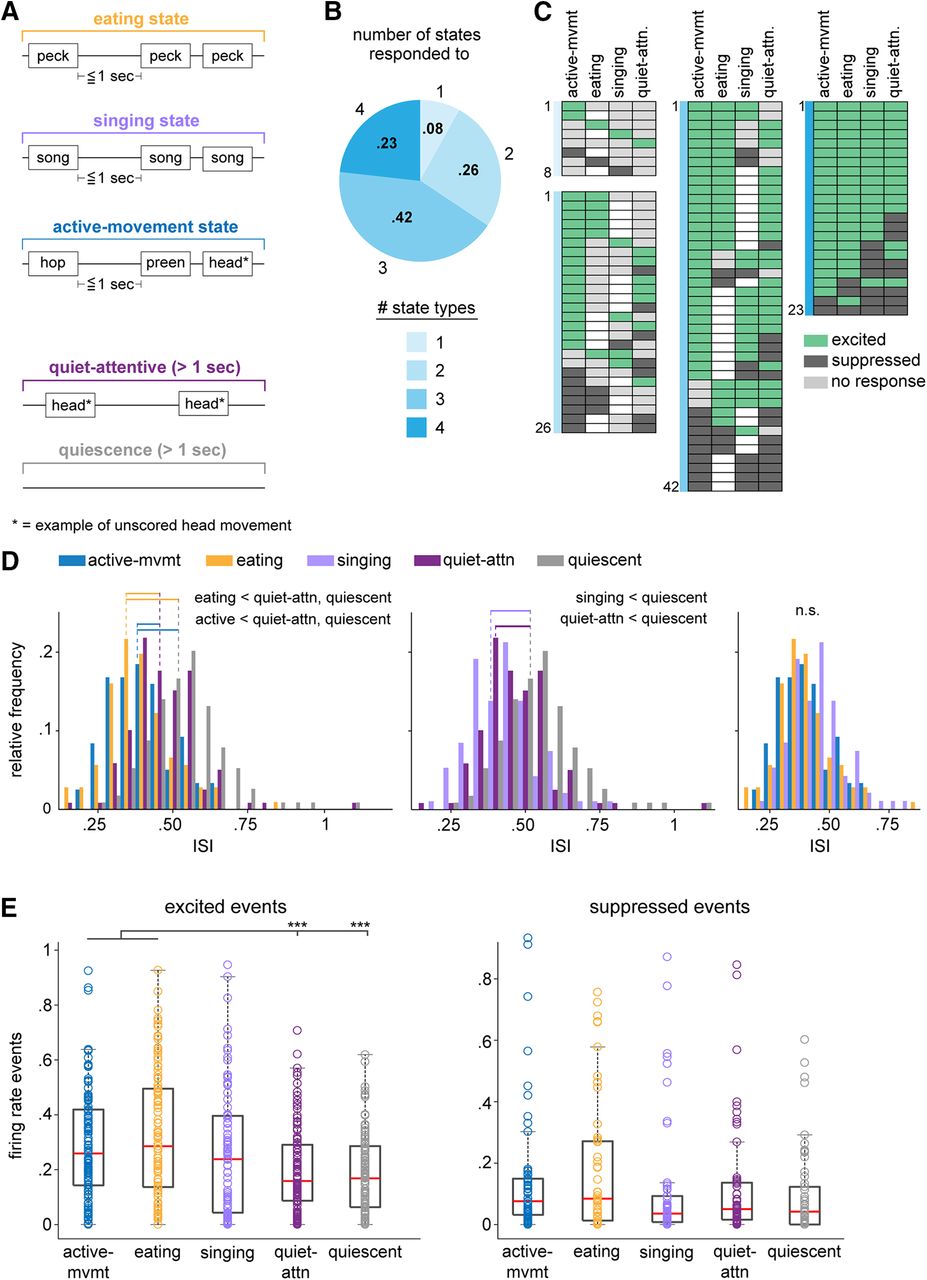
AId neurons are differentially modulated during different behavioral states. A, Schematics of example eating, singing, active-movement, quiet-attentive, and quiescent states. Text boxes represent example scored and unscored (starred) movements that typically occurred within that state type, although other behaviors could also occur (see Materials and Methods). B, Proportions of single AId neurons that were modulated during different numbers of state types. 8/99 state-responsive neurons were modulated during one state type, 26/99 during two, 42/99 during three, and 23/99 during four states. C, Each row of each chart indicates the states during which each neuron was excited (green), suppressed (dark gray), or not responsive (light gray). Unfilled boxes indicate that no data during that state was recorded for that neuron. Charts are grouped according to colors in B, based on the number of states during which activity of neurons was modulated. D, Histograms comparing distributions of ISIs during active-movement, eating, quiet-attentive, and quiescent states (left); singing, quiet-attentive, and quiescent states (middle); active-movement, eating, and singing states (right). Horizontal lines indicate distributions that had significantly different means; dotted lines indicate means of the respective distributions. p < 0.001 for all significant differences. E, Number of excited (left) and suppressed (right) events that occurred during each state type, normalized by the total duration of each state type in a given recording session. Box-and-whisker plots indicate medians and first and third quartiles; whiskers indicate data points not considered outliers; circles represent data points from individual neurons; ***p < 0.001.
- Figure 7.
Movement-excited AId neurons are modulated by scored and unscored factors during different state periods. A, Relative proportions of scored behaviors that occurred during each state type. Proportion totals include all occurrences of each of the seven scored movements as well as all song bouts. B, left, Peck responsivity of 48 neurons that were significantly excited during eating state periods. Right, Proportions of eating-excited neurons that were responsive during scored behaviors, categorized by peck responsivity: eating-excited neurons that were peck-excited (left), peck-suppressed (middle), and unresponsive during pecks (right). “No other movement” represents neurons that did not respond during any other scored behavior. C, left, Song-bout responsivity of 37 neurons that were significantly excited during singing state periods. Right, Proportions of singing state-excited neurons that were responsive during scored movements, categorized by song responsivity: singing state-excited neurons that were song-excited (left), song-suppressed (middle), and unresponsive during song bouts (right). “No other movement” represents neurons that did not respond during any other scored behavior. Italicized numbers indicate number of neurons within each song-responsivity grouping.
- Figure 8.
AId neurons that lack responsivity during scored movements are nonetheless modulated during different states. A, Proportions of non-responsive AId neurons that were modulated during different numbers of state types. 3/18 neurons were not modulated during any states; 1/18 was modulated during one state type, 5/18 during two, 6/18 during three, and 3/18 during four state types. B, Proportions of non-responsive neurons that were significantly excited (green) or suppressed (dark gray) during each state type. Italicized numbers indicate number of non-responsive neurons recorded during each state type.


- Table 1
Proportions of onset and offset responses across all neurons for different movement types
Peck-onset responses(±100 ms from peck onset) Hop-onset responses(±100 ms from hop onset) Preening-onset responses(±100 ms from preeningonset) Response basedon averagefiring rate Excited(7) Suppressed(4) Excited(4) Suppressed(1) Excited(3) Suppressed(1) Excited 0.05 (5/107) 0.04 (4/107) 0.01 (1/119) 0 0.03 (3/93) 0.01 (1/93) Not significant 0.02 (2/107) 0 0.02 (2/119) 0 0 0 Suppressed 0 0 0.01 (1/119) 0.01 (1/119) 0 0 Peck-offset responses(±100 ms from peck offset) Preening-offset responses(±100 ms from preeningoffset) Response basedon averagefiring rate Excited(4) Suppressed(2) Excited(3) Suppressed(0) Excited 0.04 (4/107) 0.01 (1/107) 0.01 (1/93) 0 Not significant 0 0 0.01 (1/93) 0 Suppressed 0 0.01 (1/107) 0.01 (1/93) 0 Onset responses (top) and offset responses (bottom) are shown separately (total n = 29 responses), categorized based on whether average firing rate during the movement showed significant excitation (excited), suppression (suppressed), or no response (not significant).
- Table 2
Mean standardized RS during singing periods with versus without head movements (n = 24 neurons that showed comparable firing rates during head movements that occurred within singing and non-singing periods)
Singing w/ headmovements > singing w/out head movements(n = 8/24) Singing w/ headmovements = singing w/out head movements
(n = 14/24)Singing w/ headmovements < singing w/out head movements(n = 2/24) Excited(7*) Suppressed(1) Excited(12) Suppressed(2) Excited(1) Suppressed(1) Singing w/ movements 0.47 ± 0.04 –1.75 1.08 ± 0.22 –0.67 ± 0.10 0.24 –0.74 Singing w/out movements 0.29 ± 0.03 –0.69 0.62 ± 0.10 –0.41 ± 0.17 0.49 –0.87 Neurons are categorized by whether RS during singing that included head movements was greater than (left), equal to (middle), or lower than (right) RS during singing that lacked head movements. Responses are significantly different from quiescence unless otherwise noted (*). Blue lines in Fig. 5C, left, depict head movement responses.
* 3/7 neurons were significantly excited during singing periods that contained head movements but not during singing periods that lacked head movements.
- Table 3
Mean standardized RS during singing periods with versus without head movements (n = 6 neurons that showed greater RS during head movements that occurred within singing compared with non-singing periods)
Singing w/ headmovements > singing w/out head movements(n = 3/6) Singing w/ headmovements = singing w/out head movements(n = 3/6) Singing w/ headmovements < singing w/out head movements(n = 0/6) Excited(3*) Suppressed(0) Excited(3) Suppressed(0) Excited(0) Suppressed(0) Singing w/ movements 0.84 ± 0.44 0.49 ± 0.08 Singing w/out movements 0.47 ± 0.20 0.32 ± 0.09 Neurons are categorized by whether RS during singing that included head movements was greater than (left), equal to (middle), or lower than (right) RS during singing that lacked head movements. Responses are significantly different from quiescence unless otherwise noted (*). Orange lines in Fig. 5C, right, depict head movement responses.
* 1/3 neurons was significantly excited during singing periods that contained head movements but not during singing periods that lacked head movements.
- Table 4
Mean standardized RS during singing periods with versus without head movements (n = 6 neurons that showed lower RS during head movements that occurred within singing compared with non-singing periods)
Singing w/ headmovements > singing w/out head movements(n = 3/6) Singing w/ headmovements = singing w/out head movements(n =1/6) Singing w/ headmovements < singing w/out head movements(n = 2/6) Excited(1) Suppressed(2) Excited(1) Suppressed(0) Excited(1) Suppressed(1) Singing w/ movements 0.35 –0.91 ± 0.70 0.44 0.44 –2.75 Singing w/out movements 0.10 –0.36 ± 0.34 0.24 0.74 –3.88 Neurons are categorized by whether RS during singing that included head movements was greater than (left), equal to (middle), or lower than (right) RS during singing that lacked head movements. All responses are significantly different from quiescence. Gray lines in Fig. 5C, right, depict head movement responses.
- Movie 1.
Example video of a juvenile zebra finch demonstrating the seven scored movements: pecks, beak interactions, preening, hopping, stretching, scratching, and fluff-ups. See Movie 2 for examples of pecking movements during eating versus non-eating periods.
- Movie 2.
Example video of a juvenile zebra finch during periods of active behavior, singing, and eating.
- Movie 3.
Example video of neural activity recorded on a single channel while the juvenile zebra finch hopped around the cage, demonstrating firing rate increases whenever the bird hopped towards the left side of the cage. This example suggests the possibility that hopping-related activity was context- or location-dependent, but we did not have enough examples to test this idea. Vertical lines above the raw activity trace indicate spikes from a single neuron sorted from the extracellular activity.
In this issue


