

Article Figures & Data
Figures
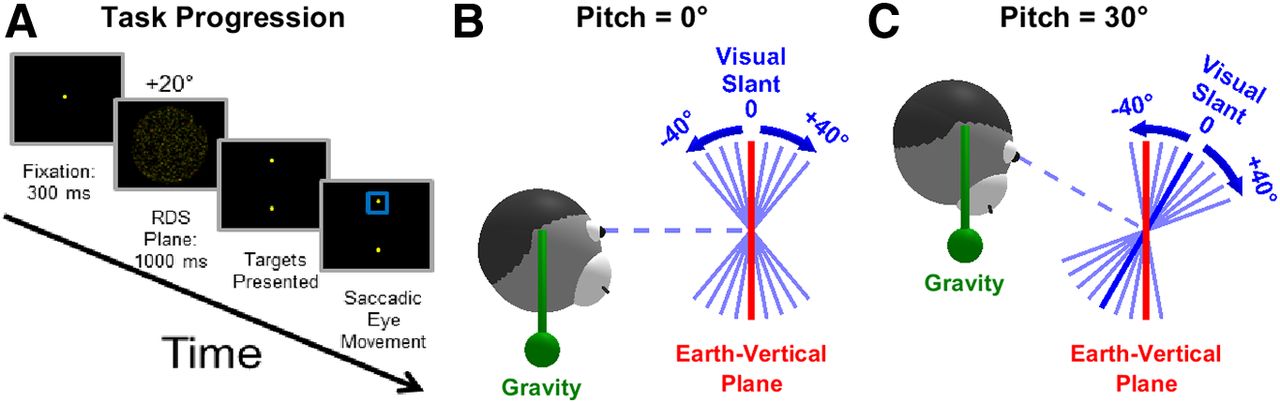
- Figure 1.
Overview of the task. A, Task flow diagram. Animals must fixate a central point for 300 ms, after which a RDS with a visual slant of ±40° (in intervals of 5°) is shown for 1000 ms. Animals must next report the allocentric orientation of the stereogram by performing an upward or downward saccade. B, C, Coordinate transformations involved in the task. The animals must use gravity sensing (symbolized by a green pendulum) to determine the orientation of the slanted visual stimulus (blue) relative to the allocentric earth-vertical plane (red). If animals perform the task perfectly, then the PSE occurs when the visual stimulus is aligned with the earth-vertical plane, i.e., at 0° slant in B and −30° slant in C.
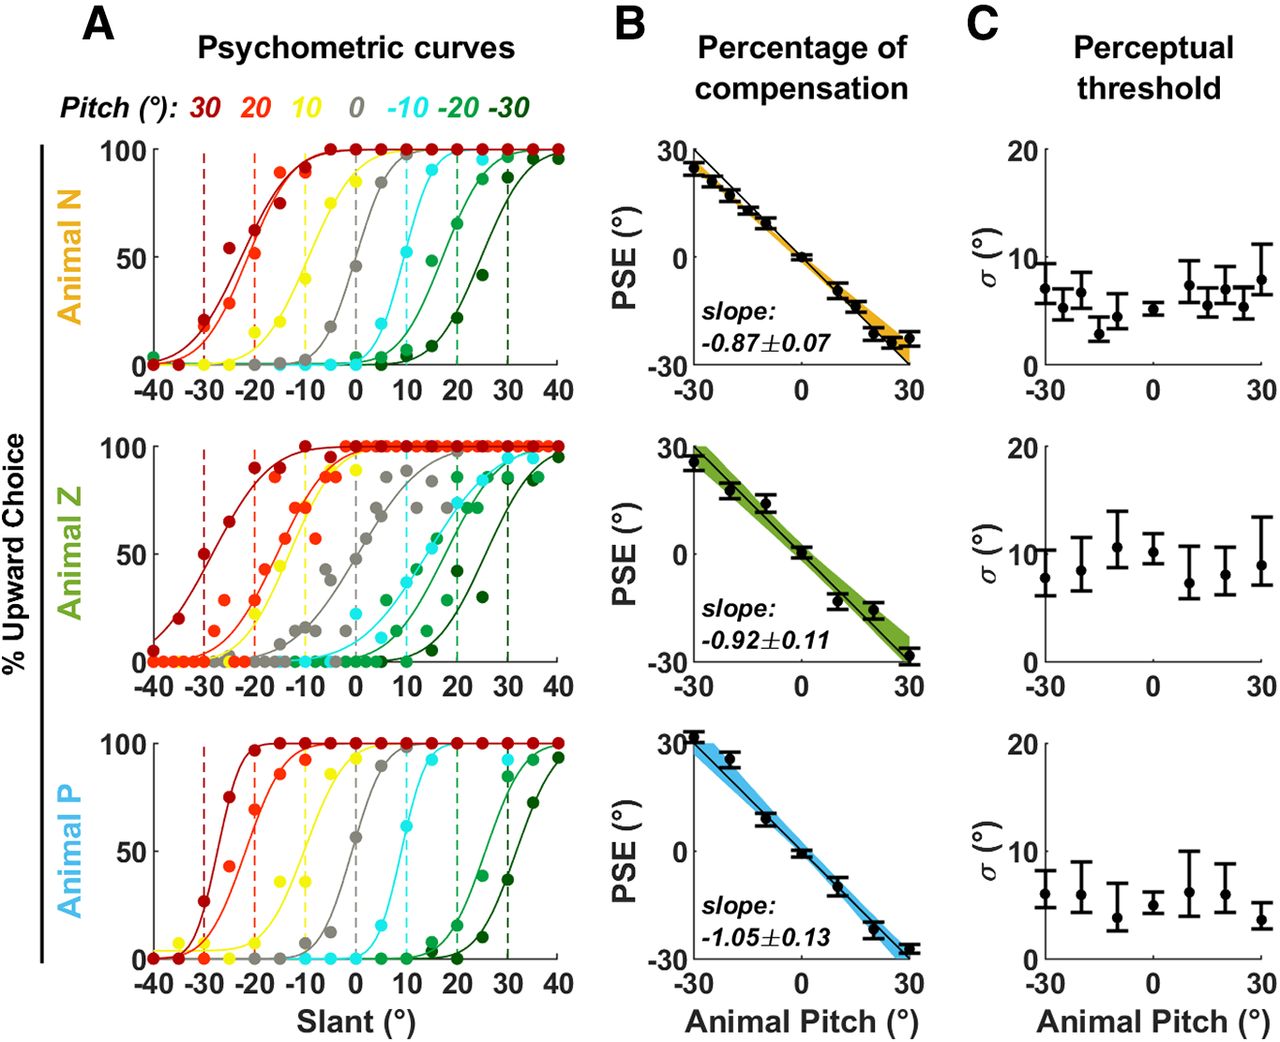
- Figure 2.
Summary of responses in intact animals. A, Psychometric curves (% of upward choice as a function of visual slant), color coded based on the animal’s pitch. Dots: data points; solid lines: curve fits. The colored broken lines indicate the positions at which the curves’ PSE (i.e., 50% upward choice) should be if the animals perform the task perfectly. B, PSE as a function of pitch angle. Black dots and error bars represent the mean PSE and the 95% interval of the mean. Color bands represent the 95% confidence interval of a linear regression between PSE and pitch angle. The percentage of compensation is the opposite of the slope of the regression line. The slope and 95% interval of the slope are indicated. C, Perceptual threshold as a function of pitch angle, obtained from the curve fits in A. Error bars represent the 95% confidence interval.
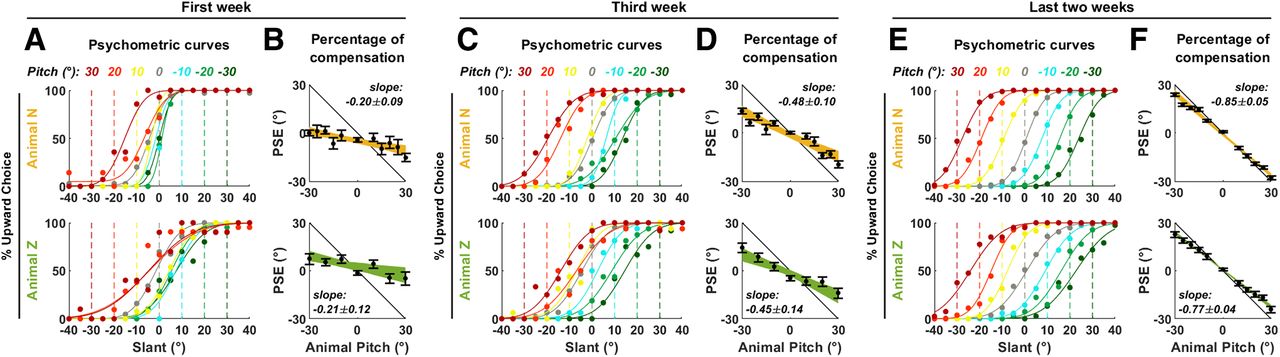
- Figure 3.
Animal performance following labyrinthectomy. Psychometric curves and percentage of compensation in animals N and Z (A, B) immediately following labyrinthectomy, (C, D) during the third week, and (E, F) during last two weeks of recordings. Same legend as in Figure 2A,B.
- Figure 4.
VOR. A–D, Horizontal or vertical eye position during three cycles of yaw (0.5 Hz, ±10°; top) or pitch (0.5 Hz, ±11.2°) rotation in darkness, before (middle) and after (bottom).
- Figure 5.
Dynamics of recovery following labyrinthectomy. A, Percentage of compensation as a function of time (number of weeks) since labyrinthectomy in animals N (yellow) and Z (green). Bars represent 95% confidence intervals. B, Different testing schedule for animals N and Z after labyrinthectomy. C, Same data as in panel A, but displayed as a function of testing days since labyrinthectomy. Data are pooled over a 5-d time window (±2 d around each time point), and the percentage of compensation is computed as in Figure 2B. The colored bands represent the 95% confidence interval of the percentage of compensation. Exponential curve fits to the average percentage of compensation are shown by solid black curves; the broken black curve represents curve fitted in animal Z where data between 30 and 60 d is excluded. D, Average perceptual threshold (across all psychometric curves recorded within a 5-d time window) as a function of the number of testing days since labyrinthectomy. The colored bands represent the confidence interval of the mean. In A, C, D, the baseline performance before labyrinthectomy is represented by broken lines and confidence intervals on the right side of the plots.
- Figure 6.
Sensory fusion model. A, Overview of the model. Vestibular (green) and proprioceptive (red) sensory signals encoding head pitch, as well as prior information (gray) are combined to generate a final pitch estimate PFINAL (orange). B–D, Model simulation. Panel B shows the optimal sensory weights in intact animals and following BVL. Same color code as in A. After BVL, the vestibular weight is shown in light green color to emphasize that the vestibular modality is silenced although its weight is unchanged. Panel C shows the total weight of sensory signals, which corresponds to the percentage of compensation. Panel D shows the variability of the final pitch estimate.


In this issue


